


Abstract
We investigate the ultraviolet and optical properties and environment of low-redshift galaxies detected in the Herschel Astrophysical Terahertz Large Area Survey (H-ATLAS) science demonstration data. We use the Sloan Digital Sky Survey seventh release and the Galaxy And Mass Assembly data base to select galaxies with  mag in the redshift range 0.02 ≤ z ≤ 0.2 and look for their submillimetre counterparts in H-ATLAS. Our results show that at low redshift, H-ATLAS detects mainly blue/star-forming galaxies with a minor contribution from red systems which are highly obscured by dust. In addition we find that the colour of a galaxy rather than the local density of its environment determines whether it is detectable by H-ATLAS. The average dust temperature of galaxies that are simultaneously detected by both PACS and SPIRE is 25 ± 4 K, independent of environment. This analysis provides a glimpse of the potential of the H-ATLAS data to investigate the submillimetre properties of galaxies in the local universe.
1 INTRODUCTION
The wide range of observed physical characteristics of galaxies is indicative of a large variance in galaxy formation history. Observations show that the environment of a galaxy plays an important role in shaping its observed properties. Dressler (1980) showed that galaxy morphology is a strong function of galaxy density and numerous studies since then have demonstrated the dependence of galaxy properties on local environment (Lewis et al. 2002; Gómez et al. 2003; Balogh et al. 2004a,b; Blanton et al. 2005; Park et al. 2007; O’Mill, Padilla & Lambas 2008; Ball, Loveday & Brunner 2008; Lee et al. 2010).
Results from large sky surveys such as the Sloan Digital Sky Survey (SDSS) have revealed that the distribution of galaxy colours is bimodal, i.e. the so called ‘blue cloud’ versus the ‘red sequence’ (Strateva et al. 2001; Baldry et al. 2004). The relative numbers of blue and red galaxies at a fixed luminosity are observed to vary strongly with local density, with blue and red galaxies predominantly populating low- and high-density environments, respectively (e.g. Balogh et al. 2004b; Ball et al. 2008). The major factors that influence the observed colour of a galaxy are its star formation history (SFH), the amount of dust attenuation and metallicity (Johnson et al. 2006, 2007). The vast majority of galaxies in the blue cloud are actively forming stars while the red sequence consists mainly of early-type passive galaxies (i.e. having little or no current star formation) with additional minor contributions from heavily obscured star-forming galaxies or edge-on systems.
Analyses of the dust attenuation in star-forming galaxies suggest that in comparison to quiescent systems, star-forming objects are heavily affected by internal dust extinction (Driver et al. 2007; Johnson et al. 2007; Wyder et al. 2007; Cortese et al. 2008; Tojeiro et al. 2009). In such galaxies, ultraviolet (UV) radiation heats dust grains which then reradiate at far-infrared (FIR) wavelengths. However, thermally emitting dust detected by, for example, IRAS (at  m) can often only constitute a small fraction of a galaxy’s total dust mass. Results from the SCUBA Local Universe Galaxy Survey (Dunne & Eales 2001; Vlahakis, Dunne & Eales 2005), as well as those of the sample of the Virgo cluster studied in Popescu et al. (2002) and Tuffs et al. (2002), using the ISOPHOT instrument onboard the Infrared Space Observatory (ISO), show that there is a population of galaxies containing much larger proportions of cold dust that radiates at >100
  in submillimetre bands. As such, submillimetre observations provide invaluable information for estimating the total dust content of these galaxies which in turn helps us to understand relationships with other galaxy properties. For instance, although we know there is a clear division between the optical properties of galaxies on the red sequence and those in the blue cloud, we do not know if this is reflected in their submillimetre properties.
In the present study, we use submillimetre data acquired by the HerschelSpace Observatory as a part of the Herschel Astrophysical Terahertz Large Area Survey (H-ATLAS; Eales et al. 2010). The H-ATLAS survey is an open-time programme to survey ∼600 deg2 of the extragalactic sky over the wavelength range 110–500  using the Photodetector Array Camera and Spectrometer (PACS; Poglitsch et al. 2006) and Spectral and Photometric Imaging REceiver (SPIRE; Griffin et al. 2010). H-ATLAS also covers the largest area in a blind extragalactic survey with Herschel. One of the aim if to provide the FIR equivalent for the SDSS and Two-degree Field Galaxy Redshif (2dFGRS; Colless et al. 2001) surveys is to characterize the properties of nearby galaxies. Also, for all regions covered by H-ATLAS, spectroscopic completeness will be guaranteed only up to the redshift of the GAMA survey 1 (e.g. z ≲ 0.2; Driver et al. 2011). So detailed statistical analysis will mainly be possible in the local universe. Therefore it is crucial to understand what kind of nearby galaxies are detected by H-ATLAS to provide a useful characterization of the FIR properties of local galaxies. In addition, we are also going to characterize the relationship between the nature and environment of submillimetre sources detected in H-ATLAS. So by concentrating on sources at low redshifts, we are able to have a better estimation of the galaxy projected density since such measurements become difficult at higher redshifts due to a decrease in the observed limiting luminosity of galaxies with spectroscopic redshifts. Also, nearby sources can be spatially resolved far more easily (e.g. less blending), so that we can see where the submillimetre emission is coming from, unlike for sources at high redshifts.
The submillimetre data analysed in this study were acquired during Herschel’s Science Demonstration Phase (SDP) and cover an area of ∼14.5 deg2. Three main advantages of Herschel over previous infrared observatories are its broad wavelength range, high sensitivity and high angular resolution. The wavelength range in particular encompasses the peak of the far-IR/submillimetre part of the spectral energy distribution for low-redshift galaxies thus allowing accurate measurements of total dust mass. In contrast, other submillimetre surveys such as those conducted by the Balloon-borne Large-Aperture Submillimeter Telescope (BLAST) with observations at 250, 350 and 500  , have lower angular resolution and do not cover more than ∼20 deg2 of the extragalactic sky (Pascale et al. 2008; Devlin et al. 2009).
The layout of this paper is as follows. In Section 2, we provide a summary of our submillimetre sample selection, optical photometric and spectroscopic observations from the SDSS/GAMA surveys, and UV observations from GAMA/GALEX survey (Seibert et al., in preparation). A summary of the parameters estimated from our data is given in Section 3. Our final results and concluding remarks are given in Section 4.
2 DATA
We will use the SDSS DR7 (Abazajian et al. 2009) together with the Galaxy And Mass Assembly redshift survey (GAMA survey; Driver et al. 2011) to compile an optically selected sample of low-redshift galaxies, and from there, look at the optical properties of those sources detected by Herschel. Here, we summarize the data in each survey and describe our sample selection.
2.1 Optical/UV data
Optical sources used in this paper were initially taken from the SDSS DR7 (Abazajian et al. 2009). Our aim is to have an optically selected sample of galaxies with the criterion 0.02 ≤ z ≤ 0.2. To do this, all SDSS sources from the GALAXY table were selected and their positions were cross-matched within 0.5 arcsec with objects from the GAMA survey in order to extract their spectroscopic redshifts as well as colours. The GAMA survey is based on data from SDSS DR6 and UKIDSS-LAS (UKIRT Infrared Deep Sky Survey–Large Area Survey) DR4 and consists of three equatorial regions named GAMA-09h, GAMA-12h, and GAMA-15h. The field observed by Herschel, coincides with the GAMA-09h equatorial region (RA = 129°.0, 141°.0; Dec. =−1°.0, +3°.0) where its spectroscopic survey is complete up to Petrosian magnitude, r ≲ 19.4 (Robotham et al. 2010). Moreover, the GAMA data contains r-band defined aperture matched photometry in far-ultraviolet/near-ultraviolet (FUV/NUV) from GALEX and in ugriz optical bands from SDSS (Hill et al. 2011). We only select objects with the GAMA spectroscopic redshift quality parameter Q ≥ 3, which approves their inclusion in scientific analysis (Driver et al. 2011). In our optical sample, ∼1.4 per cent of sources with 0.02 ≤ z ≤ 0.2 have Q < 3.
We find a total of ∼3370 galaxies in the redshift range 0.02 ≤ z ≤ 0.2 within ≈12.5 deg2 of our ≈14.5 deg2 SDP field. The coverage is not complete, because the GAMA data goes down to Dec. =−1°.0 . In addition to optical fluxes, NUV magnitudes were available for ∼2680 galaxies (Hill et al. 2011). All magnitudes are corrected for Galactic extinction.
2.2 Submillimetre data
The H-ATLAS SDP data were acquired in 2009 November using Herschel’s parallel/fast scan mode, scanning at 60 arcsec s−1. In this mode, mapping by PACS at 100 and 160  and SPIRE at 250, 350 and 500
  were carried out simultaneously. The SDP data covers an area of ∼4°.0 × 3°.6 centred on (α, δ) ≈ (09h05m, +0°30′).
A complete description of the data reduction and noise analysis of PACS and SPIRE data are given in Ibar et al. (2010) and Pascale et al. (2011), respectively. Observed time-line data from both instruments were processed by using the Herschel Interactive Processing Environment (HIPE) using custom reduction scripts. Thermal drift in bolometer arrays was corrected by applying high-pass filtering. The naive map-making method of HIPE was used to project the two cross-scan time-line observations.
The estimated point spread functions (PSFs) of the final maps have full width at half-maximum (FWHM) values of 8.7, 13.1, 18.1, 25.2 and 36.6 arcsec at 100, 160, 250, 350 and 500  , respectively. The estimated 1σ noise levels at 100, 160, 250, 350 and 500
  are 25–30, 33–48, 6.6, 7.6 and 9.0 mJy beam−1, respectively (Ibar et al. 2010; Rigby et al. 2011).
Sources were extracted using the 250- map as described in Rigby et al. (2011). The typical positional error for a ≥5σ source is 2.5 arcsec or less. For each 250
  source, corresponding 350 and 500
  flux densities were measured by using the noise-weighted/beam-convolved 350 and 500-
 maps at the source position determined from the 250-
 map. Fluxes at 100 and 160
  were estimated by matching each 250
  source to the nearest PACS sources within a radius of 10 arcsec.
2.2.1 The submillimetre source catalogue
The H-ATLAS standard source catalogue of Rigby et al. (2011) is supplemented with cross-identification information from GAMA and SDSS DR7 surveys as described in Smith et al. (2011). A likelihood-ratio analysis (Sutherland & Saunders 1992) is performed by Smith et al. (2011) to match 250  sources to SDSS DR7 sources brighter than r = 22.4 mag. The probability that an optical source is in fact associated with the submillimetre source has been used to define the Reliability parameter. According to Smith et al. (2011), objects with Reliability≥ 0.8 are considered to be true matches to submillimetre sources.
While we use the SDSS galaxy IDs to obtain the H-ATLAS PACS and SPIRE submillimetre fluxes, we apply the same reliability cut as suggested by Smith et al. (2011), i.e. Reliability≥0.8 which guarantees that we are ∼93 per cent (∼83 per cent) complete in the redshift range 0.02 ≤ z ≤ 0.1 (0.1 < z ≤ 0.2). As such, throughout this paper, we refer to a ‘detected source’ as an SDSS galaxy with a ≥5.0 σ submillimetre couterpart that has Reliability≥ 0.8. Accordingly, we detect 496 galaxies at 250  of which 482 (∼97.2 per cent) have associated NUV fluxes. Thus in 14 galaxies (≲2.8 per cent) with submillimetre detections we found no UV counterpart, but this will not affect the main results of the paper.
3 ANALYSIS
3.1 Summary of source detection
The first step of our analysis is to determine the rate of source detection in H-ATLAS as a function of galaxy r-band magnitude. The r-band magnitude is useful since it can be used as a starting point in sample selection for other extragalactic studies of low redshift galaxies using the Herschel submillimetre data. To do so, for all galaxies, we plot (u − r) versus Petrosian magnitude rPetro corrected for Galactic extinction.2
As Fig. 1 shows, the overall distribution of galaxies (grey contour lines) in u − r colour is bimodal, showing blue cloud and red sequence galaxies. The overlaid data points represent galaxies with submillimetre detections made by SPIRE (left-hand panel) and PACS (right-hand panel). Horizontal and vertical histograms in each panel show the distribution of data points corresponding to individual SPIRE/PACS bands along the magnitude and colour axes, respectively.
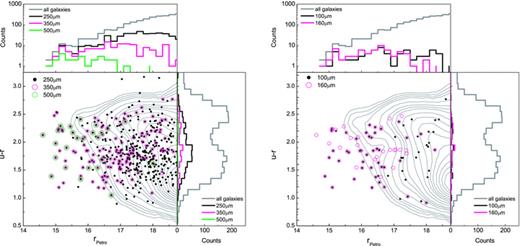
Colour–magnitude diagram of optically selected galaxies (grey contour lines) and their submillimetre counterparts with Reliability≥ 0.8 detected at ≳5σ by SPIRE (left-hand panel) and PACS (right-hand panel). Horizontal and vertical histograms show the distribution of galaxy optical colour (u − r) and r-band magnitude (rPetro), respectively. Colours represent: ‘grey’ all galaxies; ‘black’ sources with SPIRE 250  (left-hand panel) and PACS 100
  (right-hand panel) detections; ‘pink’ sources with SPIRE 350
  (left-hand panel) and PACS 160
  (right-hand panel) detections; ‘green’ sources with SPIRE 500
  detections.
Fig. 1 shows that the majority of galaxies with submillimetre detections are located in the blue cloud, with histograms of their colour peak around u − r ≈ 1.4 without substantial red tails. Thus, within the redshift slice of the current sample of galaxies, the survey on the whole is mapping the blue sequence. Furthermore, a comparison between histograms at 250  and those in other SPIRE/PACS bands show that the SPIRE 250-
 band is by far the most sensitive, since the estimated rate of detections are higher at 250
  compared to other submillimetre bands. This is due to the higher sensitivity of the SPIRE/PACS as well as the higher resolution of the 250-
 map. With this in mind, in the analysis that follows, we only consider sources with 250-
 detections.
 detections. The ‘left-hand’ and right-hand’ panels correspond to the redshift bins 0.02 ≤ z ≤ 0.1 and 0.1 ≤ z ≤ 0.2, respectively. The absolute magnitude Mr is given by
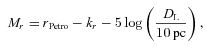
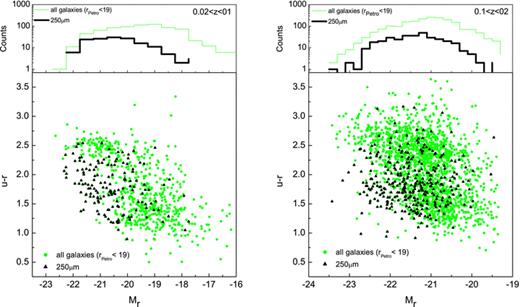
Same as in Fig. 1 but as a function of absolute r-band magnitude Mr and for 250  detections. The left- and right-hand panels correspond to the redshift bins 0.02 ≤ z ≤ 0.1 and 0.1 ≤ z ≤ 0.2, respectively, while horizontal histograms show the distribution of galaxy u − r colour and absolute r-band magnitude, respectively. Colour of data-points/histograms represent: ‘green’ all galaxies; ‘black’ sources with SPIRE 250
  detections.
In order to analyse our sample in more detail, we divide galaxies into two populations by applying a cut on their u − r colour indices. To find an optimum colour cut, a double-Gaussian function is fitted to the histogram for colour of all galaxies with  mag. The combined function has a minimum around u − r ≈ 2.2 mag. As such, from here on, unless otherwise stated, we refer to sources with u − r ≤ 2.2 mag and u − r > 2.2 mag as blue and red objects, respectively.
In Fig. 3 we examine the differential fraction of detections of galaxies at 250  as a function of r-band magnitude. We do this using
  counting errors (n is the number of detected sources in each magnitude bin) for all optical sources (black histogram) as well as blue (blue dashed histogram) and red (red dot–dashed histogram) galaxies. The results, as presented in Fig. 3, show that (i) In general ≳50 per cent of SDSS galaxies with rPetro≤ 17.0 mag have 250
  counterparts in H-ATLAS. (ii) The submillimetre detection rate falls off rapidly as one moves towards fainter galaxies. This is mainly due to a decrease in the observed signal-to-noise ratio toward fainter galaxies. (iii) In each bin of r-band magnitude and for rPetro≲ 18.0 mag, the detection fraction is ≳4 times higher for ‘blue’ galaxies when compared to the ‘red’ population, indicating that the vast majority of detected sources are blue objects. Although such blue sources are in general star-forming galaxies, it does not mean that 250-
 red detected objects are passive galaxies. We will discuss the properties of such sources in Section 3.3.

Histograms of the fraction of detected galaxies as a function of r-band magnitude. The black histogram includes all galaxies, while the two other histograms represent the detection rate of blue (blue dashed histogram; u − r ≤ 2.2) and red (red dash-dotted histogram; u − r > 2.2) sources, respectively.
Finally in Table 1 we present the total percentage of sources detected by H-ATLAS in samples of SDSS galaxies with differing limiting magnitudes. Samples of SDSS galaxies in the second column include galaxies with all colour indices, while those in the third and fourth columns contain blue and red objects, respectively.
The total fraction of sources detected by H-ATLAS among SDSS galaxies to differing limiting magnitudes, as shown in the first column. Samples of SDSS galaxies in the second column include galaxies with all colour indices, while those of third and forth columns contain blue and red objects, respectively.
| Sample limiting magnitude | Total fraction detected (per cent) | ||
| All colours | Blue (u − r ≤ 2.2 mag) | Red (u − r > 2.2 mag) | |
| rPetro≤ 16.0 mag | 53 ± 8 | 97 ± 18 | 27 ± 8 |
| rPetro≤ 17.0 mag | 42 ± 4 | 75 ± 7 | 17 ± 3 |
| rPetro≤ 18.0 mag | 29 ± 2 | 47 ± 3 | 11 ± 2 |
| rPetro≤ 19.0 mag | 17 ± 1 | 23 ± 2 | 9 ± 1 |
3.2 Environment of detected sources
Our results in Section 3.1 show that submillimetre detected sources are preferentially blue sequence galaxies. Thus, since blue sequence galaxies are much more frequent in low-density environments, we expect to find a lower detection rate in group/cluster environments than in the field.
 is determined from the following relation:
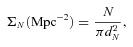
The rate of detection of the H-ATLAS sources as a function of the density parameter Σ5 is plotted in panel ‘a’ of Fig. 4. Error bars are Poisson errors on the mean. Detection rates have been estimated for galaxies with rPetro≤ 17.0 mag, since galaxies with larger r-band magnitudes are not systematically detected due to their low signal-to-noise ratios. In other words, the majority of fainter galaxies are not detected in H-ATLAS, irrespective of their environments.
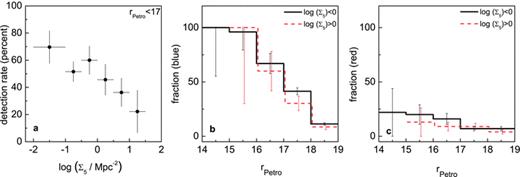
(a) The fraction of SDSS galaxies detected in H-ATLAS as a function of galaxy local density Σ5 estimated using equation (2). (b) Histograms of the fraction of detected blue (u − r ≤ 2.2 mag) galaxies as a function of r-band magnitude. ‘The red dashed histogram’ includes galaxies in high density regions (log (Σ5/Mpc2) ≥ 0) and ‘the black histogram’ includes those in low density regions (log (Σ5/Mpc2) < 0). (c) Same as in ‘b’ but for red (u − r > 2.2 mag) galaxies.
It is evident that the fraction of detected sources in low-density environments is larger by a factor of two in comparison to the rate of detection in high-density environments. This is expected, since the majority of detected objects in H-ATLAS are blue galaxies that preferentially populate the low-density regions. Results remain more or less the same if we use Σ4 or Σ6 instead of Σ5, showing that the dependence of the detection rate on environmental density is not sensitive to the choice of N in equation (2). To obtain a better understanding of the type of detected objects that populate either low- or high-density environments, we plot the rate of detection of galaxies as a function of rPetro for sources with different colours and densities in Fig. 4 (see panels ‘b’ and ‘c’).
The estimated projected density ranges from −2.0 to 2.0 on a logarithmic scale. We therefore define the threshold between low- and high-density environments at log Σ5≃ 0. As such, in panels ‘b’ and ‘c’ of Fig. 4, black histograms correspond to sources in low-density environments with log (Σ5/Mpc2) < 0 while red dashed histograms refer to the fraction of detected galaxies in high-density regions, i.e. log (Σ5/Mpc2) ≥ 0. In addition, sources in panel ‘b’ have index u − r ≤ 2.2 mag (e.g. blue objects) and the colour of those in panel ‘c’ is u − r > 2.2 mag (e.g. red objects). Although the number of blue galaxies is smaller in high-density regions, panel ‘b’ shows that the rate of detection remains the same in either environment. The situation is similar for the red galaxies, although the overall rate of detection of red objects is much smaller than for blue ones.
3.3 Nature of RED 250-![formula]() sources
sources
We have already seen that the majority (∼80 per cent) of galaxies detected in H-ATLAS at low redshift are blue galaxies while the rest ∼20 per cent are red. However, such a fraction on red detected sources is an upper limit since many of these galaxies might have traces of recent star formation activities which is not reflected in their optical u − r colour. In fact, UV–optical colours are more robust in classifying galaxies into blue/red categories in comparison to optical colours since they are more sensitive to recent star-formation activity (e.g. Schawinski et al. 2007; Cortese & Hughes 2009). The reason that we did not use UV–optical colour in Section 3.1 is that for ∼20 per cent of SDSS galaxies in the main sample, UV fluxes were not available from GAMA (see Section 2.1). These galaxies (e.g. those without UV counterpart) are basically faint while their optical colour distribution peaks around u − r ≈ 2.5. So in order to avoid any biases in analysing the fraction of source detection in previous sections, we were restricted to use the SDSS optical colours. Fortunately, NUV fluxes are available for ≳98 per cent of detected sources in 250  which enable us to investigate the spectral properties of galaxies with 250
  detections from their UV–optical colours.
Thus in Fig. 5(a), the NUV−r colour distributions for all the SDSS galaxies with available UV fluxes (black histogram) as well as those detected in 250  (green-shaded histogram) are shown. The black histogram in Fig. 5(a) shows a bimodality with a minimum around NUV−r ≈ 4.5 mag found from fitting a double-Gaussian function to it. In addition, ∼95 per cent of detected sources have NUV−r ≤ 4.5 mag (i.e. blue in UV–optical colour) and just a small population of detected sources have NUV−r ≥ 4.5 mag (i.e. red in UV–optical colour).
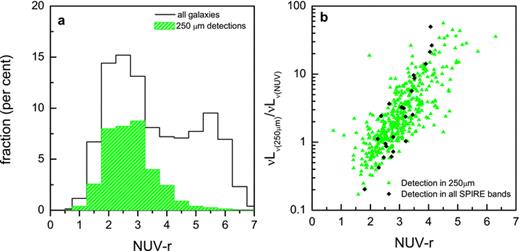
(a) NUV−r colour distributions for all the SDSS galaxies (black histogram) with available UV fluxes as well as those detected in 250  (green-shaded histogram). (b) The NUV−r versus νL250/νLNUV for galaxies with 250
  detections (green triangles). Overlaid (black diamonds) are galaxies detected in all SPIRE bands.
It is therefore interesting to know whether such red objects (i.e. NUV−r ≥ 4.5 mag) are obscured star-forming systems or whether they are a population of quiescent/passive galaxies. As such, for all detected galaxies, a UV–optical versus infrared colour–colour diagram is plotted in Fig. 5(b), where green triangles represent sources detected at 250  and highlighted data points (black diamonds) represent those H-ATLAS sources detected in all three SPIRE bands. Not surprisingly, the plot shows a correlation between NUV−r and νL250/νLNUV, with red galaxies having a higher νL250/νLNUV ratio than blue systems. A similar relation was found by Johnson et al. (2007) between the total far-infrared-to-near-ultraviolet luminosity ratio (LTIR/LNUV) and NUV−r for a sample of local galaxies selected from SDSS.
By combining this relation with the library of infrared spectral energy distributions of Chary & Elbaz (2001), we can investigate the real nature of the H-ATLAS sources with NUV−r > 4.5. According to Chary & Elbaz (2001), the νL250/LTIR luminosity ratio varies in the range ∼4–65. Even assuming the lowest possible value (i.e. ∼4), this implies a LTIR/LNUV ratio ∼6–250 for our red galaxies and we can use this value to estimate their NUV dust attenuation A(NUV). If we adopt the typical relation between LTIR/LNUV and A(NUV) for star-forming objects (e.g. Buat et al. 2005), we find A(NUV) ∼ 1–4 mag. Interestingly, even using the relations between LTIR/LNUV and A(NUV) presented by Cortese et al. (2008) which take into account the heating of dust coming from evolved stellar populations, we still obtain A(NUV) ≥ 0.2–1.8.3 Thus, this simple exercise shows that, not surprisingly, the vast majority (>90 per cent) of the red objects detected by H-ATLAS in our sample have ‘corrected’ NUV−r colour lower than 4.5 mag, i.e. they are red not because they are old/passive but mainly because they are obscured by dust. Of course, the presence (even if low in fraction) of a population of ‘truly passive’ systems in the H-ATLAS survey is a very intriguing possibility and might have important implications for our understanding of dust properties in galaxies. A detailed search for FIR emitting ‘passive’ systems and a discussion of their properties will be presented in a future work (Rowlands et al., in preparation).
3.4 Variation of temperature with density
Our findings in Section 3.2 show that, irrespective of their environments, the rate of detection of submillimetre sources remains the same in either high- or low-density regions. Therefore it might be interesting to test whether the submillimetre properties (e.g., colours and dust temperature) of detected sources in H-ATLAS correlate with the environment.
 . The equation for a single component blackbody is given by
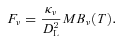
The uncertainties in the flux densities adopted from the standard H-ATLAS catalogue (e.g. Rigby et al. 2011) include the contribution from instrumental and confusion noise only. Thus we add the calibration errors of 10–20 per cent in the 100–160  PACS bands and 15 per cent in all SPIRE bands in quadrature to those given in the H-ATLAS catalogue. The best-fitting solution is found by minimizing the chi-squared (χ2) function, yielding an average uncertainty in the fitting of ±1.8 K for temperature. The average reduced χ2 value for all the fits is 0.7, with a standard deviation of 0.6. We find that the data in the 100–500
  range are accurately fitted by a single blackbody component.

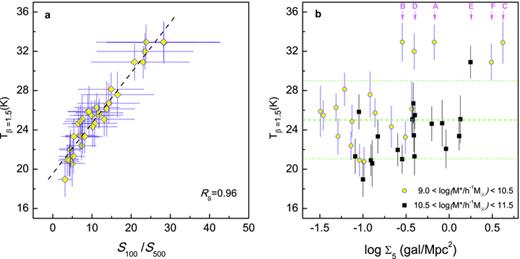
(a) Dust temperature versus submillimetre colour S100/S500. The dashed line shows the linear regression fit as described by equation (4). (b) Dust temperature as a function of the local density of galaxies, Σ5, for sources with ≥3σ detections in SPIRE/PACS bands. The green dashed line intersects the y-axis at the mean temperature of the whole sample (T ≈ 25 K) while green dotted lines represent the standard deviation of the mean temperature. Circles and squares represent galaxies with low (9.5 ≤ log (M*/h−2 M⊙) ≤ 10.5) and high (10.5 ≤ log (M*/h−2 M⊙) ≤ 11.5) stellar mass, respectively. The SDSS images of objects marked as ‘A’ to ‘F’ (with ‘A’ having the maximum temperature) are shown in Fig. 7.
From inspection of Fig. 6(b), it appears that the dust temperature does not show any systematic variation with the local density of either low-mass or high-mass galaxies. Further checks to see whether there is any correlation between either dust temperature or Σ5 with other parameters such as galaxy redshift, physical size and luminosity reveal none.
Interestingly, Fig. 6 shows the presence of six outliers (marked as ‘A’ to ‘F’) characterized by dust temperatures (T ≈ 32 ± 2 K) significantly higher than the values typically observed in the rest of our sample. SDSS images (see Fig. 7) reveal the presence of diffuse tidal stellar features associated with at least three (A, C and F) of the six outliers in Fig. 6. These are the only galaxies in our sample of 38 objects with obvious signatures of tidal disturbance, suggesting that the dust temperature has recently been enhanced via gravitational interaction.
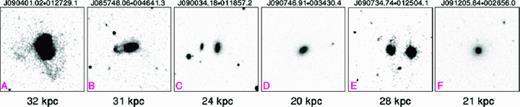
SDSS postage stamp images in the r band (70 × 70 arcsec2) of galaxies corresponding to the marked data points in Fig. 6. Images are sorted (left-to-right) according to the estimated dust temperature. The SDSS optical major isophotal diameter in the r-band (e.g. isoA-r) has been used to measure the optical linear diameter of each galaxy D25 in units of kpc as indicated on each panel.
4 CONCLUSIONS
This study presents a variety of statistics based on Herschel observations acquired during the H-ATLAS Science Demonstration Phase. We started with a sample of SDSS–GAMA galaxies at low redshift (0.02 ≲ z ≲ 0.2) and then characterized the properties of the matched submillimetre sources detected in the H-ATLAS survey from their colours. Our results can be summarized as follows.
At least ≈50 per cent of all SDSS galaxies with rPetro≲ 17.0 mag are detectable in H-ATLAS. In addition, the vast majority of detected sources in H-ATLAS are blue/star-forming objects. The majority of undetected faint/blue sources with rPetro > 17.0 mag remain undetected due to their lower signal-to-noise ratio. By using the NUV−r index as a proxy for galaxy colour, we detect a small fraction (∼5 per cent) of red objects (NUV−r > 4.5 mag) which are mainly galaxies with a higher level of dust attenuation. As such the red sequence population which is dominated by less-dusty/passive objects, do not seem to have a significant contribution to the observed submillimetre emission in red objects.
The rate of detection of galaxies decreases from ≈70 to 30 per cent as one moves from low-density to high-density regions. This is due to the fact that low-density regions are more populated by blue/dusty objects. However the detection rate of blue/red galaxies remains constant in either low or high density environments. In other words the colour of an object rather than its local density determines whether it is detectable in H-ATLAS.
The estimated dust temperature in galaxies with detections in all SPIRE bands and ≥3σ detections in PACS bands is 25 ± 4 K, regardless of the environment. However, we show that gravitationally perturbed systems have temperatures significantly higher than the rest of our sample.
The next crucial step is to extend our analysis to a wider range of galaxy densities/stellar masses to see how far the environment of galaxies could affect their observed submillimetre properties. While Herschel observations of the Virgo cluster are starting to reveal how the environment can affect the dust properties of cluster galaxies (Cortese et al. 2010), only a wide-area survey like H-ATLAS will make it possible to unveil the effects of nurture across the whole range of densities (from voids to the cores of clusters). Thus, once completed, the H-ATLAS survey together with data from the GAMA survey will offer a unique data set, spanning from the UV to the submm, with which to investigate the SFH of galaxies over a large range of galaxy densities/stellar masses. At the same time, properties such as dust temperature and dust mass/stellar mass of galaxies can be explored as a function of environment using PACS/SPIRE submillimetre fluxes. This will enable us to further investigate the correlation between SFH and dust properties of galaxies as a function of stellar mass and local density.
A detailed description of the GAMA survey is given in Section 2.1.
The SDSS Petrosian magnitude is a modified form of the Petrosian (1976) system in which galaxy fluxes are measured within a circular aperture  (Petrosian radius) such that the ratio of the local surface brightness in an annulus at
  to the mean surface brightness within
  , is equal to some constant value. Alternatively we can use the SDSS Model magnitude rModel though it does not change the results since from a sample of 10 000 galaxies within the magnitude/redshift range of our sample we find rPetro≈ rModel+ 0.07.
These values have been obtained by using the most extreme case discussed by Cortese et al. (2008), i.e. τ < 2.8, and they are thus lower limits to the real values for our sample.
The estimated mean temperature is  K in the case of β = 2.0. In fact our data show a strong correlation (RS = 0.99) between the estimated temperatures based on either values of β such that Tβ = 2.0 = 0.78(±0.01) × Tβ = 1.5+ 2.1(±0.2).
We would like to thank Prof. Bahram Mobasher for his constructive comments on our article.
The Herschel-ATLAS is a project with Herschel, which is an ESA space observatory with science instruments provided by European-led Principal Investigator consortia and with important participation from NASA. The H-ATLAS website is http://www.h-atlas.org/.
GAMA is a joint European–Australasian project based around a spectroscopic campaign using the Anglo-Australian Telescope. The GAMA input catalogue is based on data taken from the Sloan Digital Sky Survey and the UKIRT Infrared Deep Sky Survey. Complementary imaging of the GAMA regions is being obtained by a number of independent survey programmes including GALEX MIS, VST KIDS, VISTA VIKING, WISE, Herschel-ATLAS, GMRT and ASKAP, providing UV to radio coverage. GAMA is funded by the STFC (UK), the ARC (Australia), the AAO and the participating institutions. The GAMA website is http://www.gama-survey.org/.
Funding for the SDSS and SDSS-II has been provided by the Alfred P. Sloan Foundation, the Participating Institutions, the National Science Foundation, the US Department of Energy, the National Aeronautics and Space Administration, the Japanese Monbukagakusho, the Max Planck Society, and the Higher Education Funding Council for England. The SDSS Web Site is http://www.sdss.org/.
The SDSS is managed by the Astrophysical Research Consortium for the Participating Institutions. The Participating Institutions are the American Museum of Natural History, Astrophysical Institute Potsdam, University of Basel, University of Cambridge, Case Western Reserve University, University of Chicago, Drexel University, Fermilab, the Institute for Advanced Study, the Japan Participation Group, Johns Hopkins University, the Joint Institute for Nuclear Astrophysics, the Kavli Institute for Particle Astrophysics and Cosmology, the Korean Scientist Group, the Chinese Academy of Sciences (LAMOST), Los Alamos National Laboratory, the Max-Planck-Institute for Astronomy (MPIA), the Max-Planck-Institute for Astrophysics (MPA), New Mexico State University, Ohio State University, University of Pittsburgh, University of Portsmouth, Princeton University, the United States Naval Observatory, and the University of Washington.
REFERENCES
