-
PDF
- Split View
-
Views
-
Cite
Cite
Assaf Horesh, Dan Maoz, Stefan Hilbert, Matthias Bartelmann, Lensed arc statistics: comparison of Millennium simulation galaxy clusters to Hubble Space Telescope observations of an X-ray selected sample, Monthly Notices of the Royal Astronomical Society, Volume 418, Issue 1, November 2011, Pages 54–63, https://doi.org/10.1111/j.1365-2966.2011.19293.x
Close - Share Icon Share
Abstract
It has been debated for a decade whether there is a large overabundance of strongly lensed arcs in galaxyclusters, compared to expectations from Λ cold dark matter cosmology. We perform ray tracing through the most massive haloes of the Millennium simulation at several redshifts in their evolution, using the Hubble Ultra Deep Field as a source image, to produce realistic simulated lensed images. We compare the lensed arc statistics measured from the simulations to those of a sample of 45 X-ray selected clusters, observed with the Hubble Space Telescope, that we have analysed in Horesh et al. The observations and the simulations are matched in cluster masses, redshifts, observational effects, and the algorithmic arc detection and selection. At z= 0.6, there are too few massive-enough clusters in the Millennium volume for a proper statistical comparison with the observations. At redshifts 0.3 < z < 0.5, however, we have large numbers of simulated and observed clusters, and the latter are an unbiased selection from a complete sample. For these redshifts, we find excellent agreement between the observed and simulated arc statistics, in terms of the mean number of arcs per cluster, the distribution of number of arcs per cluster and the angular separation distribution. At z≈ 0.2 some conflict remains, with real clusters being ∼3 times more efficient arc producers than their simulated counterparts. This may arise due to selection biases in the observed subsample at this redshift, to some mismatch in masses between the observed and simulated clusters or to physical effects that arise at low redshift and enhance the lensing efficiency, but which are not represented by the simulations.
1 INTRODUCTION
Galaxy clusters are the largest bound structures in the Universe, and are natural laboratories for studying astrophysical processes and cosmology. Cluster formation times depend on the cosmological model (e.g. Richstone, Loeb & Turner 1992). When a cluster becomes a self-gravitating entity, it detaches from the universal expansion and therefore contains information on the mean density of the universe at that time. Thus, measuring the mass function and mass profiles of clusters has proved to be important for constraining cosmological parameters (e.g. Voit 2005; Mortonson, Hu & Huterer 2011). Since the discovery of a gravitationally lensed arcs in galaxy clusters (Lynds & Petrosian 1986; Soucail et al. 1987a,b), gravitational lensing has been used to study the evolution of cluster profiles and masses, as well as other cluster characteristics having potential diagnostic power, such as ellipticity and substructure. One approach has been to perform detailed modelling of individual clusters using weak and strong lensing (e.g. Abdelsalam, Saha & Williams 1998; Broadhurst et al. 2005, Leonard et al. 2007). However, since this kind of approach is mostly suited for clusters which exhibit numerous lensed features, the results may not be representative of the vast majority of clusters. Hence, a complementary approach is to measure the statistics of lensed arcs in samples of clusters, studied as a population.
In an early study of arc statistics, Bartelmann et al. (1998; hereafter B98) compared the number of giant arcs in an observed sample to predictions from Λ cold dark matter (ΛCDM) cosmology. Using ray tracing, they lensed artificial background galaxies at z = 1 through galaxy clusters formed in an N-body simulation. The lensing cross-sections they derived from their lensed images, together with the density of background galaxies measured by Smail et al. (1995), were used to predict the number of arcs over the whole sky. The predicted number of arcs were compared to the number observed in a sample of 16 X-ray selected clusters from the Einstein Observatory Extended Medium Sensitivity Survey (EMSS; Le Fevre et al. 1994). B98 found that the observed number of arcs was higher by an order of magnitude than the predictions of the (now-standard) ΛCDM cosmological model.
The ‘order of magnitude’ problem pointed out by B98 stimulated several subsequent studies, both observational (e.g. Zaritsky & Gonzalez 2003; Gladders et al. 2003) and theoretical. Wambsganss, Bode & Ostriker (2004) studied the dependence of the cross-section for arc formation on the lensed source redshift. They found that the cross-section is a steep function of source redshift, and concluded that the problem raised by B98 could be resolved by adding sources at redshifts greater than zs = 1 to the simulations. Li et al. (2005), however, found that the cross-section dependence on source redshift is shallower than the one found by Wambsganss et al. (2004). Dalal, Holder & Hennawi (2004) repeated the B98 ray-tracing analysis of artificial sources using a larger sample of simulated clusters (of which B98 had used a subset) and compared their results to a larger, 38 clusters, EMSS sample (Luppino et al. 1999). They concluded that the observed arc statistics and the ΛCDM model predictions are consistent.
The artificial clusters used by the above studies represented the cluster dark matter component only. Adding a mass component associated with the baryonic mass of the cluster galaxies to the artificial clusters can affect the cross-section for forming giant arcs in several ways (Meneghetti et al. 2000). The critical lines will curve around the cluster galaxies, thus increasing the cross-sections. On the other hand, the galaxies will split some of the long arcs into shorter arclets, thus decreasing the giant arc cross-section. After studying these two competing effects, Meneghetti et al. (2000) concluded that the effect of cluster galaxies on the lensing cross-section is minor, a conclusion also supported by an analytical study by Flores, Maller & Primack (2000). Later, Meneghett, Bartelmann & Moscardini (2003) found that the cD galaxy in each cluster does increase the cross-section, but only by up to ∼50 per cent for realistic parameters. Puchwein et al. (2005) have studied the indirect lensing influence of intracluster (ICM) gas, through its effect of steepening of the dark matter profile, which can increase the lensing cross-section by a factor of ∼1.5–3 (but see Rozo et al. 2008).
Torri et al. (2004) studied the effect of cluster mergers on arc statistics by following the lensing cross-section of a simulated cluster with small time-steps, as the cluster evolves. They concluded that, during a merger, the strong-lensing cross-section can be enhanced by an order of magnitude in an optimal projection, potentially providing yet another contribution towards resolving the problem reported by B98, if X-ray selected cluster samples are dominated by merging haloes. The effects of cluster mass, ellipticity, substructure and triaxiality on the lensing cross-section have also been studied extensively (e.g. Bartelmann, Steinmetz & Weiss 1995; Oguri, Lee & Suto 2003; Hennawi et al. 2007; Meneghetti et al. 2007).
As summarized above, the properties of the galaxy clusters and the redshifts of the sources were at the main focus of most studies in the past decade. However, the simulations in most of these studies were oversimplified in several respects. Artificial, constant surface density, background galaxies, often at a single redshift, were used. No observational effects, other than simple flux limits, were taken into account when considering arc detection. A more realistic approach was taken by Horesh et al. (2005; hereafter H05) who used the Hubble Deep Field (HDF; Williams et al. 1996) as a background image in their lensing simulations, thus lensing real background galaxies with realistic light profiles, with each galaxy at its photometric redshift. In addition, in H05 we created realistic lensed images by adding observational effects such as detector background, cluster galaxy light and the Poisson noise that they produce. The lens statistics from the simulations were compared to the statistics of a sample of 10 X-ray selected clusters at z = 0.2 observed at high resolution with the Hubble Space Telescope (HST) by Smith et al. (2005). The HST sample and the simulated cluster sample were matched in mass and redshift. Lensed arcs were detected in both the real and the simulated data using an automatic arcfinder that we developed. In addition to the objectivity this provided, it permitted measuring and comparing statistics of fainter and shorter arcs than those considered in previous studies. From a comparison between the number of arcs per cluster that we found in our simulation to the number in the observed sample, we concluded that the lensed arc-production efficiency of clusters from the ΛCDM simulation was, to within errors, consistent with observations. The H05 results, however, were dominated by small number statistics, both in the simulations [the limited volume of the GIF N-body simulations by Kauffmann et al. (1999) that we used resulted in only five massive clusters] and in the observed sample of only 10 clusters. The small angular size of the HDF also raised a concern of cosmic variance in the source population.
In the last few years, cosmological N-body simulations with improved resolution and larger volume have become available, including the Millennium simulation (Springel et al. 2005). Clusters from the Millennium simulation were used by Hilbert et al. (2007) to study the strong lensing optical depth dependence on various parameters, e.g. magnification and source redshift. Hilbert et al. (2008) studied the influence of stellar mass on the lensing optical depth of Millennium simulation haloes. They found that adding the stellar mass to dark-matter-only haloes increases the cross-section for the formation of multiple images, but mainly at small radii, i.e. r < 10 arcsec. Puchwein & Hilbert (2009) have further found that line-of-sight structures can increase the cross-section for giant arcs, but this is important only in low-mass clusters (a similar result was found by Wambsganss, Bode & Ostriker 2005). However, Hilbert et al. (2007, 2008) did not perform realistic lensing simulations as in H05. Lensing cross-sections of clusters that include gas, from the smoothed particle hydrodynamics (SPH) simulation (Gottlöber & Yepes 2007), have been studied recently by Meneghetti et al. (2010) and Fedeli et al. (2010).
From the observational point of view, in Horesh et al. (2010, hereafter H10) we have recently produced a large, empirical arc-statistics sample, based on HST observations of ∼100 clusters. This cluster sample was large enough to separate into subsamples, according to optical or X-ray selection, and by cluster redshift, and to analyse the arc statistics of each subsample separately. We found that X-ray luminous clusters produce ∼1 arc per cluster, but optically selected clusters are five times less efficient. Optically selected samples (which have been used in some arc-statistics studies) apparently probe lower cluster masses than X-ray selected samples, despite the similar optical luminosities of the two types of clusters. The size of the X-ray selected H10 sample of arcs lowers significantly the Poisson errors in the observational results, compared to the sample of H05. We are therefore now in the position to compare the improved observed statistics with improved model predictions, to see whether the arc-statistics problem can be confirmed or resolved.
In this paper, we present a new set of realistic lensing simulations produced by using clusters at various redshifts from the Millennium simulation as lenses, and lensing the Hubble Ultra Deep Field (UDF), which is several times larger than the HDF. The calculations are tailored to match the observed X-ray selected sample of H10. In Section 2, we present the sample of simulated clusters. The lensing simulation method is described in Section 3. The simulation results are presented in Section 4, with a comparison in Section 5 to the observed arc statistics reported in H10. We summarize our conclusions in Section 6.
2 THE MILLENNIUM CLUSTER SAMPLE
In the present work, we produce a large sample of realistic lensed images using simulated clusters from one of the largest N-body cosmological simulations, the Millennium simulation (Springel et al. 2005). The Millennium simulation consists of N∼ 1010 particles in a box of size 500 h−1 Mpc. Each particle has a mass of mp = 8.6 × 10⁸h−1 M⊙. This is a factor ∼20 lower than the mass of the particles in the GIF simulation of Kauffmann et al. (1999), used in the arc-statistics studies of B98 and H05. Another improvement in the Millennium simulation is its spatial resolution of 5 h−1 kpc, compared to 25 h−1 kpc in the GIF simulation. The ΛCDM cosmological parameters used in the simulation are Ωm=Ωdm+Ωbr = 0.25, Ωbr = 0.04, ΩΛ = 0.75, σ8 = 0.9, n = 1 and h = 0.73, where the Hubble constant H0 = 100 h km s−1 Mpc−1. Ωm, Ωdm and Ωbr are the total matter, dark matter and baryonic matter densities (in units of the critical closure density), respectively. σ8 and n are the normalization and the spectral index, respectively, of the cold dark matter power spectrum. These parameters are consistent with the combined analysis of the first year Wilkinson Microwave Anisotropy Probe (WMAP) data (Spergel et al. 2003) and the 2dFGalaxy Redshift Survey (2dFGRS; Colless et al. 2001). The main difference between these parameters and the parameters of the 7-yr WMAP results (Larson et al. 2011) is in the value of σ8, for which the most recent estimate is σ8 = 0.801 ± 0.030. While σ8 affects the cluster mass function, it is not expected to have a strong effect on the structure of a cluster of given mass (e.g. Fedeli et al. 2008), and hence our main conclusions will likely not be affected by this choice.
A halo catalogue of the full Millennium simulation, which is publicly available,1 was compiled using a friends-of-friends algorithm with a linking length of 0.2 (Lemson et al. 2006). We obtained a set of simulated clusters from the Millennium simulation at redshifts z = 0.2, 0.4 and 0.6. The z = 0.2 snapshot was chosen for comparison with the results of H05. The other two snapshots were chosen for comparison with the observed sample presented in H10. Since we are interested in the lensing efficiencies of the most massive clusters in the simulation, we chose those clusters with masses M200≥ 0.7 × 10¹⁵h−1 M⊙, which for the adopted Hubble parameter correspond to M200≥ 1 × 10¹⁵ M⊙. Here, M200 is the mass enclosed within r200, the radius within which the average density equals 200 times the critical cosmological density at the observed redshift. The resulting simulated cluster sample consists of 14 clusters at z = 0.2, and seven and four clusters at redshifts z = 0.4 and 0.6, respectively. Fig. 1 shows the mass distributions of the three simulated subsamples.
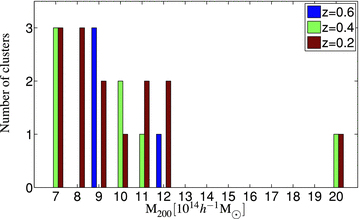
Mass distributions of the simulated Millennium cluster subsamples at z = 0.2 (red), z = 0.4 (green) and z = 0.6 (blue).

In addition to the dark matter halo catalogue, Lemson et al. (2006) have released a public galaxy population catalogue. The galaxy properties are based on semi-analytical models by De Lucia & Blaizot (2007) and Bower et al. (2006). In our work, we use the galaxy catalogue based on De Lucia & Blaizot. As in Hilbert et al. (2008), we add the contribution of the stellar mass of the cluster galaxies to the final deflection angle maps. When we perform our lensing simulations (see Section 3), the above catalogue is also used for adding the light of the cluster galaxies to our simulated lensed images.
3 LENSING SIMULATIONS
Our lensing simulations are calculated in a manner similar to that in H05. They are realistic in the sense that we lens real galaxies, pixel by pixel, using a real image of a field of galaxies as the background image in our simulations. We thus incorporate galaxy properties such as the galaxy luminosity function, the redshift distribution, and the size and shape distributions directly into the simulations, avoiding the need to add by hand the effects of these inputs later on. While in H05 we used the HDF as a source image, in our new simulations we use the UDF as our background source image.
The UDF is a ∼1 Ms exposure of 11 arcmin2 in the southern sky, obtained using the Advanced Camera for Surveys on HST. The exposure time was divided among four filters, F435W, F606W, F775W and F850LP. The limiting magnitude is mAB∼ 29 for point sources in all bands. Coe et al. (2006) have produced a photometric redshift catalogue of the UDF, containing 8042 objects detected at the 10σ level. We use this catalogue to build the redshift image of the UDF, which is necessary for our lensing simulations, in which the pixels of each source are assigned the source photometric redshift. In addition to that redshift image, we use the UDF F775W filter (I-band) image as the source background flux image in our simulations. In what follows, we use a limiting magnitude of 24 for the detection of simulated arcs, and hence arcs with magnifications of up to 30 (which are the largest ones we find in practice) originate from unlensed sources of ∼27.5 mag. This is still a factor 10 brighter than the limiting magnitude of the UDF. Stated differently, the UDF is a sufficiently deep source image for magnifications up to ∼100, and such large magnifications behind clusters are unlikely.


Once the light of the cluster galaxies is added, Poisson photon noise is calculated for each pixel based on its total light (lensed galaxies, cluster galaxies and background). The background value is randomly chosen from a Gaussian distribution with a mean of 120e− per original sized Advanced Camera for Surveys (ACS) pixel for a total exposure time of 1440 s, and a 1σ dispersion of 40e−, which is the distribution of the background levels that we find in the observed sample of H10. Furthermore, a readout noise of 5e− per exposure is added to the simulated lensed images.
Our simulations consist of three projections and five source background realizations for each cluster, where in each realization the UDF source image is shifted to a different random position behind the lens. Hence, the simulations result in 210, 105 and 60 simulated images of clusters at redshifts 0.2, 0.4 and 0.6, respectively. Fig. 2 shows an example of the simulated images of the same cluster, with different realizations, at two different redshift snapshots.
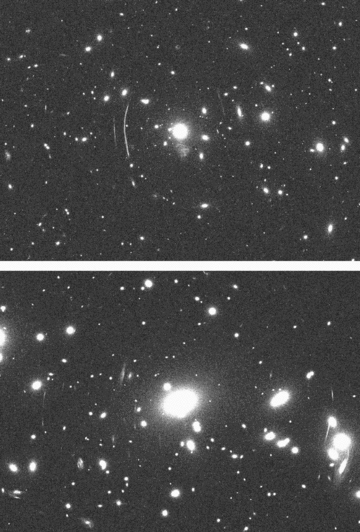
Two examples of realistic simulated lensed images. The two 160 × 100 arcsec2 images are of the same cluster at redshift z = 0.4 (top panel), and after it has evolved to z = 0.2 (bottom panel).
After producing the final set of simulated images, we automatically detect arcs in them. In H10, we used two different arcfinders on the observational data, that of H05 and that of Seidel & Bartelmann (2007). In the current analysis of this large simulated data set, to save effort we use only the H05 arcfinder. However, from our experience in H10, the fraction of additional arcs that we would have found using both the H05 and Seidel & Bartelmann (2007) arcfinders, compared to the H05 arcfinder alone, is 5 per cent at most, and therefore of little consequence to our results.
The H05 arc-detection algorithm is based on application of the SExtractor (Bertin & Arnouts 1996) object identification software. The output of repeated SExtractor calls, using different detection parameters each time, is filtered using some threshold of object elongation. The final SExtractor call is executed on an image combined from the filtered ‘segmentation image’ outputs of the previous calls. The arc candidates detected in that last call are included in the final arc catalogue if they meet the required detection parameters defined by the user. We apply the same detection thresholds of arc length-to-width ratio l/w≥ 8 and total magnitude mI < 24, which were used to detect arcs in the observed samples in H10, also maintaining a 60-arcsec search radius around the cluster centre. The arcs that are automatically detected are then visually inspected in order to remove spurious detections, such as diffraction spikes and spiral galaxy arms.
4 RESULTS
In the simulations described above, we detect, in the cluster samples at z = 0.2, 0.4 and 0.6, numbers of arcs of Narcs = 137, 90 and 25 with l/w > 8, and Narcs = 84, 64 and 18 arcs with l/w > 10, respectively (see Fig. 3, for some examples). The arcs span a magnitude range of 18.8 < mI < 24, and their l/w ratios are in the range 8–44, with a median value of 14. As shown in Fig. 4, at least 50 per cent of the effective simulated cluster lenses, i.e. clusters that produce at least one arc, produce multiple arcs.
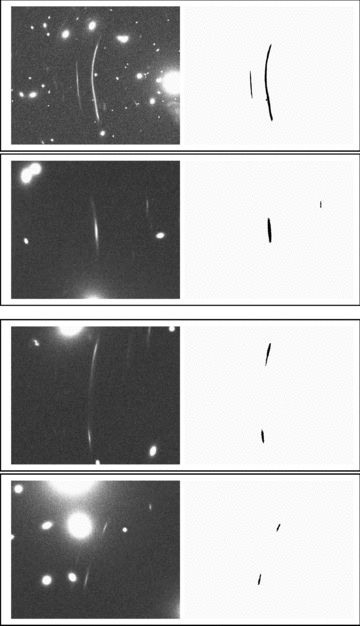
Four examples of simulated arcs (left half of each panel) and their detections by the arcfinder algorithm (right halves).
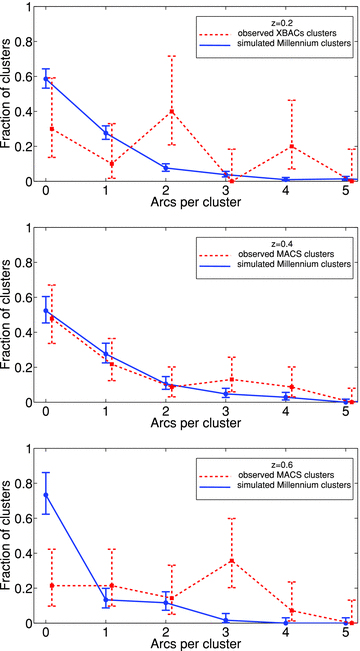
Number distributions of arcs in the simulated Millennium clusters (blue solid line) and in the observed cluster samples (red dashed line): XBACs clusters (H05) and MACS clusters (H10) at redshifts z = 0.2 (top panel), z = 0.4 (middle panel) and z = 0.6 (bottom panel). Note the excellent agreement, for the z≈ 0.4 samples, between the observed and the simulated arc statistics.
We now calculate the mean arc production efficiency – the number or detected arcs per cluster – at each redshift. We study the efficiencies of our entire sample and also of the subset that is composed of simulated clusters with masses M200≥ 1015h−1 M⊙. This subset represents the mass range of MAssive Cluster Sample (MACS) clusters analysed in H10, and consists of six, four and one clusters at z = 0.2, 0.4 and 0.6, respectively (out of the original 14, seven and four clusters at these redshifts). It appears that, in the entire sample of clusters, the efficiencies, which are summarized in Table 1, peak at z = 0.4, with a 2σ significance. At that redshift, the entire sample of seven clusters produces 0.86+0.10− 0.09 and 0.61+0.09− 0.08 arcs per cluster with l/w≥ 8 and l/w≥ 10, respectively. The subset of the most massive clusters produces 1.17+0.10− 0.09 and 0.85+0.14− 0.12 arcs per cluster for the two values of l/w, respectively. Fig. 4 shows the distribution of arc numbers per cluster, which are compared in Section 5, below, to the observed distributions of H10. The errors above, and throughout the paper, are Poisson.
| Subsample | Nimages | Nlenses | Narcs | Arcs per cluster | ||
| (l/w≥ 8) | (l/w≥ 10) | (l/w≥ 8) | (l/w≥ 10) | |||
| Clusters with mass M200≥ 7 × 10¹⁴h−1M⊙ | ||||||
| z = 0.2 | 210 | 87 | 137 | 84 | 0.65+0.06− 0.06 | 0.40+0.05− 0.04 |
| z = 0.4 | 105 | 50 | 90 | 64 | 0.86+0.10− 0.09 | 0.61+0.09− 0.08 |
| z = 0.6 | 60 | 16 | 25 | 18 | 0.42+0.1− 0.08 | 0.30+0.09− 0.07 |
| Clusters with mass M200≥ 1015h−1M⊙ | ||||||
| z = 0.2 | 90 | 56 | 99 | 59 | 1.1+0.11− 0.11 | 0.66+0.10− 0.09 |
| z = 0.4 | 60 | 35 | 70 | 51 | 1.17+0.10− 0.09 | 0.85+0.14− 0.12 |
| z = 0.6 | 15 | 8 | 12 | 8 | 0.80+0.40− 0.23 | 0.53+0.26− 0.18 |
Note. The number of images in the second column is calculated by multiplying the number of clusters by the number of projections (3) and then by the number of source background realizations (5). The number of lenses in the third column is the number of images in which at least one arc with l/w≥ 8 was detected.
| Subsample | Nimages | Nlenses | Narcs | Arcs per cluster | ||
| (l/w≥ 8) | (l/w≥ 10) | (l/w≥ 8) | (l/w≥ 10) | |||
| Clusters with mass M200≥ 7 × 10¹⁴h−1M⊙ | ||||||
| z = 0.2 | 210 | 87 | 137 | 84 | 0.65+0.06− 0.06 | 0.40+0.05− 0.04 |
| z = 0.4 | 105 | 50 | 90 | 64 | 0.86+0.10− 0.09 | 0.61+0.09− 0.08 |
| z = 0.6 | 60 | 16 | 25 | 18 | 0.42+0.1− 0.08 | 0.30+0.09− 0.07 |
| Clusters with mass M200≥ 1015h−1M⊙ | ||||||
| z = 0.2 | 90 | 56 | 99 | 59 | 1.1+0.11− 0.11 | 0.66+0.10− 0.09 |
| z = 0.4 | 60 | 35 | 70 | 51 | 1.17+0.10− 0.09 | 0.85+0.14− 0.12 |
| z = 0.6 | 15 | 8 | 12 | 8 | 0.80+0.40− 0.23 | 0.53+0.26− 0.18 |
Note. The number of images in the second column is calculated by multiplying the number of clusters by the number of projections (3) and then by the number of source background realizations (5). The number of lenses in the third column is the number of images in which at least one arc with l/w≥ 8 was detected.
The simulated cluster lenses exhibit some arcs at large angular separations from the cluster centres. As shown in Fig. 5, the distributions of arc angular separation are broad. The arcs produced by clusters at z = 0.6 have a median radial separation of 26 arcsec, compared to a median separation of 33 arcsec in the two lower redshift snapshots, with a standard deviation of 14 arcsec in all three redshift snapshots. The angular separation distributions are compared to the observed distributions of H10 in Section 5, below.
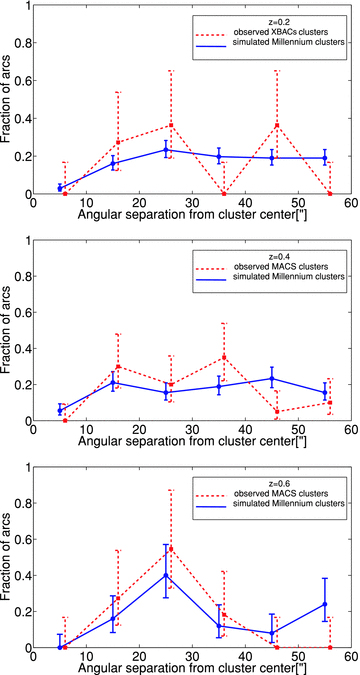
As in Fig. 4, but for the distributions of arc separations from cluster centres.
4.1 Lensed source properties
Our simulations allow us also to trace back the background galaxies that were lensed into the arcs that we detect. We can thus study the properties of this galaxy population in comparison to the full UDF galaxy sample. We first examine the redshift distribution of the lensed arcs. As seen in Fig. 6, the arcs formed by clusters at redshifts z = 0.2 and 0.4 originate mostly from galaxies at z∼ (0.5–1.5), with a median redshift of z = 1.1, while the redshift distribution of arcs produced by clusters at z = 0.6 has a median of z = 2.2. Our numerically predicted arc–redshift distributions are another statistic that can be compared to ongoing and future observations (e.g. Bayliss et al. 2011).
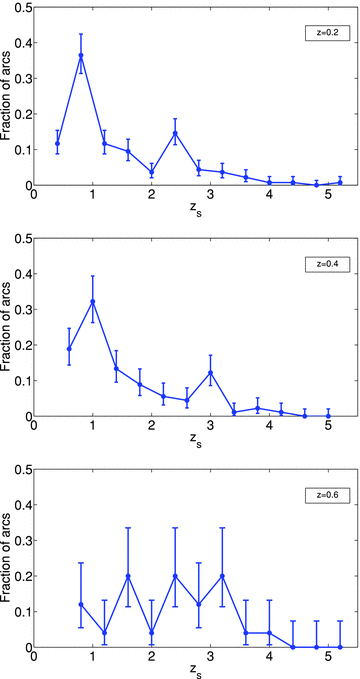
Arc–redshift distributions in Millennium clusters at z = 0.2 (top panel), z = 0.4 (middle panel) and z = 0.6 (bottom panel).
Yet another interesting statistic to look at is the ellipticity distribution of the background galaxies that are lensed into arcs. We have used the Coe et al. (2006) UDF detection image in order to fit an ellipse to each UDF galaxy. The measurement of the semimajor and semiminor axes was done with SExtractor (Bertin & Arnout 1996). Fig. 7 shows both the ellipticity distribution of all the galaxies in the UDF and the distribution of only the galaxies which were actually lensed into arcs. Based on a Kolmogorov–Smirnov (KS) test, the two distributions differ at the 99.9 per cent confidence level. Clearly, the fraction of high-ellipticity galaxies is higher in the population that is being lensed into arcs than the fraction in the whole UDF galaxy sample. A similar result has been found by Gao et al. (2009), who performed lensing simulations using galaxies from the Cosmic Evolution Survey fields.
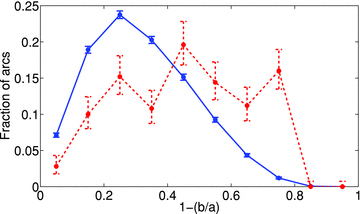
Ellipticity distributions of all UDF galaxies (blue solid line), and of galaxies which are lensed into arcs (red dashed line).
5 COMPARISON WITH OBSERVATIONS
Our new simulations of arc statistics at various redshifts can now be used for a comparison with the observed statistics. We compare our calculations both with the arc statistics of the MACS (Ebeling, Edge & Henry 2001) at z = 0.4 and 0.6, that were presented in H10, and with the arc statistics for X-ray Brightest Abell-type Clusters of galaxies (XBACs) clusters at z = 0.2 that were measured by H05.
MACS (Ebeling et al. 2001) has provided a statistically complete, X-ray selected sample of the most X-ray luminous galaxy clusters at z > 0.3. Based on sources detected in the Röntgen Satellite (ROSAT) All-Sky Survey (RASS; Voges et al. 1999), MACS covers 22 735 deg2 of extragalactic sky (|b| > 20°). The present MACS sample, estimated to be at least 90 per cent complete, consists of 124 clusters, all of which have optical spectroscopic redshifts. Owing to the high X-ray flux limit of the RASS and the lower redshift limit of z = 0.3, MACS clusters have typical X-ray luminosities of LX≥ 5 × 1044 erg s−1 in the 0.1–2.4 keV band (Ebeling et al. 2007). MACS thus probes the high end (M200≥ 1015h−1 M⊙) of the cluster mass function. The XBACs sample (Ebeling et al. 1996) that was analysed by H05 spans a redshift range of 0.17 < z < 0.26. The 0.1–2.4 keV flux limit of fX≥ 5.0 × 10⁻¹² erg cm−2 s−1 applied to this redshift range implies X-ray luminosities of LX≥ 4.1 × 1044 erg s−1, i.e. similar to the MACS clusters at their higher redshifts. In terms of survey volumes, MACS and XBACS probe volumes that are 220 and 11 times larger, respectively, than the Millennium simulation.
5.1 Comparison of Millennium and MACS clusters
5.1.1 The z=0.4 subsample
In H10, we analysed subsamples of MACS clusters at 0.3 < z < 0.5 and 0.5 < z < 0.7. We found the observed lensing efficiency of arcs with l/w≥ 10, at 0.3 < z < 0.5, to be 0.74+0.23− 0.18. For comparison, we examine the efficiencies of the four Millennium clusters that have masses of M200 > 1015h−1 M⊙, similar to the MACS cluster masses. The mean lensing efficiency for these Millennium clusters is 0.85+0.14− 0.12 arcs per cluster. Similarly, for l/w≥ 8, we observed 1.13+0.27− 0.22 arcs per MACS cluster (H10), compared to 1.17+0.10− 0.09 arcs per Millennium cluster of this mass. Thus, the mean lensing efficiency from our simulations is in excellent agreement with the MACS cluster lensing efficiency observed at these redshifts.
Furthermore, a comparison of the observed and the predicted distributions of arc numbers in clusters (Fig. 4, middle panel) reveals that the two distributions are remarkably similar. A KS test on the simulated and observed distributions shows that the two are consistent with the null hypothesis of being drawn from the same parent distribution, with a high probability of P = 0.92. The same null hypothesis, based on a comparison of the distributions of arc separations from cluster centres (Fig. 5), also has a high probability, P = 0.22. In terms of precision, the results for the z≈ 0.4 subsamples are the best, compared to the z≈ 0.2 and 0.6 results (to be discussed below), since the errors on both the observed and the predicted efficiencies are relatively small and comparable. We believe this is the strongest statistical evidence to date that the lensing efficiencies of observed galaxy clusters are in excellent agreement with numerical predictions based on ΛCDM cosmology.
5.1.2 The z=0.6 subsample
At z = 0.6, when considering the full simulated subsample, with masses M200≥ 7 × 10¹⁴h−1 M⊙, it appears that the simulated arc production efficiency, 0.42+0.10− 0.08l/w > 8 arcs per Millennium cluster, is lower by a factor of 3 than observed in the 0.5 < z < 0.7 MACS sample of H10, 1.33+0.42− 0.33. As seen in Fig. 4, the fraction of artificial clusters that do not produce arcs is also higher by a factor of 3 than the observed fraction. The null hypothesis that the arc number distributions are derived from the same parent distribution has a probability of only P = 0.01. On the other hand, the simulated and observed distributions of arc separations from cluster centres at z = 0.6 are consistent (P = 0.24 for the null hypothesis).
However, as was the case for the z = 0.4 sample, the full simulated sample is somewhat undermassive, compared to the real MACS clusters. Among the four Millennium clusters at z = 0.6, two clusters (each with its three projections and five source realizations) are responsible for the formation of 16 arcs out of the total 18 arcs with l/w≥ 10 formed by all four clusters. The efficiency of only these two clusters is thus 0.53+0.17− 0.13 arcs per cluster, only a factor of 2 lower than the observed efficiency of 1.08+0.39− 0.23 arcs per cluster. Furthermore, as shown in Fig. 8, one of the four clusters is in the process of formation and is still composed of several separate clumps. Only this one cluster, whose 15 projections×realizations have an efficiency of 0.53+0.26− 0.18 arcs per cluster, has a mass above M200≥ 1015h−1 M⊙, and its mass is only at the low-mass end of the range in the observed z∼ 0.6 MACS sample. Clearly, we have too few clusters at z = 0.6 with masses that are similar to the MACS clusters for a proper comparison. The question can be explored by N-body simulations with bigger box sizes that allow the formation of a larger number of massive clusters at z = 0.6.
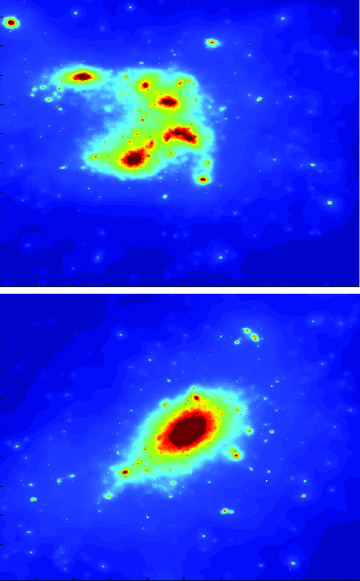
A surface mass density map (in arbitrary units) of two of the four most massive clusters at z = 0.6. As seen in the figure, one of the clusters (top panel) is composed of several separate clumps and is still in the process of formation, compared to the other cluster (bottom panel) that is more relaxed.
5.2 Comparison of Millennium and XBACs z = 0.2 clusters
In H05, we measured an observed efficiency of 1.2+0.46− 0.34 arcs (l/w≥ 10) in a sample of 10 XBACs clusters at z = 0.2 (see also H10). The Smith et al. (2005) sample of clusters, analysed by H05, spans a similar range of masses to those of our full z = 0.2 Millennium sample, M200≈ (7–20) × 1014h−1 M⊙. The predicted lensing efficiency of the 14 Millennium clusters that are in our sample at that redshift is 0.40+0.05− 0.04, again lower by a factor of 3 than the H05 observed result, a difference that is significant at the 2.4σ level. In terms of the distributions, however, the null hypothesis that the simulated and observed distributions are drawn from the same parent distribution has high-to-moderate KS probabilities: P = 0.33 for the cluster arc number distributions, and P = 0.06 for the distributions of arc separation from cluster centres. Nevertheless, the 2.4σ difference between the integrated efficiencies again raises the B98 question of whether the lensing properties of artificial clusters, formed in a ΛCDM simulation at z≈ 0.2, are lower than their observed counterparts.
We turn our attention again to the four most massive clusters in the Millennium simulations. These are the same four clusters that already comprise our cluster sample at z = 0.6, with masses around 1015h−1 M⊙. At z = 0.4, the lensing efficiency of these four clusters peaks at 0.85+0.14− 0.12 arcs per cluster (for arcs with l/w≥ 10) and they are still efficient at z = 0.2, with an efficiency of 0.68+0.12− 0.11 arcs per cluster. Therefore, if we choose to focus our comparison on only the four most massive clusters, we find a factor of 2 enhancement in the lensing efficiency of the observed clusters, compared to the simulated clusters, but within the uncertainties the two are formally consistent at the 1.5σ level. We also note that in our simulation there are only seven clusters above our mass threshold of M200≥ 7 × 10¹⁴h−1 M⊙ at z = 0.4, and that their number doubles by z = 0.2. Tracing back the mass evolution of these 14 clusters from z = 0 to 0.6, we find that only eight of them gained more than 50 per cent of their final mass above z = 0.6. The average lensing efficiency of these latter clusters is 0.53+0.07− 0.07 which is 2.3 times higher than the efficiency of the remaining six clusters which formed later on. In Section 6, below, we discuss some possible reasons behind the apparent discrepancy between the simulations and observations at z = 0.2.
6 DISCUSSION AND SUMMARY
We have presented a new set of realistic cluster lensing simulations, and compared them to the observational arc statistics results of H10. In our simulations, we have lensed the UDF through artificial massive clusters from the Millennium N-body simulation. We have found that, at z = 0.4, the most massive clusters, with M200≥ 1015h−1 M⊙, are efficient lenses, producing an average of 0.85+0.14− 0.12 giant arcs with l/w≥ 10 per cluster. The results of our simulations are in excellent agreement with the observed efficiency of MACS clusters at 0.3 < z < 0.5, presented in H10. At a higher redshift of z = 0.6, we find that there are not enough massive clusters in the simulations in order to perform as strong a statistical comparison with the observations. Nevertheless, we do find two clusters that are already very efficient lenses at that redshift.
We have further compared our new calculations of the lensing efficiency at z = 0.2 with the observational results of H05. At this redshift, the lensing efficiency of our simulated cluster sample, 0.40+0.05− 0.04 for arcs with l/w≥ 10, is low by a factor of 3, compared to the observed efficiencies of H05. Thus, at cluster redshifts of z = 0.2, the same redshift regime first investigated by B98, the discrepancy persists between the lensing efficiencies of real and simulated clusters, albeit at a lower level than found by B98.
Given the agreement between the observed and the simulated samples at z = 0.4, an obvious candidate for explaining the discrepancy at z = 0.2 is sample selection bias. The 0.3 < z < 0.5 sample of MACS clusters analysed in H10 is an unbiased selection from a complete, X-ray-luminosity-selected, sample by Ebeling et al. (2007). Targets were chosen by HST schedulers from the complete sample based only on scheduling convenience. The situation is less clear for the z = 0.2 sample of Smith et al. (2005), analysed by H05. Smith et al. (2005) had proposed to observe with HST (Program 8249, PI J.-P. Kneib) 16 clusters from a complete, luminosity-limited sample of 19 X-ray selected clusters, where the remaining three clusters already had suitable data in the HST archive. In practice, however, time was granted to observe only eight of 16 clusters requested. These eight clusters, together with A2218 and A2219 that already had archival data, constitute the Smith et al. (2005) sample of 10 XBACS clusters. In choosing the eight clusters to be observed, the main criterion was distribution in RA to facilitate ground-based follow-up, but there were also at least one or two clusters that were excluded because they were thought to be unpromising lenses (J.-P. Kneib, private communication). Thus, there was likely some degree of pre-selection favouring efficient lenses.
An additional possibility is that the observed H05 sample tends to be more massive than the simulated Millennium z = 0.2 sample. From Fig. 1, we can see that, among the 14 Millennium clusters at z = 0.2, eight (57 per cent) are in the mass range M200 = (7–9) × 1014h−1 M⊙, five (36 per cent) are in the range M200 = (9–12) × 1014h−1 M⊙, and one (7 per cent) with M200 > 13 × 1015h−1 M⊙. By comparison, from table 1 in H05 we can see that the corresponding fractions in the observed Smith et al. (2005) sample are 40, 40 and 20 per cent, respectively. Although the masses listed in H05 are estimates based on the LX–M200 relation, which has considerable scatter, this comparison suggests that the observed sample may be more heavily weighted towards massive clusters than the simulated sample. This, in turn, could again contribute to the discrepancy between the lensing efficiencies.
Alternatively or in parallel to these observational biases, some physical effect, not currently included in our simulations, may set in at low redshifts, and make the real clusters more efficient at arc production than the simulated clusters. For example, Puchwein et al. (2005), Wambsganss, Ostriker & Bode (2008), Rozo et al. (2008) and Mead et al. (2010) found that the inclusion of ICM gas in cosmological simulations, which of course is not included in the Millennium simulation, can, under some conditions, increase the lensing efficiency by up to a factor of a few. This increase in lensing efficiency is due to the steepening of the dark matter profile via adiabatic contraction (Gnedin et al. 2004). If this effect becomes important only at low redshifts, it is of the right magnitude to explain our results. The cluster-formation physics behind X-ray selection is another possibility. Torri et al. (2004) have found that during a merger the strong-lensing cross-section can be enhanced by up to an order of magnitude. This is supported by Meneghetti et al. (2010), who find that SPH-simulation clusters that are strong lenses tend to have higher X-ray luminosities than other clusters with the same mass. If the halo merger rate increases at low redshifts, the low-z sample could be affected in this way. Indeed, as shown in Section 4, when we limited our analysis to clusters that gained most of their mass early, at z≥ 0.6, the lensing efficiency increased. This suggests that there is some connection between the time a cluster forms and its lensing efficiency. This connection is not unexpected since lensing efficiency depends also on the cluster concentration which is correlated with the cluster formation time (e.g. Wechsler et al. 2002).
In light of these results, we can now say that, in arc-lensing statistics, there is at least one redshift range, z≈ 0.4, for which there is a large and unbiased observed sample of clusters, there is a large artificial cluster sample with realistic lensing simulations, and the lensing statistics of the two samples agree impressively. At z≈ 0.2, there may be problems at the factor 3 level, but there is unlikely to be an ‘order of magnitude problem’, of the type raised by B98. At least some, if not all, of this remaining discrepancy, is probably due to some combination of observed sample pre-selection, cluster mass mismatch between observations and theory, and physical effects that are not included in the simulations, such as the influence of ICM gas (Puchwein et al. 2005; Rozo et al. 2008).
The surface number density of lensed arcs over the whole sky depends on the product of the cluster mass distribution and the lensing efficiency as a function of cluster mass and redshift. Our study shows that the lensing efficiency is probably quite close to the predictions of the ΛCDM paradigm. It remains to be seen if so is the mass function. The cluster mass function has long been considered a litmus test for cosmological models (e.g. Mortonson et al. 2011), and is therefore at the focus of observational efforts using X-ray selection, the red-sequence method and the Sunyaev–Zeĺdovich effect. Our results concerning the lensing efficiencies of known clusters indicate that future ‘blind’ large-area lensed arc surveys could provide another independent avenue for measuring the cluster mass function. For example, Limousin et al. (2009) have carried out such a blind search for arcs in 120 out of the 170 deg2 of the Canada–France–Hawaii Telescope Legacy Survey’s Wide Survey and found 13 galaxy-group scale lenses. The larger volume needed to discover massive clusters via their strong lensing will be provided by the future Large Synoptic Survey Telescope. Such cluster samples can provide an independent probe of the cluster mass function, with its great diagnostic power for cosmological models.
We thank V. Springel for his help in accessing the Millennium data and J. -P. Kneib for discussions. We thank the anonymous referee for constructive comments. AH acknowledges support by the Dan David Foundation. SH acknowledges support by the Deutsche Forschungsgemeinschaft within the Priority Programme 1177 under the project SCHN 342/6 and by the German Federal Ministry of Education and Research (BMBF) through the TR 33, ‘The Dark Universe’. MB also acknowledges support by the BMBF, TR 33.
REFERENCES


