


Abstract
We present the results from 10 nights of observations of the globular cluster NGC 6981 (M72) in the V, R and I Johnson wavebands. We employed the technique of difference image analysis to perform precision differential photometry on the time-series images, which enabled us to carry out a census of the understudied variable star population of the cluster. We show that 20 suspected variables in the literature are actually non-variable, and we confirm the variable nature of another 29 variables while refining their ephemerides. We also detect 11 new RR Lyrae variables and three new SX Phe variables, bringing the total confirmed variable star count in NGC 6981 to 43. We performed Fourier decomposition of the light curves for a subset of RR Lyrae stars and used the Fourier parameters to estimate the fundamental physical parameters of the stars using relations available in the literature. Mean values of these physical parameters have allowed us to estimate the physical parameters of the parent cluster. We derive a metallicity of [Fe/H]ZW≈−1.48 ± 0.03 on the Zinn & West scale (or [Fe/H]UVES≈−1.38 ± 0.03 on the new Carretta et al. scale) for NGC 6981, and distances of ∼16.73 ± 0.36 and ∼16.68 ± 0.36 kpc from analysis of the RR0 and RR1 stars separately. We also confirm the Oosterhoff type I classification for the cluster, and show that our colour–magnitude data are consistent with the age of ∼12.75 ± 0.75 Gyr derived by Dotter et al.
1 INTRODUCTION
The study of Galactic globular clusters is important for many reasons. These stellar systems represent some of the oldest, and consequently metal poor, stellar populations in the Galaxy, and their scrutiny allows us to glean information regarding the formation and early evolution of the Galaxy. The spatial distribution of the clusters reveals a different aspect of the Galactic structure than other stars in the Galaxy, and their orbits and tidal tails provide constraints on the Galactic potential. Of course, what we learn about globular clusters in our own Galaxy is also applicable to other galaxies as well.
Globular clusters are also believed to be a close approximation to a stellar laboratory since a cluster’s members were formed at the same time from the same primordial material with the same composition, leading to a homogeneity of certain properties within each cluster, but with differences in these properties between clusters. Although this paradigm is being challenged by the recent discovery in some globular clusters of multimodal main sequences and subgiant branches (Piotto 2009, and references therein), indicating the existence of multiple stellar populations, most globular clusters do not exhibit such obvious deviations from a simple stellar population and the paradigm still holds.
There are ∼150 globular clusters in our Galaxy for which their fundamental properties, such as metallicity, distance, age and kinematics, have been estimated by various methods (Harris 1993). One independent method for estimating at least some of these quantities is by studying the population of RR Lyrae variable stars present in most clusters. This method uses the fact that the light-curve morphology of RR Lyrae stars is connected with their fundamental stellar parameters, and consequently quantities such as metallicity, absolute magnitude and effective temperature may be calculated from the fit parameters of the Fourier decomposition of their light curves using empirical, semi-empirical or theoretical relations published in recent years (Simon & Clement 1993; Jurcsik & Kovács 1996; Jurcsik 1998; Kovács 1998; Kovács & Walker 2001; Morgan, Wahl & Wieckhorst 2007). Appropriate mean values of these fundamental parameters then enable similar estimates of the physical parameters of the parent cluster.
As part of a series of papers on detecting and characterizing the variable stars in globular clusters, and using the results to estimate the parameters of the host cluster (Arellano Ferro et al. 2004; Lázaro et al. 2006; Arellano Ferro et al. 2008a,b; Arellano Ferro, Giridhar & Bramich 2010), we have performed CCD time-series photometry of the globular cluster NGC 6981 (RA α = 20h53m27.9s, Dec. δ=−12°32′13″, J2000;  ,
,  ) using the method of difference image analysis (DIA) (Section 2). The known variables in this cluster, which are exclusively RR Lyrae variables, have been studied in a handful of photographic observing campaigns (Shapley & Ritchie 1920; Rosino 1953; Sawyer 1953; Nobili 1957; Dickens & Flinn 1972), the most recent of which is now 40 yr in the past. Periods and ephemerides are poorly determined or non-existent for a substantial number of variables, and light curves for many of the claimed ‘variables’ have not been published. Therefore, in Section 3, we use our precision differential photometry to perform an essential variable star census for the cluster.
In Section 4, we use the Fourier decomposition of the RR Lyrae star light curves to estimate their fundamental physical parameters, and then in Section 5, we use the RR Lyrae properties to estimate the metallicity of, and distance to, NGC 6981. We also discuss the age estimates for the cluster that are available in the literature in the context of our colour–magnitude diagram (CMD). Our conclusions are presented in Section 6.
Throughout this paper we adopt the RR Lyrae nomenclature introduced by Alcock et al. (2000); namely, RR0 designates an RR Lyrae star pulsating in the fundamental mode, and RR1 designates an RR Lyrae star pulsating in the first-overtone mode.
2 OBSERVATIONS AND REDUCTIONS
2.1 Observations
We employed the 2.0-m telescope of the Indian Astronomical Observatory (IAO), Hanle, India, located at 4500 m above sea level, to obtain time-series imaging of the globular cluster NGC 6981. The image data were obtained during several runs between 2004 October and 2009 September, where we collected a total of 103, 110 and three images through Johnson V, R, I filters, respectively (see Table 1 for a detailed log of the observations). The CCD camera that was used is equipped with a Thompson CCD of 2048×2048 pixels with a pixel scale of 0.296 arcsec pixel−1 and a field of view of ∼10.1 × 10.1 arcmin2.
The distribution of observations of NGC 6981 for each filter, where the columns NV, NR and NI represent the number of images taken for the filters V, R and I, respectively. We also provide the exposure time, or range of exposure times, employed during each night for each filter in the columns tV, tR and tI.
| Date | NV | tV (s) | NR | tR (s) | NI | tI (s) |
| 20041004 | 20 | 60–180 | 19 | 100–150 | 0 | – |
| 20041005 | 29 | 90 | 29 | 70 | 0 | – |
| 20050514 | 12 | 150 | 15 | 120 | 0 | – |
| 20050515 | 13 | 150 | 15 | 120 | 0 | – |
| 20050516 | 5 | 100–150 | 6 | 80-120 | 0 | – |
| 20070522 | 4 | 200–300 | 5 | 200–240 | 0 | – |
| 20070804 | 5 | 240 | 8 | 180 | 0 | – |
| 20070905 | 11 | 150 | 11 | 120 | 0 | – |
| 20090913 | 4 | 150 | 1 | 120 | 3 | 100 |
| 20090914 | 0 | – | 1 | 120 | 0 | – |
| Total: | 103 | 110 | 3 |
2.2 Difference image analysis
As in previous papers (Arellano Ferro et al. 2004; Lázaro et al. 2006; Arellano Ferro et al. 2008a,b; Arellano Ferro, Giridhar & Bramich 2010), we have employed the technique of DIA to extract high-precision photometry for all point sources in the images of NGC 6981, including those in the highly crowded central region (Alard & Lupton 1998; Alard 2000; Bramich et al. 2005). We used a pre-release version of the DanDIA1 pipeline for the data reduction process (Bramich et al., in preparation) which includes a new algorithm that models the convolution kernel matching the point spread function (PSF) of a pair of images of the same field as a discrete pixel array (Bramich 2008).
In brief, the DanDIA pipeline was used to perform the following processing steps on the raw image data. Bias level and flat-field corrections were applied to the raw images to create calibrated images, which were then cleaned of cosmic rays using the cosmic ray cleaning algorithm of van Dokkum (2001). A reference image for each filter was constructed by registering and stacking a set of the best-seeing calibrated images such that all images used were taken on a single night. This resulted in 7, 7 and 2 images being stacked with total exposure times of 630, 490 and 200 s for the filters V, R and I, respectively. The full width half-maximum (FWHM) of the PSF in the V, R and I filter reference images was measured to be ∼3.8, ∼3.6 and ∼4.7 pixel, respectively.
In each reference image, we measured the fluxes (referred to as reference fluxes) and positions of all PSF-like objects (stars) by extracting a spatially variable (with polynomial degree 3) empirical PSF from the image and fitting this PSF to each detected object. Deblending of very close objects was attempted. Using the Delaunay triangulation and triangle matching method of Pál & Bakos (2006), the detected stars in each image in the time-series sequence were matched with those detected in the corresponding reference image, and a linear transformation was derived which was used to register each image with the reference image using cubic O-MOMS resampling (Blu, Thévenaz & Unser 2001).
For each filter, a sequence of difference images was created by subtracting the relevant reference image, convolved with an appropriate spatially variable kernel, from each registered image. The spatially variable convolution kernel for each registered image was determined using bilinear interpolation of a set of kernels, modelled as pixel arrays, that were derived for a uniform 6 × 6 grid of subregions across the image.
2.3 Caveats of difference imaging analysis
The value of the reference flux fref for each star is measured on the reference image, and where the star field is very crowded, the measured fref values are likely to be systematically too large due to flux contamination from blending and unmodelled faint background stars (Todd et al. 2005, 2006). On the other hand, the measurement of the difference fluxes fdiff(t) does not suffer from this problem because the majority of sources are fully subtracted in the difference images, including the blended stars and faint background stars. For a variable object, a value for fref that is systematically too large will result in a light curve with an amplitude in magnitudes that is systematically too small, and vice versa (equations 2 and 3), although the ‘shape’ of the light curve will be unaffected. Consequently, we have made a note in column 4 of Table 2 (see later) of those variable stars likely to be affected by flux contamination, or that are affected by a blended PSF.
Details of all confirmed variables in NGC 6981. The variable star ‘V’ identification numbers are listed in the first column, and the previous star identification numbers [for the Kadla et al. (1995) candidate variables] are listed in the second column. The third column indicates the variable star type. A guide to the level of blending of the variable star PSF in the reference images is provided in column 4, where ‘Inner’ and ‘Outer’ indicate that the variable is inside or outside, respectively, of the highly crowded central area of the cluster (the dividing line is placed at r = 50 arcsec), and where ‘Blend’ indicates that the variable is blended with a star of similar or greater brightness. In column 5, we list the number Nmax and Nmin of light-curve maxima and minima, respectively, that were observed in full during our observation runs. Note that the epoch of maximum light Tmax in column 6 is a heliocentric Julian date (HJD). To enable easy referencing, the period for each variable as found by previous authors is supplied in columns 8–11, and may be compared to our derived periods in column 7. Note that most of the period estimates from previous authors fail to phase our light curves properly, which highlights the importance of the longer temporal baseline and much better photometric precision of our data.
| Variable Star ID | Candidate Variable Star ID | Variable Type | Blend Guide | No. of observed maxima and minima (Nmax, Nmin) | Tmax (d) | P (d) | Period from SH1920 (d) | Period from Rosino (1953) (d) | Period from Nobili (1957) (d) | Period from Dickens & Flinn (1972) (d) |
| V1 | – | RR0 | Outer | (2,0) | 245 3505.396 | 0.619782 | 0.61974h | 0.619818h | – | – |
| V2 | – | RR0 | Outer | (0,1) | 245 4317.174d | 0.465254 | 0.46561h | 0.4652687h | – | 0.46526213h |
| V3 | – | RR0 | Outer | (1,3) | 245 4317.333 | 0.497614 | 0.48965h | 0.4976104 | – | 0.4976052 |
| V4 | – | RR0 | Outer | (1,1) | 245 4349.158 | 0.552486 | 0.3619h | 0.5524877 | – | 0.5524863 |
| V5 | – | RR0 | Inner | (2,3) | 245 3505.421 | 0.507264 | 0.4991h | – | – | – |
| V7 | – | RR0 | Inner | (1,2) | 245 3283.202 | 0.524686 | 0.52463h | – | 0.524648h | 0.524630h |
| V8 | – | RR0 | Outer | (1,1) | 245 3284.107 | 0.568380 | 0.5743h | 0.568392h | – | 0.5683752h |
| V9 | – | RR0 | Inner | (2,0) | 245 3505.421 | 0.602928 | 0.5902h | – | – | 0.60296h |
| V10 | – | RR0 | Outer | (0,1) | 245 4243.386d | 0.558186 | 0.5483h | 0.5581805 | – | 0.5581814 |
| V11 | – | RR0 | Outer | (0,2) | 245 4317.325d | 0.520676 | 0.3345h | 0.521466h | – | 0.51997h |
| V12 | – | RR1 | Inner | (2,1) | 245 3506.374 | 0.287858 | 0.4111h | – | – | – |
| V13 | – | RR0 | Inner | (2,2) | 245 3283.190 | 0.542035 | 0.54182h | – | – | 0.55114h |
| V14 | – | RR0 | Inner | (0,1) | 245 3507.413d | 0.607194 | 0.5904h | – | – | – |
| V15 | – | RR0 | Outer | (0,0) | 245 4243.370d | 0.540460 | 0.5499h | 0.5403524h | – | 0.55044h |
| V16 | – | RR0 | Inner | (1,2) | 245 4349.176 | 0.575211 | 0.5641h | – | – | 0.585497h |
| V17 | – | RR0 | Inner | (1,1) | 245 3283.140 | 0.573540 | 0.56308h | 0.573539 | – | 0.5735404 |
| V18 | – | RR0 | Blend | (0,0) | 245 4317.201d | 0.535578 | 0.52016h | – | – | – |
| V20 | – | RR0 | Inner | (0,1) | 245 3506.453d | 0.595048 | 0.59555h | 0.595046 | – | – |
| V21 | – | RR0 | Outer | (1,0) | 245 3506.410 | 0.531162 | 0.5310h | 0.5311618 | – | 0.5311636 |
| V23 | – | RR0 | Outer | (0,0) | 245 4317.325d | 0.585127 | 0.5969h | 0.5850834h | – | 0.585083h |
| V24 | – | RR1 | Blend | (2,2) | 245 3505.448 | 0.327129 | 0.4973h | – | – | – |
| V25 | – | RR1 | Outer | (0,3) | 245 5088.167d | 0.353340 | – | 0.3533494h | – | 0.3533739h |
| V27 | – | RR0 | Outer | – | – | – | 0.65885 | 0.6739040 | – | 0.673774 |
| V28 | – | RR0 | Outer | (1,0) | 245 4243.270 | 0.567216 | 0.36381h | 0.5672533h | – | 0.56724873h |
| V29 | – | RR0 | Outer | (0,0) | 245 3507.446d | 0.597472e | 0.36865h | – | 0.373614h | 0.605497h |
| V31 | – | RR0 | Inner | (1,1) | 245 3283.181 | 0.542326 | 0.55465h | – | – | 0.53249h |
| V32 | – | RR0 | Outer | (0,0) | 245 4317.333d | 0.528299 | 0.50544h | 0.5282821h | – | 0.52834h |
| V35 | – | RR0 | Outer | – | – | – | – | – | 0.54374 | 0.543771 |
| V36 | – | RR0 | Blend | (0,1) | 245 4243.450d | 0.582613 | – | – | – | – |
| V43 | S3 | RR1 | Inner | (2,1) | 245 3283.195 | 0.283493 | – | – | – | – |
| V44 | S5 | RR0a | Inner | (0,0) | – | – | – | – | – | – |
| V45 | S7 | RR0a | Blend | (0,0) | – | – | – | – | – | – |
| V46 | S8 | RR1 | Inner | (2,1) | 245 3284.190 | 0.286685 | – | – | – | – |
| V47 | S9 | RR0 | Inner | (1,0) | 245 3284.221 | 0.649084 | – | – | – | – |
| V48 | R3 | RR0 | Inner | (1,0) | 245 3284.066 | 0.639764 | – | – | – | – |
| V49 | R4 | RR0 | Inner | (0,1) | 245 4243.387d | 0.578270 | – | – | – | – |
| V50 | – | RR0 | Inner | (1,2) | 245 3284.244 | 0.488880 | – | – | – | – |
| V51 | – | RR0b | Blend | (0,0) | 245 4243.450d | 0.357335f | – | – | – | – |
| V52 | – | RR0/RR1c | Blend | (1,0) | 245 3284.137 | – | – | – | – | – |
| V53 | – | RR0/RR1c | Inner | (1,0) | 245 3284.215 | – | – | – | – | – |
| V54 | – | SX Phe | Inner | (6,4) | 245 3283.162 | 0.0719862g | – | – | – | – |
| V55 | – | SX Phe | Outer | (11,11) | 245 3283.132 | 0.0470327g | – | – | – | – |
| V56 | – | SX Phe | Inner | (9,9) | 245 3283.158 | 0.0404696g | – | – | – | – |
a These variables are RR Lyrae stars, and we believe that they are of the RR0 type, but we cannot confirm this (see Section 3.6); bthe classification for this variable is most likely RR0 (see Section 3.5); cthese variables are RR Lyrae stars, but we have been unable to distinguish their subtype (see Section 3.6); dthe epoch of maximum light is uncertain because we have not observed the light-curve peak. The epoch reported here is that of the data point closest to the suspected peak; ethe period listed for V29 is the period P0 in equation (5). We detect a secular period change for this star of β≈−1.38 × 10⁻⁸ d d−1 (see Section 3.5); fdue to the poor phase coverage of our observations for this variable, we have been unable to determine a reliable period (see Section 3.5); gthe periods listed for the SX Phe variables are the periods associated with the largest amplitude oscillation; hour photometric data are not well phased by these periods.
Furthermore, it is worth mentioning a feature of the difference image construction with DanDIA which can impede photometry on some objects. Saturated pixels in the reference image are flagged as bad pixels, and when the reference image is convolved with a kernel in order to match the PSF of the current registered image, the bad pixels in the reference image are grown by the footprint of the convolution kernel. For our data, we modelled the kernel as a circular pixel array of radius equal to twice the PSF FWHM in the current registered image. Hence a saturated star in the reference image discounts an area in the difference images that encompasses the saturated star and its immediate neighbourhood, with poorer seeing resulting in a larger discounted area. Consequently stars in the neighbourhood of saturated stars may suffer from imprecise photometry (because fewer good pixels are available in the difference images for photometric measurements), missing photometric measurements for a subset of epochs (when the seeing is too poor), or simply it may have been impossible to extract any photometric measurements at all for the star in question.
We made our choice of images to be combined into the stacked reference images so as to minimize the number of saturated stars. However, our reference images still contain a handful of saturated stars towards the centre of the cluster, which has affected the photometry of some of the variable stars. We will refer to this point a number of times later in this paper.
2.4 Photometric calibrations
We derived photometric calibration relations for the conversion of instrumental v and i magnitudes to the Johnson–Kron–Cousins photometric system (Landolt 1992) by analysing the standard V and I magnitudes of a set of standard stars in the observed field of the cluster which were kindly made available to us by P. Stetson (private communication). We identified 26 and 28 standard stars in the V and I reference images, respectively, and fitted a linear relation between standard and mean instrumental magnitudes for each filter (see Fig. 1). No colour term was found to be significant, and the linear correlation coefficients are >0.999. These relations were then used to convert the instrumental v and i photometric measurements for all detected point sources to the standard Johnson–Kron–Cousins photometric system.
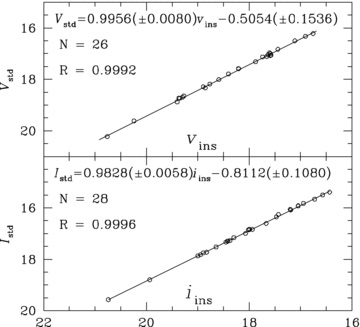
Plot of standard magnitude in the Johnson system against mean instrumental magnitude for the set of standard stars supplied by P. Stetson that lie in our field of observation (open circles). The top and bottom panels correspond to the V and I filters, respectively. The solid line in each panel shows the fitted relation between the standard and mean instrumental magnitudes.
In Fig. 2(a), we plot the rms magnitude deviation for each of the 8199 calibrated V light curves versus the mean magnitude. We achieve better than 20 mmag scatter for stars in the magnitude range from 14 to ∼18.5 mag, and ∼6–10 mmag photometry at the bright end.
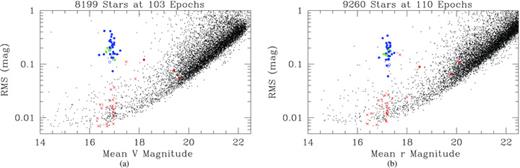
(a) Plot of rms magnitude deviation versus mean magnitude for each of the 8199 calibrated V light curves. (b) Plot of rms magnitude deviation versus mean magnitude for each of the 9260 instrumental r light curves. Both plots: RR Lyrae variables of the RR0 and RR1 types are plotted as solid and open blue circles, respectively. Variables of the SX Phe type are plotted as solid red circles, and suspected RR Lyrae variables are plotted as solid green circles. Previously suspected variables in the literature that do not show any variability in our data are marked as red crosses. A few of these previously suspected variables exhibit a relatively large rms magnitude deviation which is due to outlier photometric measurements in the light curve rather than bona fide variability.
The instrumental r magnitudes were retained in the instrumental system since no standards with R magnitude measurements were found in the literature. In Fig. 2(b) we plot the rms magnitude deviation for each of the 9260 instrumental r light curves versus the mean magnitude. In this filter we achieve ∼8–12 mmag photometry at the bright end.
2.5 Astrometry
A linear astrometric solution was derived for the V-filter reference image by matching ∼1000 hand-picked stars with the USNO-B1.0 star catalogue (Monet et al. 2003) using a field overlay in the image display tool gaia (Draper 2000). We achieved a radial rms scatter in the residuals of ∼0.3 arcsec. The astrometric fit was then used to calculate the J2000.0 celestial coordinates for all the confirmed variables in our field of view (see Table 3). The coordinates correspond to the epoch of the V reference image, which is the heliocentric Julian date ∼245 3284.11 d.
Celestial coordinates for all the confirmed variables in our field of view, except V27 and V35 which lie outside of our field of view. The coordinates correspond to the epoch of the V reference image, which is the heliocentric Julian date ∼245 3284.11 d.
| Variable Star ID | RA (J2000.0) | Dec. (J2000.0) | Variable Star ID | RA (J2000.0) | Dec. (J2000.0) | Variable Star ID | RA (J2000.0) | Dec. (J2000.0) |
| V1 | 20 53 31.12 | −12 33 11.9 | V16 | 20 53 27.86 | −12 32 36.9 | V44 | 20 53 28.02 | −12 32 29.7 |
| V2 | 20 53 34.56 | −12 29 02.3 | V17 | 20 53 28.23 | −12 33 00.0 | V45 | 20 53 28.66 | −12 32 20.2 |
| V3 | 20 53 24.57 | −12 33 17.3 | V18 | 20 53 26.21 | −12 32 54.6 | V46 | 20 53 28.97 | −12 32 26.5 |
| V4 | 20 53 20.79 | −12 31 42.6 | V20 | 20 53 24.21 | −12 32 04.0 | V47 | 20 53 29.73 | −12 32 26.3 |
| V5 | 20 53 25.58 | −12 32 41.7 | V21 | 20 53 22.38 | −12 32 05.8 | V48 | 20 53 26.46 | −12 32 27.3 |
| V7 | 20 53 27.77 | −12 31 21.1 | V23 | 20 53 21.13 | −12 30 21.9 | V49 | 20 53 28.27 | −12 32 10.9 |
| V8 | 20 53 27.57 | −12 30 47.9 | V24 | 20 53 27.18 | −12 32 42.2 | V50 | 20 53 28.25 | −12 31 58.3 |
| V9 | 20 53 28.66 | −12 31 28.0 | V25 | 20 53 18.88 | −12 31 13.7 | V51 | 20 53 28.41 | −12 32 32.3 |
| V10 | 20 53 24.85 | −12 33 31.1 | V28 | 20 53 32.26 | −12 30 55.9 | V52 | 20 53 27.96 | −12 32 02.3 |
| V11 | 20 53 32.05 | −12 32 51.5 | V29 | 20 53 25.77 | −12 33 11.5 | V53 | 20 53 27.00 | −12 32 16.7 |
| V12 | 20 53 28.60 | −12 32 38.7 | V31 | 20 53 28.20 | −12 31 42.9 | V54 | 20 53 28.66 | −12 32 02.5 |
| V13 | 20 53 28.91 | −12 32 02.2 | V32 | 20 53 18.82 | −12 33 01.5 | V55 | 20 53 24.45 | −12 31 27.3 |
| V14 | 20 53 27.17 | −12 31 42.8 | V36 | 20 53 26.92 | −12 32 18.0 | V56 | 20 53 28.93 | −12 33 05.9 |
| V15 | 20 53 23.76 | −12 32 38.8 | V43 | 20 53 27.36 | −12 32 22.4 |
3 VARIABLE STARS IN NGC 6981
The first claimed detection of two variable stars in NGC 6981 was made by Davis (1917). However, the first proper study of the variable stars in NGC 6981 was undertaken by Shapley & Ritchie (1920, hereafter SH1920) where 18 photographic plates taken over 2 yr from the 60-inch reflector at the Mount Wilson Observatory were analysed. Stars V1–V34 were listed as ‘probably variable’ by Miss Ritchie and photometric measurements were extracted relative to a set of 29 comparison stars of ‘sensibly constant light’. However, it was noted that stars V6, V19, V22, V26 and V33 ‘do not appear to be conspicuously variable’, and that V25, V30 and V34 ‘undoubtedly vary, but it has not been possible to obtain uniform periods for them’. Hence SH1920 actually claim detection of 29 variables, and provide periods for 26 of them.
Rosino (1953) studied 22 of the claimed variables from the work of SH1920 and estimated new periods for 16 of them. Around the same time, Sawyer (1953) claimed the detection of seven more variables (stars V35–V41) from a collection of 61 photographic plates, although no light curves were published and no periods were estimated. Nobili (1957) further studied the stars V7, V29 and V35, presenting light curves and new periods.
Later on, Dickens & Flinn (1972) analysed B and V filter observational data for 21 RR Lyrae stars with clear variations, using ∼20 photographic plates for each filter taken on 13 nights spread over the period of ∼1 yr. They revise the periods of these stars by combination with previous data, and attempt to use the RR Lyraes to derive various cluster properties. From the same data, Dickens & Flinn (1973) claim the discovery of ‘a new red variable’, but no light curve or period was ever published. This star was subsequently labelled as V42 in the Sawyer Hogg (1973) catalogue.
In a brief paper by Kadla et al. (1995), the authors use the cluster CMD to identify 16 stars in the RR Lyrae instability strip that are not already claimed to be variable in previous publications. The stars, labelled S1–S9 and R1–R7, are put forward as ‘suspected’ and ‘possible’ variables, respectively. Although these stars are not confirmed variables, they would be good candidates to look for variability if time-series photometric data exist.
As we have mentioned in the introduction, no time-series photometry for NGC 6981 has been published for the last ∼40 yr, and none of the time-series photometry that has been published was obtained using modern CCD imaging cameras. Our time-series observations provide more data points (∼100 compared to ∼20–60) over a longer time-base (∼5 yr compared to ∼1–2 yr) than the photographic campaigns of previous authors, which give us the potential to detect variability on time-scales from hours to months. We also reach deeper by ∼4 mag, and achieve a much better photometric precision per data point (≲20 mmag down to ∼18.5 mag compared to ∼50 mmag at ∼17 mag), which is mainly the consequence of the use of a larger telescope coupled with a sensitive CCD imager. Also, the technique of difference imaging has enabled us to detect variables in the most crowded central parts of the globular cluster. Therefore, we are in a position to fully revise the list of variables in the cluster.
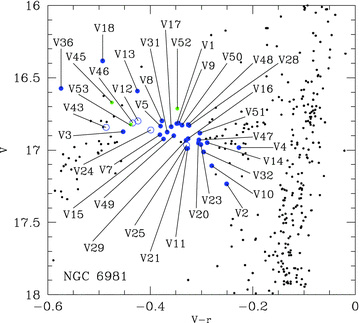
In Table 2, we present the details of all the confirmed variables in NGC 6981; namely, those variables for which we have detected brightness variations in our light curves above the noise level, or which have clearly variable light curves published in the literature. The latter of these criteria covers the cases of the two RR Lyrae variables V27 and V35 that lie outside of our field of view, and which therefore do not have a light curve in our data (see Section 3.1). We also provide a comprehensive set of celestial coordinates for all confirmed variables in our field of view in Table 3, and a set of finding charts in Fig. 3, since clear finding charts displaying all confirmed variables have not previously been published. This publication should therefore serve as the definitive reference for the known variable star population of NGC 6981, and the reader should not need to refer elsewhere in order to collate the pertinent information on these variables.
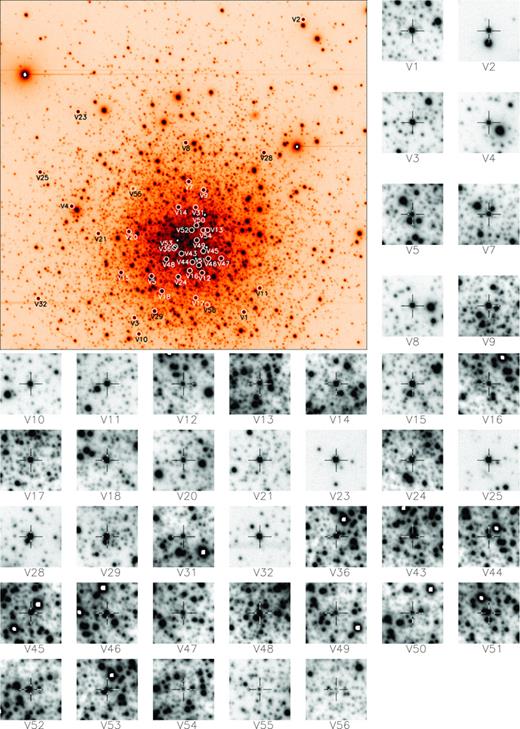
Finding charts constructed from our V reference image; north is up and east is to the right. The cluster image is 5.31×4.93 arcmin2, and the image stamps are of size 23.7×23.7 arcsec2. Each confirmed variable lies at the centre of its corresponding image stamp and is marked by a cross-hair. Note that finding charts for V27 and V35 are not available from our data because these variables are not in our field of view. The best-finding chart for these stars may be found in Dickens (1972).
Our V, r and I time-series photometry for all the confirmed variables in NGC 6981 in our field of view is available in Table 4, of which we reproduce only a small part in this paper, and which is available in full in electronic form (see Supporting Information).
Time-series V, r and I photometry for all the confirmed variables in our field of view, except V27 and V35 which lie outside of our field of view. The standard Mstd and instrumental mins magnitudes are listed in columns 4 and 5, respectively, corresponding to the variable star, filter, and epoch of mid-exposure listed in columns 1-3, respectively (note that we do not supply standard R magnitudes). The uncertainty on mins is listed in column 6, which also corresponds to the uncertainty on Mstd. For completeness, we also list the quantities fref, fdiff and p from equation (2) in columns 7, 9 and 11, along with the uncertainties σref and σdiff in columns 8 and 10. This is an extract from the full table, which is available with the electronic version of the article (see Supporting Information).
| Variable Star ID | Filter | HJD (d) | Mstd (mag) | mins (mag) | σm (mag) | fref (ADU s−1) | σref (ADU s−1) | fdiff (ADU s−1) | σdiff (ADU s−1) | p |
| V1 | V | 245 3283.09908 | 16.954 | 17.537 | 0.006 | 1242.465 | 0.924 | −274.361 | 5.059 | 0.9944 |
| V1 | V | 245 3283.10500 | 16.949 | 17.531 | 0.003 | 1242.465 | 0.924 | −270.162 | 2.872 | 0.9982 |
| ⋮ | ⋮ | ⋮ | ⋮ | ⋮ | ⋮ | ⋮ | ⋮ | ⋮ | ⋮ | ⋮ |
| V1 | R | 245 3283.10977 | 0.000 | 17.241 | 0.003 | 1520.098 | 1.141 | −248.860 | 3.744 | 0.9937 |
| V1 | R | 245 3283.11633 | 0.000 | 17.256 | 0.004 | 1520.098 | 1.141 | −266.380 | 4.027 | 0.9950 |
| ⋮ | ⋮ | ⋮ | ⋮ | ⋮ | ⋮ | ⋮ | ⋮ | ⋮ | ⋮ | ⋮ |
| V1 | I | 245 5088.17344 | 16.544 | 17.659 | 0.005 | 862.748 | 4.245 | 0.747 | 4.130 | 0.9995 |
| V1 | I | 245 5088.17589 | 16.547 | 17.662 | 0.005 | 862.748 | 4.245 | −1.156 | 4.252 | 1.0009 |
| ⋮ | ⋮ | ⋮ | ⋮ | ⋮ | ⋮ | ⋮ | ⋮ | ⋮ | ⋮ | ⋮ |
The following sections describe our findings for the variables in NGC 6981, including our detection of previously unknown variables.
3.1 Stars without light curves
The stars V27, V35, V38 and V42 do not have light curves in our data set. The reason for this is that V27 and V35 are not in our field of view, and V42 is saturated in our reference image for each filter. For V38, we were unable to perform photometric measurements on the difference images because the star lies very close to a saturated star in our reference image for each filter (see Section 2.3). We note that both V27 and V35 have light curves published in Dickens & Flinn (1972), and V35 has a light curve published in Nobili (1957). These published light curves show clear variations of the RR0 type, and periods for these variables have been measured in more than one publication. Consequently we include these stars as confirmed variables in Table 2.
The stars V38 and V42 have not been included in Table 2 because there have been no published light curves or periods for these two stars, and the only claim to their variability are the brief statements of this property in Sawyer (1953) and Dickens & Flinn (1973). The proximity of V38 to a much brighter star may have confused its identification as a variable by Sawyer (1953). Therefore, further time-series observations will be required to promote either of these stars to confirmed variables.
3.2 Stars that do not show variability
Considering first the stars V1–V34 listed in SH1920, we find that our light curves for V6, V19, V22, V26, V30, V33 and V34 do not show any variability, and that the ∼7–20 mmag rms scatter in the light curves is consistent with the noise for the majority of constant stars of ∼17th magnitude (see Fig. 2). This confirms the comment made in SH1920 that V6, V19, V22, V26 and V33 ‘do not appear to be conspicuously variable’, and refutes the statement that V30 and V34 ‘undoubtedly vary’. In the light of our precision photometry, we have dropped these stars from the variables listed in Table 2.
Similarly, we find that V37, V39, V40 and V41, from the list of stars V35–V41 claimed to be variable by Sawyer (1953), show no variability in our light curves, although the light curves of V37 and V39 suffer from some outlier photometric measurements leading to artificially large rms magnitude deviations (see Fig. 2). Hence, we have also dropped these stars from the variables listed in Table 2.
Finally, for the variable star candidates S1–S9 and R1–R7 from Kadla et al. (1995), we do not detect any variability above the ∼8–35 mmag light-curve noise level for the stars S1, S2, S4, S6, R1, R2, R5, R6 and R7, and therefore we have dropped these stars from the variables listed in Table 2. The remaining variable star candidates are RR Lyrae stars (see Section 3.5).
3.3 Detection of new variable stars
Stars V43–V56 are newly detected variables. Of these, V43-V49 were discovered by inspection of the light curves of the variable star candidates from Kadla et al. (1995), and V50–V53 were identified in the sequence of difference images as clearly varying sources. By converting each difference image Dkij to an image of absolute deviations in units of sigma D′kij = |Dkij |/σkij (see equation 1) and then constructing the sum of all such images  for each filter, one can identify candidate variable sources as PSF-like peaks in the image Sij. Using this method, we discovered the new variables V54–V56, and we recovered all of the other variable stars listed in Table 2.
We also searched for variability in the set of light curves by applying the string-length method (Burke, Rolland & Boy 1970; Dworetsky 1983) to each light curve to determine the best period and a corresponding normalized string-length statistic SQ. Exploration of the light curves with the smallest values of SQ by phasing them with their best period recovered most of the RR Lyrae stars in our list of variables, but did not yield any further variable star detections. In conjunction with the string-length search method, we inspected the light curves of all stars with an unusually large rms magnitude deviation using the plots in Fig. 2 as a guide to the typical rms values at a given magnitude. Again, we did not discover any more variable stars.
A useful result of the string-length period search was that we had obtained initial period estimates for the variable stars, from which we were able to determine accurate periods by performing another string-length period search around the initial period estimates, but using a finer grid of test periods. Care was taken with the analysis of light curves showing the Blazhko effect (see Section 3.5), and in these cases we used appropriate subsets of self-consistent data to obtain the correct period. Note that we were unable to determine periods for the variables V44, V45, V52 and V53, and that the period for V51 is unreliable (see Section 3.5). For the SX Phoenicis stars V54–V56, we used a different method to determine their periods (see Section 3.7).
3.4 Variable stars with blended PSFs
NGC 6981 has a very crowded central concentration of stars which implies that many of the variables we have observed are blended with other stars, and those that we observed towards the centre of the globular cluster are almost certainly blended with one or more sources. In most cases, the blend stars are much fainter than the variable stars (which are dominated by bright RR Lyrae stars) and will have little effect on the measured reference fluxes and light-curve variation amplitudes (see Section 2.3). However, as a useful guide to the likelihood of a variable including a blend, in column 4 of Table 2 we indicate whether a variable star lies in the crowded centre of the cluster or not, by setting a dividing line at a radius of 50 arcsec within which no sky background is visible in our reference images.
The PSF of all confirmed variable stars in the reference images was inspected in detail in order to identify blended PSFs. We find that V18, V24, V36, V45, V51 and V52 are closely blended with stars of similar or greater brightness, and in these cases the variable star reference flux may be unreliable, depending on the success of the deblending iterations applied by the DanDIA software. The blend status of these variables is clearly marked in Table 2.
3.5 RR Lyrae stars
In Table 2 we present data on 36 confirmed RR Lyrae stars, 31 of which we classify as RR0 type, and five as RR1 type, although the classification for V51 is a little uncertain. Classification was based primarily on light-curve shape and period, and confirmation of our results was achieved by constructing the Bailey diagram of amplitude versus period, which clearly separates the RR0 stars from the RR1 stars (see Fig. 4). In the Bailey diagram, we also plot the average distribution of the RR0 and RR1 variables in M3 (Cacciari, Corwin & Carney 2005), the prototype Oosterhoff type I cluster, for comparison purposes. We note that V27 has an anomalously large amplitude (taken from Dickens & Flinn 1972) for its period, and that V46 has an anomalously small amplitude for its period.
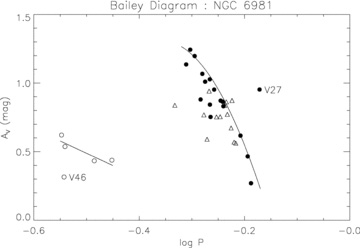
Bailey diagram of the light curve V amplitude versus (log-)period for the RR Lyrae stars in NGC 6981. Variables of the RR0 type are plotted as solid circles where the light-curve amplitude is well defined between observed maxima and minima, and they are plotted as open triangles otherwise (which then represent a lower bound to the V amplitude). Variables of the RR1 type are plotted as open circles. V51 has been omitted from this plot because it does not have a reliable period estimate. The continuous lines represent the average distribution of the RR0 and RR1 variables in M3 from Cacciari et al. (2005). The clear outliers in this diagram are labelled with their variable star designations, namely V27 and V46.
Phased V and r light curves of the 29 RR0 and five RR1 stars for which we have data are displayed in Figs 5 and 6, respectively. Of these variables, five RR0 and two RR1 are new discoveries (V47–V51 and V43,V46).
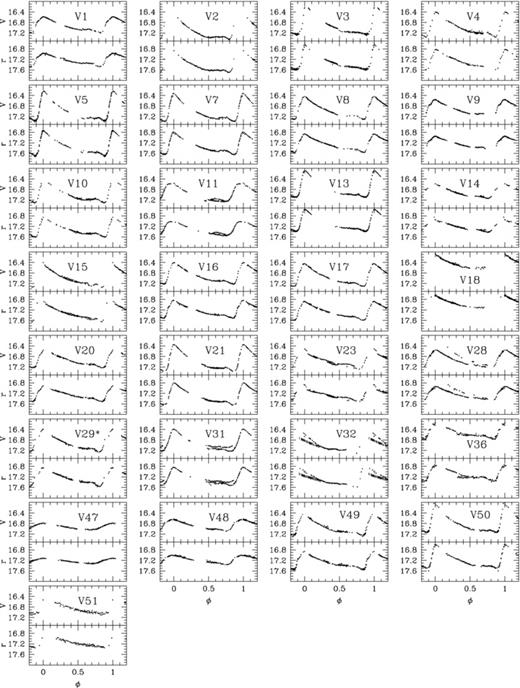
Phased V and r light curves of the 29 RR0 stars for which we have data, using the periods listed in Table 2. The light curve for V29, marked with an asterisk, is phased with the period and secular period change detailed in Table 2. For V32, the only data to show the Blazhko effect are the observations from the nights in 2005, which do not phase well with the rest of the light curve, and are marked in the corresponding plot panel by vertical-dashed data points.
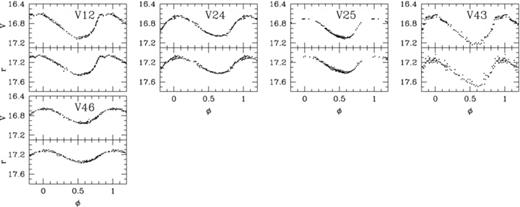
Phased V and r light curves of the five RR1 stars for which we have data, using the periods listed in Table 2.
Our observations for V51 have poor phase coverage such that they only cover the falling part of the light curve. Consequently, we have been unable to derive a reliable period, and the period P = 0.357335 d that we present in Table 2 derived using the string-length method is probably a smaller period alias of the real period. There is no information in the light curve that enables us to rule out other plausible period aliases. Although V51 is blended in the reference image, it still lies neatly in the RR0 dominated region of the instability strip in the horizontal branch of the V−r CMD (see Fig. 7). Based on this evidence, V51 is clearly an RR Lyrae star, most likely of the RR0 type. Further evidence for the RR0 type comes from the non-sinusoidal shape of the light curve at the derived period.
A portion of the V−r CMD for NGC 6981, focussing on the horizontal branch and part of the red giant branch. RR Lyrae variables of the RR0 and RR1 type are plotted as solid and open blue circles, respectively. Three of the suspected RR Lyrae variables are plotted as solid green circles.
It is currently believed that the Blazhko effect (Blazhko 1907), a periodic modulation of both the light-curve amplitude and phase on time-scales of typically tens to hundreds of days, occurs frequently (≳40 per cent) in RR0 stars (Jurcsik et al. 2009; Kolenberg et al. 2010). Until recently, the incidence rate of the Blazhko effect in RR0 stars was estimated to be substantially lower (e.g. ∼25 per cent in Smith 1981). However, this picture has become clearer with the execution and analysis of long-time-base quasi-continuous photometric observations of high precision, enabling one to detect smaller amplitude manifestations of the effect, and to detect the cases of RR0 stars exhibiting unstable Blazhko effects such as abrupt changes in the modulation amplitude and/or the appearance/disappearance of the Blazkho effect. Note that the Blazhko effect has also been detected in a number of RR1 stars (e.g. Wils, Kleidis & Broens 2008).
Our observations cover a ∼5 yr baseline with intense observations during small groups of nights. The ∼10 mmag precision that we have achieved at V = 17 mag allows us to detect small changes in amplitude and/or period of the RR Lyrae stars on the typical time-scale of the Blazhko effect. The RR0 variables V11, V23, V28, V31 and V32 show a Blazhko effect that is clearly visible in the phased light curves in Fig. 5. Further careful inspection of the phased light curves (at a smaller scale and using different plot symbol colours for each observation night) has allowed us to detect a small amplitude Blazhko effect in the light curves of the RR0 variables V10, V14, V15, V36 and V49, which is not so visible in the phased light curves in Fig. 5 due to the large scale that has been used. A more detailed analysis of the periodicity of the Blazhko effect in these variables is not possible with our data since we have observed very few light-curve maxima (see column 5 of Table 2). Note that we do not find evidence for the Blazhko effect in the light curves of the RR1 variables.
Having detected the Blazhko effect in 10 out of 29 RR0 variables, we can safely place a ∼34 per cent lower limit on the rate of incidence of the Blazhko effect in RR0 stars in NGC 6981. We state that this is a lower limit because we are convinced that with more observations during our time-base and/or with an extension to our time-base, it is possible to detect more small amplitude Blazhko effects.

For the Blazhko effect variables described above, it is clear that the secular period change model cannot explain the observed light-curve variations. However, for the variable V29, which we originally suspected of exhibiting the Blazhko effect, we find that the light curve produces a much better phased light curve for P0 = 0.597472 d at epoch E = 245 3507.446 d and with β≈−1.38 × 10⁻⁸ d d−1, indicating that the star pulsation frequency is slowly increasing over time. The derived value for β is rather large compared to typical values for RR0 stars (e.g. Jurcsik et al. 2001) although it is certainly plausible.
In Fig. 7, we show a portion of the V−r CMD for NGC 6981 that focusses on the horizontal branch and includes part of the red giant branch. As expected, the RR0 stars cluster towards the red end of the instability strip, and the RR1 stars cluster towards the blue end. There is, however, some scatter in the positions of the RR Lyrae stars, which is due to certain systematic errors in the measured mean magnitudes. Of the RR Lyrae stars with blended PSFs, V18 and V36 have clearly overestimated mean magnitudes in V and r, which leads to a systematic error in their position on the CMD. The two other such stars, V24 and V51, do not suffer from this problem, presumably because the DanDIA software was able to perform successful deblending. Other outliers in the CMD may be explained by systematic errors associated with calculating the mean magnitude for an incomplete phased light curve (e.g. V2, V13, V25).
3.6 Suspected RR Lyrae stars
Each of the variables V44, V45 and V53 lies close to a saturated star in the V and R reference images, and their light curves suffer from missing epochs caused by the saturated pixels (see Section 2.3). In fact, for V44 and V45, the light curves only contain photometry from the night of 20041005 (the night of best-seeing), and V44 is further missing photometry in the R filter. For V53, the light curve only contains photometry from the nights of 20041004 and 20041005. It is this lack of data that has prohibited us from determining periods for these variables (see end of Section 3.3). The light curves for V44, V45 and V53 are presented in Fig. 8.
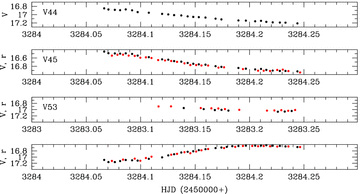
The V (black circles) and r (red circles) light curves for the variables V44 (top panel), V45 (upper-middle panel) and V53 (lower two panels). The r light curves have been offset in magnitude such that the mean r magnitude matches the mean V magnitude for each star. Period determination has not been possible due to the lack of data.
The variable V52 has a very poor phase coverage with our observations which has also prohibited us from determining a period. We present the light curve for this variable in Fig. 9.
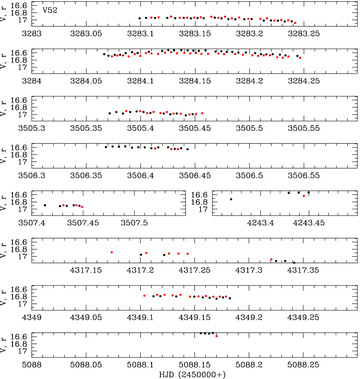
The V (black circles) and r (red circles) light curve for the variable V52. The r light curve has been offset in magnitude such that the mean r magnitude matches the mean V magnitude. Period determination has not been possible due to the very poor phase coverage of our data.
From the position of V45, V52 and V53 in the instability strip of the CMD in Fig. 7, it is obvious that these variables are RR Lyrae stars. We also believe that V45 is an RR0-type variable because the slow decline of the light curve over ∼0.2 d is not consistent with a sinusoidal light curve of the period expected for a typical RR1 type variable. We also believe that V44 is an RR0-type variable because it has a mean V magnitude of ∼17.04 mag, typical of the RR Lyrae stars in this cluster, and it exhibits a decline in brightness similar to V45 over the same time window (see Fig. 8).
3.7 SX Phoenicis stars
Recently, a large number of SX Phe type variables have been discovered in globular clusters in the blue straggler region of the CMD (e.g. Rodríguez & López-González 2000; Jeon et al. 2003; Dékány & Kovács 2009). In our search for new variables in NGC 6981, we have discovered three SX Phe type variables (V54–V56) and their light curves are presented in Fig. 10. We analysed each V and r light curve separately with the program period04 (Lenz & Breger 2005) in order to derive the dominant pulsation period and to search for any other pulsational frequencies. We accepted any frequencies with oscillation amplitudes in V that exceed the mean photometric uncertainties per data point in the corresponding light curve (15 mmag for V54, 31 mmag for V55 and 40 mmag for V56). The results of the frequency analysis for the V filter light curves are reported in Table 5. For V54, we detect two significant frequencies with frequency ratio f1/f2≈ 0.75, which therefore correspond to the fundamental (F) and first overtone (1H) radial oscillation modes. For V55 and V56, we did not detect any significant frequencies apart from the dominant frequency, and therefore we are unable to identify the mode of oscillation. Note that the periods listed in Table 2 for these variables are the periods corresponding to the frequency of the largest amplitude oscillation.
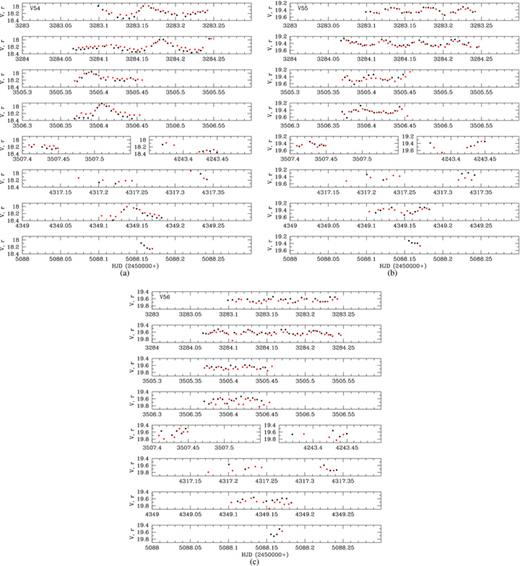
The V (black circles) and r (red circles) light curves for the SX Phe type variables: (a) V54, (b) V55 and (c) V56. The r light curves have been offset in magnitude such that the mean r magnitude matches the mean V magnitude for each star. Mean photometric uncertainties per data point in V and r are 15 and 15 mmag for V54, 31 and 35 mmag for V55, and 40 and 51 mmag for V56, respectively.
Detected pulsation frequencies for the SX Phe variables discovered in NGC 6981. For each SX Phe variable, we list the mean V magnitude A0 (column 2), the detected frequencies (columns 3 and 4), the corresponding (full) amplitude AV in the V filter (column 5) and the identified mode of oscillation at each frequency (column 6). The numbers in parentheses indicate the uncertainty on the last decimal place.
| Variable Star ID | A0 (V mag) | Label | Frequency (cycle d−1) | AV (mag) | Mode |
| V54 | 18.191(1) | f1 | 13.8915 | 0.246 | F |
| f2 | 18.4544 | 0.136 | 1H | ||
| V55 | 19.392(3) | f1 | 21.2618 | 0.174 | – |
| V56 | 19.613(3) | f1 | 24.7099 | 0.087 | – |
| Variable Star ID | A0 (V mag) | Label | Frequency (cycle d−1) | AV (mag) | Mode |
| V54 | 18.191(1) | f1 | 13.8915 | 0.246 | F |
| f2 | 18.4544 | 0.136 | 1H | ||
| V55 | 19.392(3) | f1 | 21.2618 | 0.174 | – |
| V56 | 19.613(3) | f1 | 24.7099 | 0.087 | – |
The positions of the variables V54–V56 in the calibrated V−I CMD are shown in Fig. 12 as solid red circles. The I images were observed at one epoch only, and hence we have calculated the V and I mean magnitudes for each star from the three V images taken closest in time to the three I images, and from the three I images themselves, respectively. The V and I mean magnitudes differ in epoch by ∼18 min, which is not important for the constant stars, but yields an approximate instantaneous colour for the variable stars. The fact that the V and I mean magnitudes are instantaneous rather than phase-averaged explains the spread of the RR Lyrae stars (solid and open blue circles) along the horizontal branch in Fig. 12 and the fact that the SX Phe variable V54 lies close to, but not within, the dashed box delimiting the blue straggler region, which has been taken from Harris (1993) for the cluster NGC 6366 and adapted to the distance and reddening of NGC 6981 (see Section 5.3). The other two variables V55 and V56 lie within the blue straggler region. This evidence, along with the fact that the periods of the largest amplitude oscillation are in the range 0.03–0.08 d, confirms our SX Phe type classification for these variables.
![The V−I CMD for NGC 6981. Note that the magnitude measurements approximate instantaneous magnitudes which explains the spread in the positions of the RR Lyrae stars along the horizontal branch (solid and open blue circles for the RR0 and RR1 variables, respectively) and the fact that one of the SX Phe variables (solid red circles) does not lie within the dashed box delimiting the blue straggler region. Theoretical isochrones from the stellar evolutionary models of VandenBerg et al. (2006) are plotted as solid coloured lines. The black solid isochrone has been linearly interpolated from the other isochrones to the Dotter et al. (2010) age of 12.75 Gyr and our derived metallicity of [Fe/H]ZW=−1.48.](https://oup.silverchair-cdn.com/oup/backfile/Content_public/Journal/mnras/413/2/10.1111_j.1365-2966.2011.18213.x/3/m_mnras0413-1275-f12.jpeg?Expires=1750239658&Signature=t8ldQJ3DxllXl-KNPLI0~OwhefTlrH6OMCRgMy~X7xtRELAl114fLRgy5sIzm5e6lHbfyyKV2w20eyeJi7NL1MMdbn7ZLefkkZQZ6ia0Eqp~CFtcbxMqIwbY32ivILcPcjBqrNIHSNBojv-jBOyWm8tAxZWCXRA-H8u0G2zYVhdhZWbhNQdPzUQBrP-osRq5cPBVJp9OHpgZ8auHTD7lh4ScMWJJG5~HwHTVWZRYnC97ioUzHGpjfQRGEfZrniY1B-qNu5BrbnOj7myO0nzm~Y2oDxQW9NX~0Ej7DoGh05jop7azmONxxmqEx3l4lHmLFic~hd35mjf6NyvsDeik0g__&Key-Pair-Id=APKAIE5G5CRDK6RD3PGA)
The V−I CMD for NGC 6981. Note that the magnitude measurements approximate instantaneous magnitudes which explains the spread in the positions of the RR Lyrae stars along the horizontal branch (solid and open blue circles for the RR0 and RR1 variables, respectively) and the fact that one of the SX Phe variables (solid red circles) does not lie within the dashed box delimiting the blue straggler region. Theoretical isochrones from the stellar evolutionary models of VandenBerg et al. (2006) are plotted as solid coloured lines. The black solid isochrone has been linearly interpolated from the other isochrones to the Dotter et al. (2010) age of 12.75 Gyr and our derived metallicity of [Fe/H]ZW=−1.48.
More observations of these variables are required to confirm the pulsational frequencies that we have detected, and to further characterize these stars.
4 PHYSICAL PARAMETERS OF THE RR LYRAE STARS
4.1 Fourier light-curve decomposition

Simon & Lee (1981) demonstrated that the light-curve Fourier parameters could provide useful information about pulsating variables, and currently, for Cepheids and RR Lyrae stars, the parameters are routinely used to provide information about pulsation modes and resonances, and estimates of physical parameters such as metallicity, luminosity and effective temperature. With this motivation, we have performed a Fourier decomposition of the V filter light curves of the RR Lyrae stars in NGC 6981 for which we have data and a reliable period estimate (i.e. 28 RR0 and five RR1-type variables). We note that the number of harmonics required for a good fit of a given light curve depends as much on the quality of the data, such as the amount of scatter and phase coverage, as on the light-curve shape. Therefore, we have chosen N for each light curve based on the highest degree harmonic for which the amplitude is significant. However, for some variables, the corresponding light curve does not yield a well-constrained Fourier decomposition due to a lack of full phase coverage, and we have abandoned the fits for the RR0-type variables V2, V3, V11, V13, V21, V29 and V32 due to this problem. For the RR0 variables exhibiting the Blazhko effect, we used the same subsets of self-consistent data as those used for the period determination.
In Table 6, we list the Fourier coefficients Ak for k = 0, 1, 2, 3, 4, and the Fourier parameters φ21, φ31 and φ41, for the 21 RR0 and five RR1 type variables for which the Fourier decomposition fit was successful, along with the number of harmonics N used to fit each light curve.
Fourier coefficients Ak for k = 0, 1, 2, 3, 4, and the Fourier parameters φ21, φ31 and φ41, for the 21 RR0 and 5 RR1 type variables for which the Fourier decomposition fit was successful. The numbers in parentheses indicate the uncertainty on the last decimal place. Also listed are the number of harmonics N used to fit the light curve of each variable, and the deviation parameter Dm (see Section 4.2).
| Variable Star ID | A0 (V mag) | A1 (V mag) | A2 (V mag) | A3 (V mag) | A4 (V mag) | φ21 | φ31 | φ41 | N | Dm |
| RR0 stars | ||||||||||
| V1 | 16.926(3) | 0.220(4) | 0.101(3) | 0.068(2) | 0.033(3) | 3.924(46) | 8.482(72) | 6.748(99) | 6 | 2.7 |
| V4 | 16.981(4) | 0.311(6) | 0.147(6) | 0.109(5) | 0.081(5) | 3.963(44) | 8.347(68) | 6.357(88) | 7 | 2.1 |
| V5a | 16.969(32) | 0.355(41) | 0.167(46) | 0.150(35) | 0.098(23) | 4.480(359) | 8.211(486) | 7.022(667) | 7 | 13.0 |
| V7a | 17.036(13) | 0.334(21) | 0.204(17) | 0.152(13) | 0.063(13) | 3.762(110) | 7.455(153) | 5.602(215) | 6 | 9.0 |
| V8 | 16.966(6) | 0.291(8) | 0.141(11) | 0.101(10) | 0.063(6) | 3.945(73) | 8.254(109) | 6.273(181) | 8 | 2.2 |
| V9 | 16.941(4) | 0.236(5) | 0.102(6) | 0.072(5) | 0.037(4) | 3.958(67) | 8.417(99) | 6.670(147) | 5 | 1.4 |
| V10b | 16.971(10) | 0.302(17) | 0.143(9) | 0.115(8) | 0.075(6) | 3.836(72) | 8.018(81) | 6.004(136) | 8 | 1.3 |
| V14b | 16.901(4) | 0.223(7) | 0.085(6) | 0.048(5) | 0.020(5) | 3.959(54) | 8.426(114) | 7.065(232) | 8 | 2.6 |
| V15b | 16.987(11) | 0.314(15) | 0.169(15) | 0.105(14) | 0.074(11) | 4.105(134) | 8.316(198) | 6.234(276) | 10 | 2.6 |
| V16 | 16.905(3) | 0.284(4) | 0.134(5) | 0.098(4) | 0.060(4) | 3.933(41) | 8.249(63) | 6.349(81) | 7 | 0.5 |
| V17 | 16.968(5) | 0.295(3) | 0.147(6) | 0.103(7) | 0.062(6) | 4.004(84) | 8.305(117) | 6.392(170) | 10 | 0.7 |
| V18c | 16.376(58) | 0.296(97) | 0.115(60) | 0.056(58) | 0.031(39) | 3.979(731) | 8.086(900) | 6.278(1101) | 6 | 2.6 |
| V20 | 16.934(2) | 0.240(4) | 0.113(4) | 0.081(3) | 0.046(2) | 4.113(36) | 8.644(60) | 6.881(102) | 6 | 1.4 |
| V23d | 16.948(2) | 0.241(3) | 0.142(4) | 0.109(4) | 0.051(3) | 4.177(34) | 8.611(47) | 6.678(82) | 6 | 2.9 |
| V28d | 16.968(4) | 0.266(5) | 0.133(5) | 0.071(5) | 0.031(4) | 4.108(35) | 8.633(74) | 6.960(169) | 8 | 1.9 |
| V31a, d | 16.958(20) | 0.303(19) | 0.181(23) | 0.065(23) | 0.063(16) | 3.509(265) | 7.590(411) | 5.773(464) | 5 | 8.5 |
| V36a, b, c | 16.503(5) | 0.214(6) | 0.124(6) | 0.062(5) | 0.040(5) | 3.746(76) | 8.229(140) | 6.266(179) | 4 | 3.2 |
| V47 | 16.926(1) | 0.112(2) | 0.030(1) | 0.011(2) | 0.001(2) | 4.286(71) | 8.669(126) | 8.513(1108) | 4 | 2.0 |
| V48a | 16.894(4) | 0.176(5) | 0.074(5) | 0.038(3) | 0.018(3) | 3.955(92) | 8.591(168) | 6.935(241) | 5 | 4.4 |
| V49b | 16.937(3) | 0.277(5) | 0.144(4) | 0.106(4) | 0.068(4) | 3.793(50) | 8.100(66) | 6.000(96) | 5 | 2.7 |
| V50 | 16.798(5) | 0.358(8) | 0.178(7) | 0.129(5) | 0.087(7) | 3.882(47) | 7.994(70) | 5.842(86) | 8 | 2.4 |
| RR1 stars | ||||||||||
| V12 | 16.856(2) | 0.251(2) | 0.047(3) | 0.020(2) | 0.018(2) | 4.667(46) | 2.594(122) | 1.044(131) | 7 | – |
| V24c | 16.861(1) | 0.206(2) | 0.026(2) | 0.013(2) | 0.006(2) | 4.598(80) | 3.053(147) | 2.714(342) | 10 | – |
| V25 | 16.882(3) | 0.204(4) | 0.030(5) | 0.021(3) | 0.009(3) | 5.359(83) | 3.726(205) | 2.427(454) | 5 | – |
| V43 | 16.939(4) | 0.278(5) | 0.056(5) | 0.014(5) | 0.012(5) | 4.628(98) | 2.406(355) | 0.702(414) | 4 | – |
| V46 | 16.806(1) | 0.149(2) | 0.009(2) | 0.005(2) | 0.003(2) | 4.498(196) | 3.519(367) | 0.284(695) | 4 | – |
a These RR0 variables have Dm > 3; bthese RR0 variables exhibit a small amplitude Blazhko effect; cclosely blended with stars of similar or greater brightness; dthese RR0 variables exhibit a large amplitude Blazhko effect.
In previous papers (Arellano Ferro et al. 2008a, 2010), we have discussed in detail the relations and corresponding zero-points that may be used to calculate the metallicities [Fe/H], absolute magnitudes MV, effective temperatures Teff, masses M and radii R of the RR Lyrae stars in globular clusters from the fit parameters derived from the Fourier decomposition of the V light curves. Currently there is some debate about the reliability of these relations with respect to the calculation of effective temperatures, masses and radii (e.g. Cacciari et al. 2005; Catelan 2004, see his section 4). Therefore, in the following sections, we refrain from calculating masses and radii, and for the other physical parameters we simply proceed to derive their values for the RR Lyrae stars in NGC 6981 based on the published relations with little further discussion.
4.2 Metallicity
 relation for RR0 type variables based on a data set of V light curves and independent spectroscopic metallicity estimates for 81 field RR0 variables:
 is a phase difference from the Fourier light-curve decomposition using a sine series, as opposed to a cosine series, and P is the period (d). The value of
  may be obtained from the equivalent phase difference φij in a cosine series via:
The empirical relation defined in equation (9) is only applicable to light curves of RR0 variables that are ‘similar’ to the light curves that were used to derive equation (9). For this purpose, Jurcsik & Kovács (1996) defined a deviation parameter Dm describing the deviation of a light curve from the calibrating light curves, based on the Fourier parameter interrelations, and a compatibility condition that Dm < 3. We list the values of Dm for our light curves in column 11 of Table 6.
In column 2 of Table 7, we report the metallicity estimates for each RR0 variable along with their uncertainties as obtained via equation (4) from Jurcsik & Kovács (1996). The metallicities show a large spread of values ranging over ∼1 dex due to a number of outliers. In order to highlight which RR0 stars produce outlier metallicity values, we have plotted the parameters φ31 versus P in Fig. 11 for the RR0 stars in Table 6, assuming that the uncertainty on P is negligible. We find that V7, V20, V23 and V28 have clearly anomalous φ31 values given the associated uncertainty. However, this is somewhat to be expected since V23 and V28 exhibit large amplitude Blazhko effects, and V7 has a non-compatible light curve with the relation in equation (9) (Dm > 3). For V20, we can find no reason why the light curve may yield an anomalous φ31 value.
Physical parameters of the RR0 variables. The numbers in parentheses indicate the uncertainty on the last decimal place.
| Variable Star ID | [Fe/H]ZW | MV (mag) | log (L/L⊙) | Teff (K) |
| V1 | −1.45(10) | 0.601(5) | 1.669(2) | 6334(30) |
| V4c | −1.33(9) | 0.623(8) | 1.660(3) | 6493(29) |
| V5a | −1.28(46) | 0.675(55) | 1.639(22) | 6483(204) |
| V7a | −2.06(16) | 0.673(27) | 1.640(11) | 6344(64) |
| V8 | −1.47(12) | 0.616(12) | 1.663(5) | 6433(47) |
| V9 | −1.45(11) | 0.608(7) | 1.666(3) | 6358(41) |
| V10 | −1.66(10) | 0.630(21) | 1.657(8) | 6408(36) |
| V14 | −1.46(13) | 0.598(9) | 1.670(4) | 6308(50) |
| V15 | −1.31(20) | 0.634(21) | 1.656(8) | 6519(84) |
| V16 | −1.50(9) | 0.612(6) | 1.664(2) | 6408(26) |
| V17 | −1.44(13) | 0.606(7) | 1.667(3) | 6430(49) |
| V18b | −1.51(85) | 0.622(5) | 1.660(49) | 6441(372) |
| V20a | −1.21(9) | 0.622(5) | 1.661(2) | 6425(26) |
| V23a, b, c | −1.20(8) | 0.657(5) | 1.646(2) | 6454(21) |
| V28a, b | −1.11(10) | 0.622(7) | 1.660(3) | 6476(34) |
| V31a, b | −2.00(39) | 0.611(29) | 1.665(12) | 6324(165) |
| V36a, b | −1.55(15) | 0.653(8) | 1.648(3) | 6366(57) |
| V47 | −1.39(14) | 0.641(3) | 1.653(1) | 6119(117) |
| V48a | −1.43(17) | 0.601(6) | 1.669(3) | 6294(69) |
| V49 | −1.65(9) | 0.623(7) | 1.660(3) | 6388(28) |
| V50 | −1.42(9) | 0.684(10) | 1.635(4) | 6569(30) |
| Weighted Mean: | −1.48(3) | 0.623(2) | 1.660(1) | 6418(10) |
a These variables are not included in the calculation of the mean metallicity (see Section 4.2).
b These variables are not included in the calculation of the mean absolute magnitude, log-luminosity or effective temperature (see Sections 4.3 and 4.4).
c V4 and V23 have spectroscopic metallicity measurements of −1.61 and −1.28, respectively, on the ZW scale (see Section 4.2).

We have decided to ignore the φ31 values for the RR0 stars with non-compatible light curves (V5, V7, V31, V36, V48), for those exhibiting large amplitude Blazhko effects (V23, V28, V31), and for V20. These ‘outlier’ variables are plotted in Fig. 11 as open circles. We note that it is not necessary to ignore the φ31 values for the blended RR0 stars since the φ31 parameter is a light-curve shape parameter that is unaffected by systematic errors in the light-curve amplitude due to blending (see Section 2.3). We used the remaining RR0 stars to fit a metallicity [Fe/H]ZW under the assumptions that the relation in equation (9) is correct and that NGC 6981 has no intrinsic spread in metallicity. We obtain [Fe/H]ZW≈−1.48 ± 0.03 and plot the corresponding relation as a straight line in Fig. 11. Clearly the Jurcsik & Kovács (1996) empirical  relation holds for the RR0 variables in NGC 6981. It is also satisfying to note that only the stars V7, V20, V23 and V28 have φ31 values with residuals greater than 3σ.
Physical parameters of the RR1 variables. The numbers in parentheses indicate the uncertainty on the last decimal place.
| Variable Star ID | [Fe/H]ZW | MV (mag) | log (L/L⊙) | Teff (K) |
| V12 | −1.59(21) | 0.568(9) | 1.651(4) | 7373(35) |
| V24 | −1.77(27) | 0.587(10) | 1.643(4) | 7280(32) |
| V25 | −1.70(42) | 0.515(14) | 1.672(6) | 7262(229) |
| V43 | −1.63(59) | 0.601(23) | 1.638(9) | 7372(74) |
| V46a | −1.04(66) | 0.643(12) | 1.621(5) | 7466(54) |
| Weighted Mean: | −1.66(15) | 0.568(6) | 1.651(2) | 7327(22) |
a This variable is anomalous in the Bailey diagram (see Fig. 4), and it has an anomalous φ31 value. Therefore, we have not included this variable in the calculation of the mean metallicity, absolute magnitude, log-luminosity or effective temperature (see Sections 4.2, 4.3 and 4.4).
We note that for the RR1 variable V46, the value of the φ31 parameter is anomalously large given the short period, and this has resulted in the derivation of an anomalous metallicity of −1.04 for this star. In the Bailey diagram in Fig. 4, we have already noted that V46 also has an anomalously small amplitude for its period, and therefore we have decided to exclude this variable from the calculations of the mean physical parameters of the RR1 variables in Table 8. Consequently, we calculate a mean metallicity of −1.66 ± 0.15 for the RR1 stars.
4.3 Absolute magnitude and luminosity

The empirical relations in equations (14) and (15) depend on a subset of the amplitude Fourier coefficients. Therefore, any variable which suffers from a systematic overestimate of the reference flux due to blending will yield Fourier amplitudes that are systematically too small, which in turn leads to a systematic error in the calculated value for MV. Of the RR Lyrae variables with Fourier decomposed light curves, V18, V24 and V36 are blended with stars of similar or greater brightness, although only V18 and V36 have noticeably brighter mean magnitudes A0 than the rest of the RR Lyrae stars (see Table 6). Consequently, we ignore the MV values for V18 and V36 in calculating the mean absolute magnitude in Table 7. We also ignore the MV values for V23, V28 and V31 because the strong Blazhko effect in these variables is likely to render the light-curve amplitude measurements as unreliable. Finally, we note that the compatibility condition described in Section 4.2 only applies to the empirical relation in equation (9). Hence we calculate mean absolute magnitudes of MV≈ 0.623 ± 0.002 and 0.568 ± 0.006 mag for the RR0 and RR1 variables, respectively.
4.4 Effective temperature

Equation (17) depends on the amplitude Fourier coefficient A1, and therefore, for the same reasons given in Section 4.3, we ignore the variables V18, V23, V28, V31 and V36 in the calculation of the mean effective temperature for the RR0 variables Teff≈ 6418 ± 10 K.

However, we urge caution in the use of the effective temperatures derived from the Fourier decomposition fit parameters since it has been shown by Cacciari et al. (2005) that the temperatures calculated via equations (18) and (19) do not match the colour–temperature relations predicted by the temperature scales of Sekiguchi & Fukugita (2000) or by the evolutionary models of Castelli (1999). In our previous works on NGC 5466 (Arellano Ferro et al. 2008a) and NGC 5053 (Arellano Ferro et al. 2010), we also found similar systematic errors in the effective temperatures derived from the light-curve Fourier parameters for the RR1 stars. However, for the RR0 stars, we found (Arellano Ferro et al. 2010) that the effective temperatures derived from the light-curve Fourier parameters agree with the colour–temperatures predicted by the horizontal branch models of VandenBerg, Bergbusch & Dowler (2006). Despite these caveats, we still provide the effective temperatures for the RR Lyrae stars in NGC 6981 in order to enable comparisons with similar work for other globular clusters.
5 CLUSTER PHYSICAL PARAMETERS
5.1 Oosterhoff classification
We calculate the mean periods for the RR0 and RR1 stars in NGC 6981 as 〈PRR0〉 = 0.563 d and 〈PRR1〉 = 0.308 d, respectively. We have used the periods derived in this work for all RR0 and RR1 variables except V51 due to its unreliable period, and we included the periods from Dickens & Flinn (1972) for the RR0 variables V27 and V35 which do not lie in our field of view. We also calculate the ratio of the number of RR1 to RR Lyrae type variables as nRR1/(nRR0+nRR1) ≈ 0.14 using 36 RR Lyrae stars with robust classifications (i.e. excluding V44, V45, V52 and V53). These quantities are clearly consistent with the classification of NGC 6981 as an Oosterhoff type I cluster (Smith 1995), which agrees with previous classifications (van Albada & Baker 1973; Castellani & Quarta 1987) based on the Dickens & Flinn (1972) survey of RR Lyraes, but employs an updated and more complete catalogue of RR Lyrae stars for a more robust result.
5.2 Cluster metallicity
The large discrepancy between the two metallicity values we have derived from considering the location of the blue and red edges of the instability strip would be reduced if any of the variables V44, V45, V51, V52 and V53 are found to be RR0 stars with periods shorter than 0.465 d or longer than 0.674 d. In fact, equation (22) is the most sensitive to a change in the period boundaries, and all that is required to bring the metallicity estimates from the shortest and longest periods into agreement at [Fe/H]ZW∼−1.66 is a ∼10 per cent increase in the value of Pmax to ∼0.74 d. We also note that any future periods determined for V44, V45, V51, V52 and V53 will influence the mean (log-)period of the RR0 variables in NGC 6981, which may also have a substantial effect on the metallicity estimated via equation (20) due to the high sensitivity of this relation on the mean log-period. In fact, we remain rather sceptical of the metallicity estimates for NGC 6981 that we have derived via equations (20), (21) and (22) from the work of Sandage for just these reasons, and fig. 4 from Cacciari et al. (2005) provides a clear graphical illustration of the potential problems with this method that we have described.
We have compiled estimates of [Fe/H] on the ZW scale given in the literature for NGC 6981 and obtained using a variety of methods, and we summarize the results in Table 9, which includes references and a very brief description of the methods employed.
Metallicity estimates for NGC 6981 on the ZW scale as found from an extensive literature search.
| [Fe/H]ZW | Reference | Method |
| −1.48 ± 0.03 | This work | Fourier light-curve decomposition of the RR Lyrae stars |
| −1.46 | Maraston et al. (2003) | Lick indices |
| −1.41 ± 0.30 | Thomas, Maraston & Bender (2003) | Lick indices |
| −1.26 ± 0.07 | Geisler, Clariá & Minniti (1997) | Washington photometry |
| −1.50 ± 0.05 | Rutledge, Hesser & Stetson (1997) | Ca ii triplet |
| −1.4 ± 0.1 | Brocato et al. (1996) | CMD analysis |
| −1.40 | Harris (1996) | Globular cluster cataloguea |
| −1.72 ± 0.19 | Brodie & Huchra (1990) | Absorption-line indices |
| −1.5 | Rodgers & Harding (1990) | Calcium abundance |
| −1.54 ± 0.09 | Zinn & West (1984) | Q39 spectral index |
| −1.58±0.12 | Zinn (1980) | Q39 spectral index |
a The catalogue version used is the updated 2003 version available at http://www.physics.mcmaster.ca/Globular.html.
In Section 4.2, we calculated mean metallicities of −1.48 ± 0.03 and −1.66 ± 0.15 on the ZW scale for the RR0 and RR1 type variables, respectively. The smaller uncertainty on the result for the RR0 stars is mainly a consequence of the inclusion of more stars in the calculation of the mean metallicity for the RR0 variables (13 RR0 stars as opposed to four RR1 stars). It should be noted that the uncertainties we have quoted only represent the internal error for each metallicity estimate, and do not include any systematic errors that may be inherent in the Fourier light-curve decomposition method that we have employed. Given the fact that different empirical relations have been used to estimate the metallicities of the RR0 and RR1 stars, there may be some systematic offset between the metallicity estimates of the two types of variable. However, assuming that this is not the case, and performing a combined mean metallicity estimate for all 17 stars also yields a mean metallicity of ∼−1.48 ± 0.03. Hence, we adopt [Fe/H]ZW≈−1.48 ± 0.03 as our estimate of the metallicity of NGC 6981 on the ZW scale via the Fourier decomposition of the light curves of the RR Lyrae variables, which lies in the middle of the distribution of the other metallicity estimates for the cluster from a large range of independent methods that are listed in Table 9.

5.3 Distance
To determine the distance to NGC 6981, the RR Lyrae stars can serve as standard candles since we have estimated their mean absolute magnitudes in Section 4.3 as MV≈ 0.623 ± 0.002 and 0.568 ± 0.006 mag for the RR0 and RR1 variables, respectively. We calculate the average of the RR0 and RR1 star mean V magnitudes (A0 from Table 6) as ∼16.927 ± 0.001 and ∼16.865 ± 0.001 mag, respectively (excluding the variables V18, V23, V28, V31 and V36 from the calculation for the RR0 stars because of the likely influence of blending and the Blazhko effect on the measured mean magnitudes for these stars, and excluding the variable V46 from the calculation for the RR1 stars because of its anomalous status). This implies mean apparent distance moduli of μ≈ 16.303 ± 0.002 and 16.297 ± 0.006 mag for the RR0 and RR1 variables, respectively.
NGC 6981 is known to be a globular cluster with relatively low interstellar extinction. The many values in the literature for the associated interstellar reddening range from E(B−V) = 0.00 mag (Searle & Zinn 1978) to E(B−V) = 0.11 ± 0.03 mag (Rodgers & Harding 1990), with a median value of E(B−V) = 0.06 mag. The two most recent determinations include E(B−V) = 0.06 mag from the analysis of 100-μm emission from interstellar dust (Schlegel, Finkbeiner & Davis 1998), and E(B−V) = 0.070 ± 0.015 mag from the comparison of predicted and measured colours as a function of B light-curve amplitude for the RR0 stars (De Santis & Cassisi 1999). For the purpose of our analysis, we adopt a reddening of E(B−V) = 0.06 ± 0.015 mag.
Assuming RV = 3.1 for our Galaxy, we derive mean true distance moduli of μ0≈ 16.117 ± 0.047 and 16.111 ± 0.047 mag for the RR0 and RR1 variables, respectively, which translate to mean distances of ∼16.73 ± 0.36 kpc and ∼16.68 ± 0.36 kpc, respectively. Even though both of these distance estimates are consistent with a true distance modulus for the LMC of μ0 = 18.5 mag, they are calculated via two different empirical relations, each of which has its own systematic uncertainty, and therefore we cannot simply calculate an overall distance estimate from all RR Lyrae stars put together.
In Table 10, we report our distance estimates for NGC 6981 along with those we found in the literature search. We list both true distance moduli (where available) and distances (kpc) along with references and methods employed. The distances from the literature show considerable spread, although varying assumptions about the amount of reddening towards NGC 6981 certainly contribute significantly to the scatter. Our distance estimates would range from ∼15.5 kpc to ∼18.2 kpc by simply changing our assumption about the reddening to values in the range 0.00 ≤E(B−V) ≤ 0.11 (defined by the minimum and maximum measured reddening values in the literature). We observe that our distance estimates for NGC 6981 fall towards the shorter end of the distribution of distance estimates from the literature, and it is satisfying to note that our mean distances for both types of RR Lyrae star are in excellent agreement.
True distance moduli (column 1), and distance estimates (column 2), for NGC 6981 as found from an extensive literature search.
| μ0 (mag) | Distance (kpc) | Reference | Method |
| 16.117 ± 0.047 | 16.73 ± 0.36 | This paper | Fourier light-curve decomposition of the RR0 stars |
| 16.111 ± 0.047 | 16.68 ± 0.36 | This paper | Fourier light-curve decomposition of the RR1 stars |
| 16.42 ± 0.01 | 19.23 ± 0.09 | Cassisi, De Santis & Piersimoni (2001) | Magnitude of the zero-age horizontal branch |
| 16.52 | 20.14 | Zoccali & Piotto (2000) | Globular cluster luminosity function |
| 16.08 | 16.44 | Ferraro et al. (1999) | Magnitude of the zero-age horizontal branch |
| – | 17.0 | Harris (1996) | Globular cluster cataloguea |
| 16.30 ± 0.05 | 18.20 ± 0.42 | Jimenez et al. (1996) | CMD analysis |
| – | 16.4 | Zinn (1980) | Q39 spectral index |
| 16.29 | 18.1 | Searle & Zinn (1978) | Spectral indices |
| 16.30 | 18.2 | Woltjer (1975) | Mean magnitude of the RR Lyrae stars |
| 15.73 | 14.0 | Dickens & Flinn (1972) | Mean magnitude of the RR Lyrae stars |
| 17.0 | 25 | Kron & Mayall (1960) | Mean magnitude of the RR Lyrae stars |
a The catalogue version used is the updated 2003 version available at http://www.physics.mcmaster.ca/Globular.html.
5.4 Age
It is only in the last 20 yr that measurements of the age of NGC 6981 have appeared in the literature, and they number far fewer then the number of measurements of the metallicity and distance. We present the measured ages from the literature in Table 11, and we observe that the measurements have converged to a value of ∼13 Gyr.
Age estimates for NGC 6981 as found from an extensive literature search.
| Age (Gyr) | Reference | Method |
| 12.75 ± 0.75 | Dotter et al. (2010) | Isochrone fitting to the CMD |
| 9.5 | Meissner & Weiss (2006) | Isochrone fitting to the CMD |
| 12.6 ± 1.0 | Rakos & Schombert (2005) | Strömgren photometry |
| 14 | Zoccali & Piotto (2000) | Globular cluster luminosity function |
| 12.7 ± 2, 13.0 ± 2, 13.5 ± 2 | Jimenez et al. (1996) | CMD analysis |
| 12.4 ± 2.2 | Sarajedini & King (1989) | CMD analysis |
An exquisitely precise and deep CMD for NGC 6981 has been constructed by Anderson et al. (2008) through careful processing of a stack of images of NGC 6981 obtained with the Wide-Field Channel of the Advanced Camera for Surveys (ACS) on board the Hubble Space Telescope. These images were observed as part of the ACS Survey of globular clusters which includes observations of the central ∼3 × 3 arcmin2 of 65 Galactic globular clusters. Subsequent analysis of all the cluster CMDs in the survey via main-sequence fitting and main-sequence turn-off (MSTO) measurements allowed Marín-Franch et al. (2009) to determine precise (2–7 per cent uncertainty) relative ages between the clusters. Dotter et al. (2010) placed these relative ages on an absolute scale, thereby deriving an age of 12.75 ± 0.75 Gyr for NGC 6981, which is the most precise age measurement to date.
Our calibrated photometric data for NGC 6981 in the V and I bands do not reach as deep as the corresponding ACS data. Also, in our observations, most stars in the central region (3 × 3 arcmin2) of the globular cluster are blended with other cluster members, making accurate absolute photometry a very difficult task for the vast majority of cluster members, and introducing systematic photometric errors due to poorly modelled PSFs and blended light contamination. The space-based observations enjoy a much better spatial resolution than our data due to the lack of blurring from an intervening atmosphere, and therefore the ACS photometry is of much better accuracy with considerably less systematic errors due to blending. Hence, any analysis of the CMD from our data for determining the cluster age cannot compete with the similar analysis by Dotter et al. (2010) of the ACS CMD.
In the calibrated V−I CMD presented in Fig. 12, we overplot a theoretical isochrone (solid black line) corresponding to the Dotter et al. (2010) age of 12.75 Gyr, our derived metallicity of [Fe/H]ZW=−1.48, an α-element abundance of [α/Fe]=+0.3 (a typical assumption for globular clusters), and an apparent distance modulus of μ = 16.303 mag (our result for the RR0 stars). The isochrone has been linearly interpolated from the four nearest isochrones in age and metallicity as taken from the stellar evolutionary models of VandenBerg et al. (2006), which are also plotted in Fig. 12 as solid coloured lines. The isochrones show that our CMD is consistent with the age for NGC 6981 derived by Dotter et al. (2010), although the fit to the upper part of the red giant branch is too red by about ∼0.1 mag. This mismatch can be slightly improved by adopting a more metal-poor isochrone but at the expense of a worsening fit near the MSTO. Note that we have not applied a V−I colour correction to the isochrones due to reddening since this correction makes the isochrone fit considerably worse by shifting the isochrones by ∼0.076 mag to the right [assuming E(B−V) = 0.06 mag]. This implies that the adopted reddening is too large and/or that the adopted theoretical isochrones are systematically too red at the cluster age and metallicity.
6 SUMMARY AND CONCLUSIONS
We employed the technique of DIA to perform precision differential photometry on a set of CCD time-series observations of the globular cluster NGC 6981 in the Johnson V, R and I filters. The difference imaging technique has allowed us to study in detail the variable star population of the cluster, including in the highly crowded central regions where traditional PSF fitting fails. Compared to previous photographic studies of this cluster, our photometry is deeper by ∼4 mag, achieves a much better precision per data point (≤20 mmag down to ∼18.5 mag as opposed to ∼50 mmag at ∼17 mag), and covers a longer time-base of ∼5 yr with substantially more data points (∼100 compared to ∼20–60).
Consequently, we have been able to perform a census of the variable star population in NGC 6981, and to clarify the status of already known and suspected variables in the cluster. We have shown that 20 of the 58 stars that are labelled as variables in the literature are actually non-variable, and we present the details of all 43 confirmed variables in NGC 6981 in Table 2.
We have discovered 14 of the 43 confirmed variables in NGC 6981 from our data. The new detections consist of 11 RR Lyrae variables and three SX Phe variables, although we were only able to derive reliable periods for six of the newly discovered RR Lyrae stars. For the 27 of the 29 previously known RR Lyrae variables that lie in our field of view, we calculated a new set of ephemerides that improve substantially on their previous values in terms of accuracy.
The current set of 43 variables in NGC 6981 consists of 40 RR Lyrae stars and three SX Phe stars. Furthermore, the set of RR Lyrae stars is made up of 31 RR0 type variables, five RR1 type variables and four RR Lyrae variables with an ambiguous subtype, although these variables are most likely to be of the RR0 type (V44, V45, V52 and V53). Based on the mean periods for the RR0 and RR1 variables, and the ratio of the number of RR1 to RR0 type variables, we confirm the Oosterhoff type I classification for NGC 6981. We report the detection of a strong Blazhko effect in five RR0 variables (V11, V23, V28, V31 and V32), and a smaller amplitude Blazhko effect in another five RR0 variables (V10, V14, V15, V36 and V49), which implies a ∼34 per cent lower limit on the rate of incidence of the Blazhko effect in RR0 stars in NGC 6981. We also find that the RR0 star V29 exhibits a secular period change of β≈−1.38 × 10⁻⁸ d d−1, indicating that the star pulsation frequency is slowly increasing over time.
Our analysis of the light curves of the SX Phe variables has allowed us to detect two pulsation frequencies in the variable V54, corresponding to the fundamental and first overtone radial oscillation modes. We did not detect any other frequencies apart from the dominant frequency for the other two SX Phe variables, and therefore we are unable to identify their modes of oscillation.
We provide calibrated V and I photometry in the Johnson–Kron–Cousins photometric system, derived from the analysis of a set of standard stars in the field of the cluster, and instrumental r photometry, for all of the 41 confirmed variables in NGC 6981 in our field of view. These data are available in electronic form (see Supporting Information) and the format is shown in Table 4. In order to collect the information required to observe these objects into one place, we calculate celestial coordinates for each variable (see Table 3) and provide detailed finding charts in Fig. 3. Finding charts for the two RR Lyrae variables V27 and V35 that are not in our field of view may be found in Dickens (1972).
We performed a Fourier decomposition of the light curves for 21 RR0 and five RR1 variables with reliable period estimates and suitable phase coverage, and we report the corresponding Fourier coefficients in Table 6. The Fourier parameters have been used to estimate the metallicity, absolute magnitude, log-luminosity and effective temperature for each RR Lyrae star based on empirical, semi-empirical and theoretical relations available in the literature. Assuming that the RR Lyrae stars in NGC 6981 are of the same composition, distance and age, then appropriate averages of the derived properties of the RR Lyrae stars may be calculated and employed as estimates of these properties for the parent cluster. Applying this method, we derive a metallicity of [Fe/H]ZW≈−1.48 ± 0.03 on the ZW scale for NGC 6981, and [Fe/H]UVES≈−1.38 ± 0.03 on the new Carretta et al. (2009) scale. Similarly, we derive mean true distance moduli of μ0≈ 16.117 ± 0.047 and 16.111 ± 0.047 mag for the RR0 and RR1 variables, respectively, and corresponding distances to NGC 6981 of ∼16.73 ± 0.36 kpc and ∼16.68 ± 0.36 kpc, respectively.
The age of NGC 6981 has been estimated by Dotter et al. (2010) as 12.75 ± 0.75 Gyr from analysis of Hubble Space Telescope ACS observations, and our calibrated V−I CMD cannot compete with their data in terms of accuracy and lack of systematic errors. Hence, we simply demonstrate that our CMD data are consistent with the isochrones of the VandenBerg et al. (2006) stellar evolutionary models when interpolated to the age and metallicity of NGC 6981, and if one chooses to ignore the colour effect of the reddening. It is likely that the reddening is smaller than we assumed in Section 5.3 or that there is a systematic error in the colour of the theoretical stellar evolutionary models that we adopted, or both.
DanDIA is built from the DanIDL library of idl routines available at http://www.danidl.co.uk.
This research has made use of the SIMBAD data base (http://simbad.u-strasbg.fr/simbad/), operated at CDS, Strasbourg, France, which was essential for performing a complete bibliographical search for NGC 6981. We would like to thank the support astronomers at IAO, Hanle and CREST (Hosakote), for their efforts in acquiring the data. Our thanks also goes to ESO librarian Uta Grothkopf for hunting down the articles of Rosino (1953) and Nobili (1957) which are not available through ADS, and to Vincenzo Forchì who translated them from Italian. We appreciate the highly useful comments from the referee Christine Clement, and from Carla Cacciari and Don VandenBerg, who all helped in improving the paper. We acknowledge support from the DST-CONACYT collaboration project and the DGAPA-UNAM grant through project IN114309 at several stages of the work. Roberto Figuera is grateful to ESO for their hospitality and financial support during three months while working on this paper. I dedicate this work to my little sister Lucia Muñiz Santacoloma.
REFERENCES
SUPPORTING INFORMATION
Additional Supporting Information may be found in the online version of this article.
Table 4. Time-series V, r and I photometry for all the confirmed variables in our field of view, except V27 and V35 which lie outside of our field of view.
Please note: Wiley-Blackwell are not responsible for the content or functionality of any supporting materials supplied by the authors. Any queries (other than missing material) should be directed to the corresponding author for the article.
