


Abstract
Lithium (Li) abundances are presented and discussed for 70 members of the 50-Myr-old open cluster α Per. More than half of the abundances are from new high-resolution spectra. The Li abundance in the F-type stars is equal to its presumed initial abundance, confirming previous suggestions that pre-main-sequence depletion is ineffective for these stars. Intrinsic star-to-star scatter in Li abundance among these stars is comparable to the measurement uncertainties. There is marginal evidence that the stars of high projected rotational velocity (v sin i) follow a different abundance versus temperature trend from the slow rotators. For stars cooler than about 5500 K, the Li abundance declines steeply with decreasing temperature and there develops a star-to-star scatter in the Li abundance. This scatter is shown to resemble the well-documented scatter seen in the 70-Myr-old Pleiades cluster. The scatter appears to be far less pronounced in the 30-Myr clusters, which have been studied for Li abundance.
1 INTRODUCTION
Abundance measurements of lithium (Li) in stellar atmospheres have long been an active pursuit for observers and theoreticians alike. Much of the activity is directed at understanding the depletion of the atmospheric Li from its abundance, often an inferred quantity, acquired at birth. Open clusters serve as astrophysical laboratories in which to investigate the internal depletion of Li, because a given cluster provides a close approximation to a sample of coeval stars of a common age and initial composition, including that of Li, but spanning a range of masses and other properties, such as rotation. Crucially, the suite of clusters spans a large range of ages for a small range in composition. Three principal episodes of Li depletion are recognized: (i) depletion through destruction of Li at the base of the convective envelope of the pre-main-sequence (PMS) star; (ii) continued depletion by destruction in the MS phase; and (iii) depletion by a combination of diffusion and destruction in F-type MS stars in the narrow effective temperature range of about 6400–6900 K (the so-called Li-dip). Sestito & Randich (2005) assemble Li abundance data for 20 open clusters with ages from 5 Myr to 8 Gyr to confront theories for Li depletion with observations.
The cluster α Per was among the sample of 20 clusters with Li observations drawn from Balachandran, Lambert & Stauffer (1988, 1996, hereinafter BLS) and Randich et al. (1998). In this paper, we obtain and analyse high-resolution spectra from which Li abundances are obtained for about 50 stars. When the BLS and this new sample are combined in a uniform manner and a reconsideration is made of the cluster membership of the stars, Li abundances are provided for 70 cluster members.
Observations of Li in α Per were made initially by Boesgaard, Budge & Ramsay (1988) who analysed high-resolution spectra of six F-type stars to show that the Li-dip (Boesgaard & Tripicco 1986) has not yet developed in this young (age of about 50 Myr) cluster. Our principal goal was not to define the run of Li abundance along the MS, because that is already well known for F-, G- and K-type stars (BLS; Boesgaard et al. 1988; Randich et al. 1998) and M-type stars (García López, Rebolo & Martín 1994; Zapatero Osorio et al. 1996). Rather we sought to determine if the Li abundance at a given effective temperature has an intrinsic scatter.
Such a star-to-star variation in apparent Li abundances has been reported for the Pleiades, a cluster only slightly older than α Per (Butler et al. 1987; Soderblom et al. 1993; King, Krishnamurthi & Pinsonneault 2000). This variation appears for stars with effective temperatures less than about 5300 K and extends to the useful limit of the sample at about 4000 K. The peak-to-peak variation is about 1.5 dex in apparent Li abundance. Stars with the stronger Li i 6707 Å feature at a given temperature have higher projected rotational velocities (v sin i). The debate is ongoing as to whether the variation in Li i line strength in the Pleiades and other clusters reflects a real abundance difference or differences in atmospheric structure not modelled by classical atmospheres.
Randich et al. (1998) studied Li abundances in 18 very active, X-ray-selected members of α Per enlarging the original sample of BLS in the 5500–3900 K range of effective temperature and suggested that, at Teff≤ 5300 K, there was indeed a significant dispersion in Li abundances in stars at the same temperature. They further suggested that rapid rotators had more Li and exhibited a smaller dispersion than slow rotators at the same Teff. They inferred from these observations a likely relationship between Li, chromospheric activity and the rotational history of stars.
Examination of BLS's Li observations as re-analysed by Randich et al. (1998) led Xiong & Deng (2005) to suggest that star-to-star variations were also present among α Per members at effective temperatures of about 4700 K and that the variations primarily arose from atmospheric effects and not a real abundance variation. With our larger sample of cluster members, we re-examine the question of star-to-star variation in Li abundance.
In Section 2, we discuss a selection of the newly observed stars. In Section 3, we describe the new high-resolution spectra of α Per stars. Section 4 presents the stellar parameters with emphasis on the effective temperature. The abundance analysis is introduced in Section 5. The run of Li abundance with an effective temperature and the star-to-star variations are discussed in Section 6. This paper concludes with general remarks in Section 7.
2 CONSTRUCTION OF THE FINAL SAMPLE
In referring to members of the cluster, we follow the convention of ‘WEBDA’, a website devoted to stellar clusters.1Heckmann, Dieckvoss & Kox (1956) and Heckmann & Lübeck (1958) introduced a numbering scheme preceded by the letters ‘He’. Later, Stauffer, Hartmann & Jones (1985, 1989a) and Prosser (1992) identified fainter stars with the letters ‘Ap’. In WEBDA, the label He is replaced by #, thus He 12 becomes #12. In the case of the Ap stars, the numbering is increased by 1500 and Ap replaced by #, thus Ap 79 becomes #1579.
When the observations (see below) made for this paper are combined with those reported by BLS, we have spectra for 86 stars. Since our primary goal is to determine whether the run of Li abundance down the MS of the cluster exhibits scatter at a given effective temperature, it is vital to sort cleanly the cluster members from the non-members and also to separate out suitable from unsuitable (i.e. doubled-lined spectroscopic binaries) members.
As long recognized, clean separation of members from non-members is not an easy task for α Per, because it is at low Galactic latitude and has a small relative proper motion. In making the separation, we have called upon a variety of publications that have previously attempted the task. The primary source and the one used in selecting stars for observation was the seminal study of the cluster by Prosser (1992). He considered a variety of membership indicators among which the primary ones were proper motions and radial velocities of the stars.
Makarov (2006) re-analysed the cluster's proper motions using astrometry and photometry from the Tycho-2 Catalogue and the Second USNO CCD Astrometric Catalog (UCAC2). Makarov's table of ‘High-Fidelity’ members lists 139 stars with a V magnitude brighter than about 11.5; no table of non-members is provided. Of the stars in our sample with V < 11.5 and designated as members according to Prosser, all but 10 are among Makarov's high-fidelity members. Four of the 10 stars not listed as members by Makarov are categorized as non-members by Mermilliod, Queloz & Mayor (2008) (see below). It is unclear whether Makarov studied all stars from Prosser's list with V < 11.5, and therefore the absence of a star in Makarov's table is not necessarily an indication that it is not a member. We have included the remaining six stars in our sample in Table 1.
Cluster members, stellar parameters and Li abundance.
| Star # | Teff(V−K) (K) | log g (cm s−2) | ξt (km s−1) | Teff(spec) (K) | Teff(β) (K) | v sin i (km s−1) | Wλ (Li)c (mÅ) | log N(Li) | Membershipa | Notesb | ||
| Pr | Ma | Me | ||||||||||
| 12 | 6663 | 4.5 | 1.5 | 6953 | 49 | 101 | 3.27 | Y | Y | Y | SB? | |
| 56 | 5703 | 4.5 | 0.8 | 5600 | 7 | 69 | 2.35 | Y | Y | … | ||
| 92 | 6683 | 4.5 | 1.5 | 23 | 109 | 3.31 | Y | … | … | |||
| 93 | 5764 | 4.5 | 1.5 | 5880 | 25 | 119 | 2.66 | Y | … | … | ||
| 94 | 5703 | 4.5 | 1.5 | 65 | 225 | 2.94 | Y | Y | … | |||
| 135 | 6903 | 4.5 | 1.5 | 6714 | 16 | 70 | 3.21 | Y | Y | Y | ||
| 174 | 4928 | 4.5 | 1.5 | 5000 | 5319 | 12 | 196 | 2.25 | Y | Y | Y | |
| 270 | 6742 | 4.5 | 1.5 | 6491 | 33 | 96 | 3.24 | Y | Y | Y | SB | |
| 299 | 6036 | 4.5 | 1.3 | 6200 | 15 | 106 | 2.99 | Y | Y | Y | ||
| 309 | 6903 | 4.5 | 1.5 | 6448 | 65 | 62 | 3.15 | Y | Y | … | ||
| 334 | 6511 | 4.5 | 1.7 | 6400 | 7040 | 19 | 105 | 3.23 | Y | Y | Y | |
| 338 | 6606 | 4.5 | 1.5 | 56 | 111 | 3.25 | Y | Y | Y | |||
| 350 | 5673 | 4.5 | 1.5 | 5893 | 42 | 215 | 2.91 | Y | Y | Y | ||
| 361 | 7113 | 4.5 | 1.5 | 6740 | 30 | 59 | 3.18 | Y | Y | Y | ||
| 421 | 6761 | 4.5 | 1.5 | 6935 | 90 | 58 | 3.05 | Y | Y | … | ||
| 490 | 7005 | 4.5 | 1.5 | 6821 | 17 | 76 | 3.31 | Y | Y | Y | ||
| 520 | 5405 | 4.5 | 1.5 | 5468 | 91 | 317 | 2.87 | Y | … | … | ||
| 588 | 6205 | 4.5 | 1.5 | 6532 | 120 | 76 | 2.75 | Y | Y | … | ||
| 621 | 6862 | 4.5 | 1.5 | 6613 | 28 | 76 | 3.25 | Y | Y | Y | ||
| 632 | 7007 | 4.5 | 1.5 | 6632 | 160 | 76 | 3.31 | Y | Y | … | ||
| 660 | 6310 | 4.5 | 1.5 | 38 | 90 | 2.92 | Y? | Y | Y | |||
| 709 | 5873 | 4.5 | 1.5 | 59 | 187 | 3.01 | Y | Y | … | |||
| 750 | 6437 | 4.5 | 1.5 | 26 | 170 | 3.34 | Y | Y | Y | |||
| 767 | 6222 | 4.5 | 1.3 | 6100 | 10 | 139 | 3.27 | Y | Y | Y | ||
| 799 | 7244 | 4.5 | 1.5 | 6622 | 49 | 70 | 3.30 | Y | Y | … | ||
| 828 | 5503 | 4.5 | 1.5 | 12 | 157 | 2.68 | Y | Y | Y | |||
| 833 | 6702 | 4.5 | 1.5 | 6491 | 27 | 144 | 3.46 | Y | … | Y | ||
| 841 | 6530 | 4.5 | 1.5 | 65 | 86 | 3.04 | Y | Y | … | |||
| 917 | 6003 | 4.5 | 1.5 | 5841 | 40 | 191 | 3.11 | Y | … | Y | ||
| 968 | 6474 | 4.5 | 1.5 | 30 | 200 | 3.51 | Y | Y | Y | |||
| 972 | 6455 | 4.5 | 1.5 | 6491 | 87 | 93 | 3.08 | Y | Y | … | ||
| 1086 | 5749 | 4.3 | 1.4 | 5900 | 6122 | 12 | 151 | 2.96 | Y | Y | Y | |
| 1101 | 5540 | 4.5 | 1.5 | 5387 | 35 | 377 | 3.11 | Y | Y | … | ||
| 1180 | 6761 | 4.5 | 1.5 | 6522 | 45 | 99 | 3.32 | Y | Y | Y | ||
| 1185 | 5718 | 4.5 | 1.2 | 6000 | 5669 | 7 | 132 | 2.91 | Y | Y | Y | SB |
| 1514 | 5503 | 4.3 | 1.0 | 5400 | 8 | 187 | 2.94 | Y | … | Y | ||
| 1519 | 5417 | 4.5 | 1.5 | 50 | 293 | 2.81 | Y | Y | … | |||
| 1525 | 5187 | 4.3 | 1.6 | 5300 | 12 | 193 | 2.64 | Y | Y | Y | ||
| 1528 | 4757 | 4.3 | 1.5 | 4900 | 12 | 70 | 1.32 | Y | … | Y | ||
| 1532 | 6419 | 4.5 | 1.5 | 65 | 148 | 3.26 | Y | Y | Y | SB | ||
| 1533 | 4889 | 4.5 | 1.5 | <10 | 143 | 1.79 | Y | … | Y | |||
| 1537 | 5008 | 4.5 | 1.7 | 5200 | 20 | 83 | 1.77 | Y | … | Y | ||
| 1543 | 4695 | 4.5 | 1.5 | 72 | 539 | 2.50 | Y | … | … | |||
| 1551 | 6400 | 4.5 | 1.5 | 65 | 92 | 3.00 | Y | Y | … | |||
| 1556 | 4757 | 4.5 | 1.5 | 110 | 299 | 2.11 | Y | … | … | |||
| 1565 | 4832 | 4.5 | 0.9 | 4800 | 10 | 61 | 1.27 | Y | … | Y | ||
| 1570 | 4908 | 4.3 | 1.9 | 5300 | 7 | 169 | 2.26 | Y | … | Y | ||
| 1572 | 5018 | 4.5 | 1.4 | 5100 | 10 | 110 | 2.03 | Y | … | Y | ||
| 1575 | 4072 | 3.8 | 2.2 | 4900 | 11 | 43 | 0.17 | Y | … | Y | SB | |
| 1578 | 4804 | 4.3 | 2.0 | 5200 | 13 | 162 | 1.94 | Y | … | … | ||
| 1589 | 5381 | 4.3 | 1.0 | 5900 | 8 | 77 | 2.24 | Y | … | Y? | ||
| 1590 | 5970 | 4.5 | 1.5 | 12 | 148 | 3.08 | Y | Y | Y | |||
| 1591 | 4822 | 4.5 | 1.5 | 25 | 232 | 2.22 | Y | … | … | |||
| 1593 | 4785 | 4.5 | 1.5 | 75 | 365 | 2.26 | Y | … | … | |||
| 1597 | 5232 | 4.5 | 1.5 | 10 | 196 | 2.70 | Y | Y | Y | SB | ||
| 1600 | 4315 | 4.5 | 1.5 | 205 | 69 | 0.55 | Y | … | … | |||
| 1601 | 4286 | 4.5 | 1.5 | <10 | 60 | 0.48 | Y | … | Y | |||
| 1604 | 5598 | 3.8 | 1.1 | 5900 | 8 | 45 | 2.06 | Y | … | Y | ||
| 1606 | 4889 | 4.0 | 2.2 | 8 | 158 | 1.90 | Y | … | Y | |||
| 1607 | 4948 | 4.5 | 1.5 | 9 | 129 | 2.00 | Y | … | Y | |||
| 1610 | 5187 | 4.3 | 1.5 | 5200 | 8 | 205 | 2.62 | Y | … | Y | ||
| 1612 | 4405 | 4.5 | 1.5 | 13 | 10 | −0.65 | Y | … | … | |||
| 1614 | 4524 | 4.5 | 1.5 | 12 | 120 | 1.30 | Y | … | Y | |||
| 1617 | 4712 | 4.5 | 1.5 | 83 | 469 | 2.35 | Y | … | … | |||
| 1618 | 5133 | 4.5 | 1.5 | 160 | 307 | 2.51 | Y | … | … | |||
| 1621 | 5405 | 4.3 | 1.3 | 5500 | 10 | 159 | 2.67 | Y | … | Y? | ||
| 1669 | 4557 | 4.0 | 1.6 | 4800 | 8 | 54 | 0.86 | Y | … | Y | ||
| 1697 | 4767 | 4.3 | 1.7 | 5000 | 10 | 78 | 1.49 | Y | … | Y | ||
| 1731 | 4228 | 4.5 | 0.8 | 4500 | 25 | 56 | 0.38 | Y | … | … | ||
| 1735 | 4651 | 4.3 | 2.2 | 4900 | 11 | 24 | 0.34 | Y | … | Y | ||
aPr =Prosser (1992), Ma =Makarov (2006) and Me =Mermilliod et al. (2008).
bAll SB and SB? designations from Mermilliod et al. (2008) except for #727 from Prosser (1992).
cFor stars with v sin i > 25 km s−1, EQWs were not measured but derived from the Li abundance determined from spectrum synthesis.
Mermilliod et al. (2008) undertook a radial velocity programme to check for spectroscopic binaries in the cluster. Their criteria for membership were three-fold: proper motions (from UCAC2), radial velocity and location in the color–magnitude diagram. These criteria were applied independently of Prosser's and Makarov's efforts at membership determination. 54 of our 86 stars were in Mermilliod et al.’s programme. Of these only four were identified as non-members in that program: # 143, 573, 1100 and 1181, with the first two shown to be spectroscopic binaries. We adopt Mermilliod et al.’s view that this quartet are non-members and list these stars in Table 2. Some members were shown to be spectroscopic binaries. Binaries not yet shown to be double-lined are included in the list of 70 members and identified in the final column in Table 1; all seven fall near the MS locus in a color–magnitude diagram, suggesting that the secondary star contributes very little to the composite spectrum.
Non-members, binaries and doubles.
| Star # | Teff(V−K) (K) | log g (cm s−2) | ξt (km s−1) | Teff(sp) (K) | Teff(β) (K) | v sin i (km s−1) | Wλ (Li)c (mÅ) | log N(Li) (mÅ) | Membershipa | Notesb | ||
| Pr | Ma | Me | ||||||||||
| 143 | 5873 | 4.0 | 1.0 | 5700 | 6243 | 10 | 83 | 2.62 | Y | … | N | SB1O (Pr,Me) |
| 407 | 5937 | 28 | 29 | 2.01 | Y | … | … | |||||
| 573 | 6549 | 4.0 | 0.6 | 6600 | 6782 | 12 | <5 | 1.69 | Y | … | N | SB (Me) |
| 715 | 6903 | 6522 | 110 | 104 | 3.41: | Y | Y | … | SB2? (Pr,Ma) | |||
| 848 | 6346 | 4.5 | 1.3 | 6500 | 16 | 95 | 3.15: | Y | Y | Y | SB2O (Pr,Ma,Me) | |
| 935 | 6119 | 56 | 176 | 3.13 | Y | Y | … | Double (Ma) | ||||
| 1100 | 5528 | 4.5 | 0.8 | 5800 | 8 | 59 | 2.06 | Y | … | N | ||
| 1181 | 6205 | 4.0 | 1.1 | 5700 | 6034 | 7 | 58 | 2.72 | Y | … | N | |
| 1234 | 5658 | 4.5 | 1.6 | 6000 | 10 | 90 | 2.56: | Y | Y | Y | SB2 (Me) | |
| 1538 | 5613 | 4.5 | 1.5 | 5700 | 10 | 193 | 2.95 | Y | Y | Y | Double | |
| 1541 | 5288 | 4.3 | 1.5 | 5400 | 8 | 200 | 2.76 | Y | … | Y | Double | |
| 1598 | 4938 | 10 | 199 | 2.30 | Y | … | Y | Double | ||||
| 1602 | 5381 | 4.3 | 1.0 | 5600 | 11 | 141 | 2.56: | Y | Y | Y | SB2 (this work) | |
| 1625 | 5358 | 4.3 | 1.8 | 5700 | 48 | 108 | 2.33: | Y | … | … | SB2 (this work) | |
| 1656 | 5311 | 4.3 | 0.8 | 5600 | 8 | 103 | 2.28: | Y | … | Y | SB2 (Me) | |
| 1713 | 5243 | 4.3 | 0.7 | 5500 | 5 | 18 | 1.04: | Y | … | Y | SB2 (Pr,Me) | |
aPr =Prosser (1992), Ma =Makarov (2006) and Me =Mermilliod et al. (2008).
bClassifications as SB from various sources: Mermilliod et al., Makarov, Prosser and our observations. Double denotes a close binary reported by Patience et al. (2002). #407 is a non-member according to Fresneau (1980) and unusually reddened (Trullols et al. 1989).
cFor stars with v sin i > 25 km s−1, EQWs were not measured but derived from the Li abundance determined from spectrum synthesis.
Patience et al. (2002) report on an imaging search for close binaries among known cluster members; these authors made no independent determinations of membership. A large fraction of our stars was examined by Patience et al. with the majority reported not to have a companion that would have contributed to our spectrum, which we have assumed is that of a single star. Four stars were excluded as unsuitable for analysis on the basis of the reported imaging; these have companions separated by less than 0.5 arcsec and rather similar masses. The stars are # 696 (also known as #1538), 935, 1541 and 1598.
In summary, 70 of the 86 stars are considered to be cluster members (Table 1). Information provided in Table 1 is as follows: the WEBDA # is in column 1, and the adopted stellar parameters are in columns 2, 3 and 4. The projected rotational velocity (v sin i) in column 7 is primarily taken from Prosser (1992). The equivalent width (EQW) of the Li i 6707 Å feature is given for stars with low v sin i in column 8 and the derived Li abundance is given in column 9. Columns 10–12 summarize the membership status of the star as given by Prosser (1992), Makarov (2006) and Mermilliod et al. (2008). The final column identifies the seven stars that are spectroscopic binaries. These seven stars are members and it is assumed that the secondary star is too faint to contribute to the spectrum. They are therefore included with the single stars in Table 1 and in our analyses.
16 stars, originally classified as members by Prosser (1992), have subsequently been identified as non-members, single-lined or double-lined spectroscopic binaries (SB2s), or close double stars. The nature of these stars and the source of the revised information is listed in Table 2, which has the same format as Table 1. The stars are not rejected outright from our sample. Rather, temperatures, rotational velocities and Li and Fe abundances were determined as for the members and the results are discussed with caveats and questions in Sections 6.2 and 6.3.
Our sample of 70 certain members and 16 stars, possibly of questionable status, represents the largest selection to date for which Li abundances are available in α Per.
3 OBSERVATIONS
High-resolution spectra were obtained between 1992 and 1994. Observations were made during 1992 December and 1993 November for 30 stars at the 2.7-m telescope at the W. J. McDonald Observatory with the Robert G. Tull cross-dispersed echelle spectrograph (Tull et al. 1995) at a resolving power of about 60 000 with exposure times chosen to provide a signal-to-noise ratio (S/N) of 100 or higher. In 1994 January, observations were carried out for 21 stars at the 4-m telescope at KPNO with the Casségrain echelle spectrograph, the red long-focus camera and the Tex 2048 × 2048 CCD chip to give a 2-pixel resolution of 0.16 Å (R∼ 40 000). Integration times were chosen to provide an S/N close to 150 for most stars and even higher in a few cases.
Data reduction was carried out following standard iraf procedures.2 The frames were trimmed and overscan corrected. Bias frames were combined and subtracted from the raw spectrum. The spectrum was divided by the normalized flat-field image to account for the pixel-to-pixel sensitivity difference of the detector and then corrected for scattered light. No sky subtraction was done as the sky signal was negligible in all cases.
19 and 24 echelle orders were extracted, respectively, from the McDonald and the KPNO data. The wavelength-scale for all the orders was derived using the Thorium–Argon spectrum. The wavelength-calibrated spectrum was then normalized to a continuum of one.
The measured EQWs of the Li i line at 6707.8 Å are given in Tables 1 and 2 for stars with low projected rotational velocities (v sin i < 25 km s−1). The EQWs include the contribution of the Fe i blend at 6707.435 Å. The contribution of the Fe i blend was removed by the program moog (Sneden 1973) during the derivation of the Li abundance. In the slow rotators (v sin i < 25 km s−1), the uncertainty in the EQW, largely caused by the placement of the continuum, was 2–3 mÅ at ∼15 mÅ, 6 mÅ at ∼130 mÅ and 10 mÅ at ∼200 mÅ. In the spectra of the more rapidly rotating stars in which lines were still measurable, the EQW uncertainty was estimated to be as large as ∼15 mÅ. EQWs were not measured in these stars, rather Li abundances were determined by spectral synthesis, and the EQWs listed in Tables 1 and 2 for stars with v sin i > 25 km s−1 were calculated from the derived abundance using moog (Sneden 1973).
The analysis of the 6707 Å line was done for all the stars with spectrum synthesis fits to the observed spectrum. For the 36 slowly rotating stars for which spectroscopic analysis was possible, the Li abundance was determined in addition from the Li EQW. The match between the two measurements of Li abundance was in excellent agreement.
4 STELLAR PARAMETERS
The Li abundance determined from the 6707-Å feature is primarily sensitive to the adopted effective temperature Teff. An error of ±200 K in Teff results in an uncertainty in log N(Li) between ±0.28 to ±0.14 over the 4500–6500 K temperature range. Thus, we devoted considerable effort to a determination of Teff. The Li abundance is quite insensitive to the adopted surface gravity; a variation in log g of ±0.5 dex results in a change in Li abundance by less than ±0.02 dex. The adopted microturbulence has a small influence on Li, when the 6707-Å feature is strong.
4.1 Effective temperature
The effective temperature is derived from photometry, primarily the (V−K) index, and checked by use of the Strömgren β index and spectroscopy.
4.1.1 Photometry
Our principal photometric indicator of the effective temperature is the (V−K) colour index, which is available for all the stars. All of the observed stars have a Ks magnitude in the 2MASS catalogue.3 The Ks magnitudes were transformed to Johnson K magnitudes by the Koornneef transformations (Carpenter 2001). The V magnitudes were taken from Prosser (1992).
The literature contains various estimates of the reddening affecting the cluster. Several authors refer to a variable reddening across the cluster. Cluster members are slightly reddened, but there is little solid evidence that the reddening is significantly different from star to star. BLS adopted E(B−V) = 0.08 (Mitchell 1960) for all their stars and remarked that Crawford & Barnes (1974) suggested a range from 0.04 to 0.21. BLS note that the extremities of the range correspond to effective temperatures lower by 100 K and hotter by 450 K. Thus, the larger reddenings are a concern in the search for the origin of a scatter in Li abundances.
Inspection of Crawford & Barnes (1974) shows, however, little evidence for a variation in reddening. In their table III, they list measurements of E(b−y) for 21 F-type stars. 15 stars are members and six are non-members according to Makarov (2006). (12 of the 15 members are in Table 1.) The mean E(b−y) for the 15 is 0.054 ± 0.017 with extremes of 0.032 and 0.091. In contrast, larger reddening is seen among non-members with the six non-members exhibiting a range in E(b−y) from 0.023 to 0.148. Crawford & Barnes did note that 18 A-type and 31 B-type cluster members gave higher and similar reddening: 14 A-type stars, members according to Makarov (2006), give a mean E(b−y) = 0.089 ± 0.036 with extreme values of 0.038 and 0.139. The factor of 1.7 between the mean values for the F- and A-type stars points to an issue with the calibration. Possibly, the larger standard error in the A stars may indicate non-uniform colours resulting perhaps from diffusion or metallicity effects. Trullols et al. (1989) provide E(b−y) for 12 F star members: the mean E(b−y) is 0.065 ± 0.012, where the standard error again indicates little if no variation from star to star. Peña & Sareyan (2006) provided Strömgren photometry for cluster stars from a combination of their own measurements and published values and obtained a mean reddening from 169 stars of E(b−y) = 0.073 ± 0.038. However, for the 15 F stars in common, their reddening [E(b−y) = 0.086 ± 0.029] differs from that of Crawford & Barnes, suggesting calibration differences.
Crawford (1975) used the available uvby Hβ photometry for bright stars and cluster members to calibrate Hβ in terms of the intrinsic colour (b−y) and other indices, applicable for β between 2.59 and 2.72. Using this calibration, we made fresh estimates of E(b−y) for 40 stars with the available Stromgren photometry (from WEBDA, which essentially includes the observations of Crawford & Barnes 1974; Trullols et al. 1989) in the above range of β, taking care that the sample contained no binaries or possible non-members. We found that E(b−y) ranged from 0.02 to 0.12, very similar to previous studies, with an average E(b−y) of 0.075 and a standard deviation of the measurements (standard error) of ±0.04. For the normal interstellar reddening law, AV = 0.32, this translates to E(V−K) = 0.284 ± 0.15. The standard error may be used as one estimate of the reddening uncertainty for each star.
Prosser (1992) derived E(V−I) for about 75 M cluster dwarfs from a somewhat unusual process. Low-dispersion spectra provided spectral types, which with a colour–spectra type relation gave the intrinsic (V−I) colour of a star. A comparison of intrinsic and observed (V−I) gave a star's reddening. The mean E(V−I) ≃ 0.18 corresponds to E(b−y) ≃ 0.08 and E(V−K) ≃ 0.3, values consistent with other reddening measures from traditional techniques applied to earlier spectral types. Given that the reddenings are described by Prosser as ‘preliminary values’, one may attach little weight to his suggestion that the reddening is not uniform for cluster members.
Other colour indices might be considered as thermometers. Several previous studies of α Per (and other clusters) have employed (B−V) for which measurements are available for all but five of our stars. However, the V versus (B−V) colour–magnitude diagrams for young clusters are fundamentally different from the V versus (V−I) plots when overlaid by theoretical isochrones. The best-fitting isochrone in the V versus (B−V) diagram for young clusters, such as α Per, follows the observed MS down to the late-K stars, which lie conspicuously to the left of the theoretical MS; they are consistently fainter and bluer. This is seen in the Pleiades and α Per (S. V. Mallik, private communication). Stauffer et al. (2003) first pointed out this blue anomaly in the Pleiades and suggested it may be due to a flux contribution (larger in B than in V) not represented by the model atmospheres. This so-called (B−V) anomaly is predominant in the younger clusters, but is absent in clusters as old as Praesepe: α Per is about 0.05 Gyr to Praesepe's 0.6 Gyr. If this interpretation rather than a more deep-seated deficiency in the models providing the isochrones is correct, the anomaly is likely related to stellar surface activity that decays as stars age. This has two obvious consequences for deriving and interpreting Li abundances. First, (B−V) may be a poorer temperature indicator for the cooler stars than (V−K); the colour–temperature calibration is likely dependent on a star's age, but may also vary from star to star with changes in stellar activity. These dependencies may then provide a star-to-star scatter in Li abundance.
4.1.2 The Strömgren β index
As a reddening-free index, the Strömgren β index is a useful measure of the effective temperature for stars hotter than about 5000 K. Measures of β are taken from Crawford & Barnes (1974) and Trullols et al. (1989). The β versus Teff calibration is taken from Alonso et al. (1986; see also Castelli & Kurucz 2006). Teff(β) is listed in column 6 of Table 1 for 24 cluster members and the comparison Teff(β) versus Teff(V−K) is shown in Fig. 1. Teff(β) is also listed for four stars of questionable status in Table 2 and included in Fig. 1.
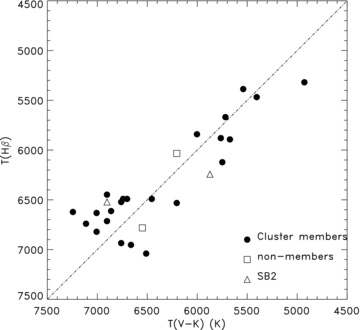
Comparison of the effective temperatures derived from the (V−K) and β indices. The line corresponds to perfect correspondence between the two measurements. The symbols are described in the key.
While there is a good agreement between (V−K) and Hβ temperatures at the cool end of the useful range of the β index, there is a surprisingly larger scatter, at the warm end, with temperature differences as large as 500 K for the same star from the two calibrations. The difference is also surprising, because the two calibrations come from a common paper. We have no leads on whether this difference is due to calibration issues or photometry errors, but we surmise it is unlikely to be caused by variable reddening as it is confined to a small temperature range. The non-members and SB2s lie within the scatter defined by the members.
4.1.3 Spectroscopy
Our spectroscopic temperature is based on the usual condition that the Fe i lines in the observed spectra return the same Fe abundance independent of a line's lower excitation potential. The McDonald spectra provide about 30 Fe i lines spanning about 4 eV in the lower excitation potential. The KPNO spectra with their greater wavelength coverage yield about 130 Fe i lines. These numbers pertain to slowly rotating stars (v sin i≤ 20 km s−1); more rapidly rotating stars have broader lines that lead to blending and a difficulty in measuring EQWs accurately, especially of weak lines. The Teff determination has to be made simultaneously with that for the microturbulence ξt. For this exercise in determining Teff and ξt, we used astrophysical gf-values for Fe i and Fe ii lines. The gf-values were determined using moog (Sneden 1973) with measurements of Fe i and Fe ii EQWs from the high-resolution digital solar atlas (Delbouille, Roland & Neven 1990), the Kurucz solar model atmosphere with no convective overshoot (Castelli, Gratton & Kurucz 1997) and requiring the lines to yield Fe/H = 7.50 at ξt = 0.8 km s−1.
We derived spectroscopic temperatures for 24 cluster members including eight stars observed by BLS for which we were able to retrieve their spectra (Table 1), and for 12 binaries, doubles or non-members (Table 2). The microturbulence and spectroscopic temperatures are listed in columns 4 and 5, respectively. A 100 K change in the effective temperature resulted in a significant non-zero slope of Fe i versus lower excitation potential to allow us to constrain temperatures to ±100 K. Errors in the EQW measurement, gf-values and microturbulence would result in random and systematic temperature errors and we feel that ±200 K conservatively constrains the error in our derived Teff(spec). The ξt is determined to about ±0.1 km s−1.
A comparison of Teff(V−K) and the spectroscopic temperature Teff(spec) is presented in Fig. 2. On average, Teff(V−K) is cooler than Teff(spec) by about 250 K. The temperature difference appears to vanish for the hotter stars, say, T > 6000 K. This level of agreement is consistent with the estimated uncertainty from the analysis of the Fe i lines and lends support to the assertion that reddening is not very variable across the cluster. The visual doubles, the SB2s and three of the four non-member stars lie within the scatter defined by the cluster members. Only #1181 has a much cooler Teff(spec) compared to Teff(V−K).
![Comparison of the effective temperatures derived from the (V−K) index and the Fe i lines [Teff(spec)]. The line corresponds to perfect correspondence between the two measurements. The symbols are described in the key.](https://oup.silverchair-cdn.com/oup/backfile/Content_public/Journal/mnras/410/4/10.1111_j.1365-2966.2010.17630.x/1/m_mnras0410-2526-f2.jpeg?Expires=1750251749&Signature=g2TvWl67b07CvtZF8UmRpr1903v8RxMINpMSam2LDHFvcxd5vfBisSnszzLCMEO6bOLDNYxvY9S-p96raHE4eepHZ~gPN2ui~TfPMnyJoPiQsYhqTaRmHDjB0Xz0P6bPGAz-CtG930E70mYKHMdF5pQGHI1uFQZcsISK~Idr6HmdyVDr7tbzYSh9x-B-5zhmNeh9Q~nixxPtH2YvdQB0niAvLmWrSPC37qo0AT41BsfGf1qwFj75HXE3t~mEnmSXUF3pTBDqMNmdpd5nPllEVrVgpL37ZH1BWwOmCfXIUdwG0SCaU6Yge7VmNE-fewZH-Iedt3kM56z59cJJfpwgxw__&Key-Pair-Id=APKAIE5G5CRDK6RD3PGA)
Comparison of the effective temperatures derived from the (V−K) index and the Fe i lines [Teff(spec)]. The line corresponds to perfect correspondence between the two measurements. The symbols are described in the key.
4.2 Surface gravity
With the inclusion of Fe ii lines in the spectroscopic analysis, it is possible to determine the surface gravity log g. Spectra of 18 stars provide an adequate number of eight to 10 Fe ii lines. A log g determination requires the same Fe abundance from Fe i and Fe ii lines and this is possible to an accuracy of ±0.25 dex. For the stars without a spectroscopically determined log g, we adopt the log g = 4.5 for the Teff determination from the Fe i lines. This value was adopted for all stars without a spectroscopic determination of the surface gravity.
4.3 Microturbulence
The microturbulence is taken either from the analysis of the Fe i lines or a value of 1.5 km s−1 was assumed.
5 ABUNDANCE ANALYSIS
5.1 Lithium abundances
The abundance analysis from which we extract the Li abundance takes the standard form.
Model atmospheres were generated in 100 K intervals in temperature and 0.1 dex intervals in gravity using the program atlas9, written and supplied by R. L. Kurucz. Standard solar opacity distribution functions were used with overshoot turned off (see Castelli et al. 1997). The appropriate model was chosen for each star according to the stellar parameters listed in Tables 1 and 2.
The line analysis program moog (Sneden 1973) was used to convert EQWs of the 6707-Å Li i resonance doublet to an abundance. Throughout the assumption of local thermodynamic equilibrium (LTE) is adopted. The gf-values and wavelengths of the fine- and hyperfine-structure components of the Li i feature were taken from Andersen, Gustafsson & Lambert (1984). The Li abundance was chosen by the best fit of a synthetic spectrum to a region around the 6707-Å feature with the line list adopted by BLS. It is most unlikely that there is any 6Li in stars, where 7Li is even slightly depleted. Therefore, 6Li was included in the line list only for stars with log N(Li) > 3.0.
Li abundances were computed for the model parameters listed in Tables 1 and 2. An error of ±100 K in Teff, ±0.25 dex in log g, ±0.1 km s−1 in ξt and 5 mÅ in Li i EQW results in Li abundance errors of ±0.1, ±0.01, ±0.00 and ±0.09, respectively. As these estimates show, the two principal sources of uncertainty affecting the derived Li abundances arise from the effective temperature and the measured EQW. The effect of a 200-K spread in effective temperature is shown in Fig. 3 by the shaded area at the bottom of the figure. At the lowest temperatures, where the stars of the same effective temperature can show Li lines of quite different strengths, the uncertainty in measurement of the EQW may have a larger effect on the derived abundance than the temperature uncertainty, especially for those few stars where the Li line is weak. The reddening uncertainty estimated from Hβ increases the temperature error over 200 K only at the hottest temperatures; the uncertainty in E(V−K) of 0.15 translates to a temperature uncertainty of 325 K at 6600 K. This uncertainty would merely increase the Li abundance uncertainty at 6600 K to roughly the same magnitude as in the cooler stars (Fig. 3), and would not affect the discussion on Li abundance dispersion that follows in Section 6. In the temperature and gravity range of our sample, non-LTE corrections to the Li abundance are estimated to be small (Carlsson et al. 1994); non-LTE corrections would lower the LTE abundances by 0.019 at the cool end of our sample and by 0.009 dex at the hot end. Again, not incorporating these relatively small corrections would not affect our discussion on the dispersion in Li abundance that follows.
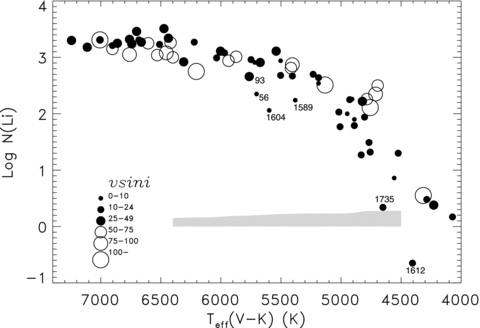
The effective temperature versus Li abundance relation for α Per. The projected rotational velocity (v sin i) of the stars is represented as in the legend. The shaded strip at the bottom of the figure shows the Li abundance spread resulting from an effective temperature uncertainty of 200 K. Several stars are labelled by the membership number for easy reference.
Li abundances for the single-lined binaries in Table 1 and the non-members and double stars in Table 2 were determined as for the single stars. The Li abundances of non-members should have the same accuracy as the remainder of our sample and the Li abundance errors on the doubles is unknown. However, if a cool companion lowers the temperature estimated for single-lined and double-lined binaries, those Li abundances will be proportionately lowered. In addition, double-lined binaries may have weaker Fe i and Li i lines due to continuum dilution. We have therefore marked the Li abundances of the SB2s as uncertain in Table 2. If anything, the Li abundances of these stars are likely to be larger than our estimates. A stronger Li i line may result if a neighbouring feature line from the companion falls on the Li i line, but we have measured the wavelength separation of the two components and are certain that the Li i feature is not contaminated in any of our SB2s.
5.2 Iron abundance
Iron abundances were determined for 25 cluster members (Table 3). The typical measurement uncertainty in the EQW of a 40–60 mÅ Fe i line is ±5 mÅ. An error of ±100 K in Teff, ±0.25 dex in log g, ±0.1 km s−1 in ξt and ±5 mÅ in Fe i EQW results in Fe abundance errors of ±0.07, ±0.02, ±0.02 and ± 0.05, respectively. When these uncertainties are combined, the resulting error in the Fe abundance is ±0.09.
Iron abundances.
| Star # | Teff (K) | Model log g (cm s−2) | ξt (km s−1) | [Fe/H] | Notesa |
| Cluster members | |||||
| 56 | 5600 | 4.5 | 0.8 | +0.06 | |
| 174 | 5000 | 4.3 | 2.0 | −0.25 | |
| 299 | 6200 | 4.5 | 1.3 | 0.00 | |
| 334 | 6400 | 4.5 | 1.7 | −0.18 | |
| 767 | 6100 | 4.5 | 1.3 | +0.03 | |
| 1086 | 5900 | 4.3 | 1.4 | −0.12 | |
| 1185 | 6000 | 4.5 | 1.2 | −0.03 | SB |
| 1514 | 5400 | 4.3 | 1.0 | −0.18 | |
| 1525 | 5300 | 4.3 | 1.6 | −0.15 | |
| 1528 | 4900 | 4.3 | 1.5 | −0.03 | |
| 1537 | 5200 | 4.5 | 1.7 | −0.08 | |
| 1538 | 5700 | 4.5 | 1.5 | −0.03 | |
| 1565 | 4800 | 4.5 | 0.9 | −0.02 | |
| 1570 | 5300 | 4.3 | 1.9 | −0.07 | |
| 1572 | 5100 | 4.5 | 1.4 | −0.05 | |
| 1575 | 4900 | 3.8 | 2.2 | −0.26 | SB |
| 1578 | 5200 | 4.3 | 2.0 | −0.06 | |
| 1604 | 5900 | 3.8 | 1.1 | −0.09 | |
| 1606 | 4800 | 4.0 | 2.2 | −0.14 | |
| 1610 | 5200 | 4.3 | 1.5 | −0.15 | |
| 1621 | 5500 | 4.3 | 1.3 | −0.04 | |
| 1669 | 4800 | 4.0 | 1.6 | −0.19 | |
| 1697 | 5000 | 4.3 | 1.7 | −0.14 | |
| 1731 | 4500 | 4.5 | 0.8 | −0.13 | |
| 1735 | 4900 | 4.3 | 2.2 | −0.13 | |
| Non-members and binaries | |||||
| 143 | 5700 | 4.0 | 1.0 | −0.19 | NM, SB1O |
| 573 | 6600 | 4.0 | 0.6 | −0.23 | NM, SB |
| 848 | 6500 | 4.5 | 1.3 | −0.10 | SB2O |
| 1100 | 5800 | 4.5 | 0.8 | +0.09 | NM |
| 1181 | 5700 | 4.0 | 1.1 | −0.19 | NM |
| 1234 | 6000 | 4.5 | 1.6 | +0.18 | SB2 |
| 1538 | 5700 | 4.5 | 1.5 | −0.04 | Double |
| 1541 | 5400 | 4.3 | 1.5 | −0.10 | Double |
| 1602 | 5600 | 4.3 | 1.0 | −0.26 | SB2 |
| 1625 | 5700 | 4.3 | 1.8 | −0.33 | SB2 |
| 1656 | 5600 | 4.3 | 0.8 | −0.33 | SB2 |
| 1713 | 5500 | 4.3 | 0.7 | +0.02 | SB2 |
The mean Fe abundance is 7.40 ± 0.08 dex where this standard error is comparable to the estimate of the precision of a single determination. There may be a slight decrease in the derived Fe abundance with decreasing temperature; stars with Teff > 5500 K give a mean that is 0.09 dex higher than stars with Teff < 5500 K. A similar suggestion of a temperature dependence was made by BLS. Since our Fe abundance is based on astrophysical gf-values for Fe i and Fe ii lines and is derived using the solar abundance of log N(Fe) = 7.50, the mean Fe abundance may be quoted as [Fe/H]=−0.10, with [Fe/H]=−0.04 for Teff > 5500 K and [Fe/H]=−0.13 for stars with Teff < 5500 K. BLS obtained a mean Fe abundance about 0.13 dex higher with astrophysical gf-values calculated from the empirical Holweger & Müller (1974) and a microturbulence of 1.2 km s−1. Our result is in good agreement with Boesgaard & Friel's (1990) spectroscopic determination by an essentially equivalent technique, including the use of the Kurucz grid, though with fewer (15) Fe i lines. They obtained [Fe/H]=−0.054 ± 0.046 from six stars with Teff from 6415 to 7285 K; our result from four stars hotter than 6000 K is [Fe/H]=−0.04 ± 0.08.
Also listed in Table 3 are the Fe abundances of the non-members, visual doubles and binaries from Table 2 for which spectroscopic analysis was possible. The mean Fe abundance of the four non-members is [Fe/H]=−0.13 ± 0.15, of the two double stars is [Fe/H]=−0.07±0.04, and of the six double-lined spectroscopic binaries is [Fe/H]=−0.14 ± 0.21. The mean Fe abundances are not very different from that of the cluster members; the standard errors are slightly larger than for the cluster mean.
6 THE LITHIUM ABUNDANCE VERSUS TEMPERATURE RELATION
The general nature of the relation between the Li abundance and effective temperature was discussed previously by BLS and Randich et al. (1998).
In Fig. 3, we show the Li versus Teff(V−K) relation for the 70 stars in Table 1, where the symbol's size reflects v sin i as depicted in the legend on the figure. The shaded region at the bottom of the figure displays the effect of a correction to Teff of 200 K across the range from 6400 to 4500 K.
6.1 The hot stars
The Li versus Teff(V−K) relation asymptotically approaches a constant abundance at the high-temperature end. In analysing this approach, we calculate mean abundances in four temperature bins for stars hotter than 6250 K (Table 4). Each bin has roughly the same number of stars, and the mean Li abundance in the four bins is essentially the same within the errors. In the three hottest bins, the dispersion within each bin can be easily accounted for by a combination of temperature errors (±200 K corresponds to ±0.14 dex), S/N of the spectra and small reddening variations. Whether the slightly larger dispersion is the coolest of the four bins is significant cannot be determined from our relatively small sample size. Within our errors, there appears to be no dispersion in the Li distribution or significant change in the mean Li value of these hottest stars.
Mean Li abundances and dispersions in temperature bins.
| Teff range (K) | Mean log N(Li) | Nstars |
| Hot stars | ||
| >7000 | 3.28 ± 0.06 | 4 |
| 6750–7000 | 3.20 ± 0.10 | 5 |
| 6500–6750 | 3.25 ± 0.12 | 7 |
| 6250–6500 | 3.19 ± 0.22 | 6 |
| Middle third | ||
| 6000–6250 | 3.09 ± 0.13 | 4 |
| 5750–6000 | 2.97 ± 0.23 | 3 |
| 5500–5750 | 2.72 ± 0.34 | 9 |
Within these stars, there is an indication from Fig. 3 that the most massive rapidly rotating stars [at Teff(V−K) > 6400 K] have a slightly lower Li abundance than the slow rotators. Taken as a whole, the results in Fig. 3 may suggest that the rapidly rotating stars provide a relation with a shallower slope for Teff > 5500 K than the slowly rotating stars.
The Li abundance in the hottest stars is equal to the meteoritic value [log N(Li) = 3.25 ± 0.06 according to Grevesse, Asplund & Sauval 2007]. It is this value that has often been taken as a fair representation of the initial value for young open clusters, like α Per. Some authors also quote a very similar Li abundance derived from T Tauri stars (see e.g. Magazzu, Rebolo & Pavlenko 1992; Martín et al. 1994). These two data points suggest that the local value of the Galactic Li abundance has changed little in the last 4.5 Gyr.
6.2 The middle third
Three temperature bins define the middle third of the sample between 5500 and 6250 K (Table 4). The mean Li trend declines by 0.5 dex in this range. The dispersion in Li appears to be larger than can be accounted for by the uncertainties in the stellar parameters and the S/N of our spectra. In order to understand this dispersion, we examined four cluster members, #1589, #1604, #56 and #93, with Teff between 5400 and 5750 K. These appear to be outliers to what would otherwise be a fairly narrow mean Li trend similar to that seen in the hotter stars; in the absence of these stars, the decline in the mean Li trend between 6250 and 5500 K would be 0.3 dex and the dispersion in the coolest bin be only ±0.13.
It is worth noting that these four stars have much lower Li EQWs compared to other stars in the same temperature range. We therefore begin by examining three possible explanations for these outliers: (i) their assigned effective temperature is in error; (ii) the stars are non-members that have experienced normal Li depletion for their age; (iii) the dispersion in Li is not real but a reflection of differences in chromospheric activity levels, which affect the formation of the Li i line and thereby the EQWs of the line; and (iv) an unusual amount of Li depletion has occurred in these cluster members. We comment on each of these in turn.
Errors in the estimated temperatures appear to be the least likely cause of the outlier stars. An increase in the effective temperature would increase the estimated Li abundance of the outlier, but as the mean Li trend increases with increasing temperature, the required temperature increase is larger than that indicated simply by the temperature difference between the outlier abundance and the mean trend at that temperature. Consider the case of #1589, which is about 0.4 dex below the mean relation. A 500-K increase in effective temperature eliminates this deficit but at the new temperature of 5900 K, the star remains about 0.3 dex below the mean relation. A similar problem arises if the effective temperature is lowered. The temperature change required to meet the mean Li trend is even larger in #56 and it cannot be reconciled with the errors we have derived for our estimated temperatures. For example, the estimated temperatures of #56, Teff(spec) = 5600 K and Teff(V−K) = 5703 K are in good agreement and we see no reason to consider them to be in error by 700 K or larger. The other outliers would require similar and unacceptably large increases or decreases in temperature to put them on the mean Li trend. An added constraint against such a large increase in temperature is the measured Fe abundance. The 700-K increase in the effective temperature required for #56 would increase [Fe/H] from the measured value of +0.06 to an extraordinarily high value of +0.42. Similarly, #1604 has a measured metallicity of [Fe/H]=−0.09, consistent with the cluster mean, and the even larger increase in effective temperature increase would result in an unbelievable Fe abundance. An explanation for the quartet in terms of an error in their effective temperatures is therefore not credible.
Possibly, these outliers are not in fact cluster members. In the case of #56, Prosser (1992) assigned it a questionable status as a member on the basis of its radial velocity but full status on the basis of proper motion. If #56 is an interloper star with normal Li depletion for its age, it should be roughly the age of the Hyades cluster (600 Myr) (Boesgaard & Tripicco 1986; Boesgaard & Budge 1988; Thorburn et al. 1993). Similarly, at roughly the same temperature, #1604 with a slightly lower Li abundance would be a somewhat older star. However, neither #56 nor #1604 could be as old as NGC 752 (2.4 Gyr) or M67 (4.5 Gyr), because by that age solar-temperature stars have Li abundances of log N(Li) = 1.5 or lower (see Balachandran 1995 and references therein). The likelihood of Hyades-age interlopers in the field of view of the α Per cluster and at the distance of the α Per cluster is small. Although Prosser (1992) assigned cluster membership to #93 without a radial velocity measurement, the moderate rotational velocity of the star (v sin i = 25 km s−1) increases the likelihood that it is a young star and therefore a cluster member; G stars are observed to have spun down by the age of the Pleiades (Stauffer et al. 1984). As noted in Table 1, Mermilliod et al. (2008) questioned the cluster membership of #1589. The relatively high Li abundance [log N(Li) = 2.24] relative to field stars at the same temperature suggests that the star is young; the abundance of Li is of the order of log N(Li) = 1.0 at 5300 K even in a cluster as young as the Hyades. Therefore, even if the quartet are rejected as members on this flimsy evidence, it is obviously no simple matter to account for their Li abundance as field stars.
The effect of chromospheric activity, in particular, surface inhomogeneities in the form of spots and plages, on the formation of the Li i line, and the subsequent effect on the EQW of the line has been the focus of several studies (Randich 2001; Hünsch et al. 2004; King & Schuler 2004; Xiong & Deng 2006; King et al. 2010). Typically, the K i resonance line that is formed in the same part of the atmosphere as Li i is measured for comparison. Although a spread in K i EQWs has been observed in stars of the same temperature in the Pleiades (Jeffries 1999) and IC 2602 (Randich 2001), the authors state that while there is a need to understand K i differences, there is no conclusive evidence that the spread in Li abundances in these young clusters can be attributed to differences in chromospheric activity alone. In a recent study of the high-resolution spectra of 17 cool Pleiades dwarfs, King et al. (2010) found that the Li i line strengths had a larger scatter than the K iλ 7699 Å line strengths. They concluded that there must be a true abundance component to the Pleiades Li dispersion and suggested that it may be due to differences in PMS Li burning caused by the effects of surface activity on stellar structure. Here we add a few nuggets to that discussion. Our KPNO spectra contain the 7699 Å K i resonance line at the edge of one of the echelle orders. We were able to measure this K i feature in 14 stars. The data show the expected increase in EQW with decreasing temperature, but the sparsity of the data precludes a detailed analysis. In addition to the two outliers, #1604 and #1589, we were able to measure the K i EQWs of two normal stars at the same temperature, #1086 and #1185. The data are shown in Table 5. There are two findings of relevance. First, while the Li i EQW of #1604 is a factor of 3 smaller than that of #1086 and #1185, the K i EQWs of all three stars are within about 15 per cent of each other. Secondly, comparing the K i lines in the two stars with low Li, #1589 and #1604, we find the ratio of their K i EQWs is 1.6, perhaps reflecting the lower Teff(V−K) of #1589. The Li i EQW ratio of the two stars is 1.7 and mirrors the K i EQW ratio. Thus, we are able to discern no reason to attribute the low Li abundances to #1589 and #1604 to the effects of chromospheric activity.
Comparison of K i and Li i data.
| Star # | Teff(V−K) (K) | Teff(spec) (K) | Wλ (K i) (mÅ) | Wλ (Li i) (mÅ) | log N(Li) |
| Warm stars | |||||
| 1086 | 5750 | 5900 | 192 | 151 | 2.96 |
| 1185 | 5718 | 6000 | 194 | 132 | 2.91 |
| 1589 | 5381 | 5900 | 350 | 77 | 2.24 |
| 1604 | 5600 | 5900 | 221 | 45 | 2.06 |
| Cool stars | |||||
| 174 | 4928 | 5000 | 308 | 196 | 2.25 |
| 1697 | 4767 | 5000 | 391 | 78 | 1.49 |
Since a convincing case cannot be made for either explanation (i), (ii) or (iii), the so-called outliers must be accepted as cluster members with an above-average depletion of Li. With their inclusion as members, we conclude that a dispersion in Li is clearly present between 5500 and 5750 K and, as will be discussed in the next subsection; this dispersion persists at cooler temperatures.
6.3 The cool stars
Stars cooler than about 5500 K appear to fall in a widening band of declining Li with decreasing temperature (Fig. 3). There seems to be a lower envelope, defined by low v sin i stars, running from a Li abundance of about log N(Li) = 2.5 at 5500 K to log N(Li) =−0.4 at 4500 K, and an upper envelope running through high v sin i stars with a Li abundance of around log N(Li) = 3.0 at 5500 K and then falling to a Li abundance of log N(Li) = 0.0 at 4200 K. The width of the band at temperatures less than 4700 K is about 1.5 dex, a width resembling that for the Pleiades, a cluster about 20–30 Myr older than α Per (Soderblom et al. 1993; Sestito & Randich 2005). Xiong & Deng (2005) in a discussion on the Li abundances provided by the BLS sample drew attention to a scatter appearing around the colour index (V−IC) = 1.03 or about 4700 K. This was about the cool end of BLS's sample. Our expanded sample shows that the scatter begins at a somewhat warmer temperature around 5600 K and extends to cooler temperatures.
The Li distribution band is sketched in Fig. 4. Accepting the outliers discussed in the previous section as members, the Li distribution band in the cooler stars can be extended to warmer temperatures with the upper and lower bands asymptoting to the Li plateau value at 7000 K. The dispersion in Li may begin at 6500 K, though additional stars are required to define this spread, and gradually widen in the cooler stars.
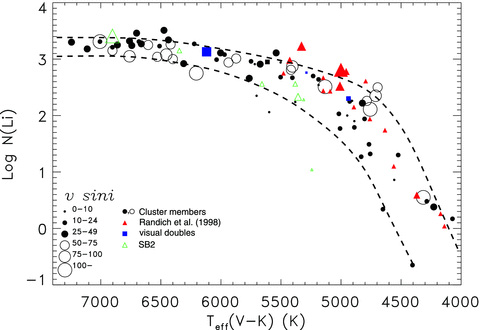
The Li abundance versus effective temperature relation for α Per (as in Fig. 3). The red triangles are data added from Randich et al. (1998) with larger symbols for faster rotators. The blue squares and green triangles are visual doubles and spectroscopic binaries from our sample. Suggested upper and lower envelopes to the relation are indicated as dashed curves.
Randich et al. (1998) provided Li abundances for 18 X-ray-selected members of the cluster. An additional five stars were analysed but declared to be non-members. The spectra were at a resolution of 1Å, but lines blended with the Li i doublet were taken into account in the analysis. The adopted Teff scale is in good agreement with ours. A comparison between their and our temperatures for the BLS sample indicates a mean difference (Us−Them) of only 6 ± 67 K when two wildly discrepant stars are excluded. This suggests that we may add these X-ray-selected stars to our sample. Furthermore, we note that one star –#1601 (AP101) – is a common star: we find log N(Li) = 0.48 and Randich et al. give 0.68, an unimportant difference, given the spread at the 4300 K temperature of the star. In Fig. 4, abundances from Randich et al. are included along with ours and lines drawn to represent the possible upper and lower envelopes to the Li abundance variation with effective temperature. These additional stars at Teff < 5000 K tend to populate the upper half of the band between our suggested upper and lower envelopes. Unfortunately, the new points provide few high v sin i objects.
Scatter at temperatures below about 5500 K cannot be attributed to the standard sources of uncertainty (incorrect effective temperature, uncertainties in measuring the 6707-Å feature, contamination of the sample by non-members, etc.). Several ideas have been suggested linking the Li abundance scatter at least in part to the failure of classical model atmospheres (as used here) to represent the real atmospheres of these young late-type dwarfs. In Section 6.2, we discussed our K i data for four stars around 5900 K. Our data include K i EQWs for two additional stars at 5000 K, #174 and #1697, both bona fide cluster members (Table 5). These data also do not provide any support for a link between high Li abundance and chromospheric activity. Rather the larger K i EQW corresponds to the star with the smaller Li abundance.
6.4 Doubles, binaries and non-members
In Fig. 4, the stars designated as double stars and double-lined spectroscopic binaries in Table 2 are shown by symbols of different colours as indicated in the legend accompanying the figure.
The four double stars with separations of 0.5 arcsec or less lie well within the Li distribution band of the normal stars. The spectra of these stars appear to not have been significantly contaminated by the presence of the nearby star and future analyses may simply include them as member stars.
With the exception of #1713, the double-lined spectroscopic binaries (green triangles) also lie well within the Li band of the cluster members. Their measured Li abundances may be regarded as lower limits to the value that would be obtained, if the continuum contamination of the secondary was properly accounted for. Any further interpretation of their abundances would require a rigorous analysis that takes into account the continuum and line spectrum of both stars.
Surprisingly, three of the four stars identified as non-members by Mermilliod et al. (2008): #143, #1181 and #1100, have Li abundances that are entirely compatible with the mean cluster trend. The star #1181 is coincident with #588, a rapidly rotating cluster member, #143 lies on the lower Li envelope of the cluster and #1100 is in the proximity of #1604, the outlier star that we found no reason to exclude from the sample. The three stars were deemed to be non-members by Mermilliod et al. (2008) on the basis of their radial velocity and proper motion alone; all three lie on the cluster's colour–magnitude diagram and are therefore at the distance of the cluster. This combination of facts makes the three stars rather enigmatic. The relatively large Li abundances of these stars compared to field stars would make them not much older than a few hundred Myr; the likelihood of relatively young interloper stars in the field of view of the cluster and at the distance of the cluster must be rather small.
The two remaining stars identified as non-members, #573 and #407, may be field stars. The former appears to lie in the region of the Li-dip and the latter has a low enough Li abundance to be consistent with field star values (Chen et al. 2001). We note, however, that #407 has a rather large rotational velocity (v sin i = 28 km s−1), which is unusual in a field G star. In summary, all of the five stars categorized as non-members may warrant closer scrutiny.
7 CONCLUDING REMARKS
In the Introduction, we referred to the powerful role that is played by open clusters in placing observational constraints on Li depletion in PMS and MS stars. Perhaps, the principal outstanding questions about Li depletion concern the onset of the depletion and the star-to-star spread in (apparent) Li abundances at low masses. (There remains too the incompletely understood Li-dip in warm older stars.) In order to determine when Li depletion at low masses develops, and how it evolves with time, depletion of Li must be traced from the earliest phases to the age of the α Per cluster and beyond.
PMS Li depletion is now mappable by looking at the very youngest of clusters and associations; the stars are faint but accessible with large telescopes. In addition to the uncertainty of defining membership in clusters, associations and moving groups, there are several problems associated with interpreting their Li abundance trends. First, since young PMS stars of different masses tend to lie in the same temperature range between 3000–4000 K as they evolve down the Hertzsprung–Russell diagram, and older PMS stars rapidly increase their temperature as they evolve towards the MS, the temperature of the PMS star is not a sufficient indication of its mass, and determination of stellar mass requires the use of theoretical evolutionary tracks, which continue to differ from author to author. This difficulty may be offset partly by the result that theoretical prediction of a cluster's age from the location of the Li depletion boundary (LDB) is not very dependent on which set of PMS evolutionary tracks are chosen (Jeffries & Oliviera 2005). Secondly, because the young PMS stars are cool, analysis of their spectra is complicated by molecular features, and the derived Li abundance has a larger uncertainty than in warmer MS stars.
For these reasons and because the available data are limited with respect both to the number of young clusters, associations and moving groups, and to the number of stars per cluster, we defer a detailed search for the onset of Li depletion at low masses. It is worth noting that an interesting set of Li data in a range of young clusters and associations has been accumulated (e.g. Sestito & Randich 2005; Mentuch et al. 2008). In their table 1, Sestito & Randich (2005) list the ‘classical’ ages of clusters, that is, those determined from isochrone fitting. For four young clusters in their sample, IC 2391, NGC 2547, α Per and the Pleiades, new independent estimates of the ages have been obtained based on the position of LDB (Stauffer, Schultz & Kirkpatrick 1998; Stauffer et al. 1999; Barrado y Navascués, Stauffer & Jayawardhana 2004; Jeffries & Oliviera 2005), which are, in general, higher than the classical ages. Although the LDB technique is less model-dependent than MS fitting, Sestito & Randich chose to adopt the classical ages for uniformity through the entire sample. In our discussion of clusters chosen from Sestito & Randich (2005), including α Per and the Pleiades, we have adopted these same classical ages.
On the other hand, the ages of the young associations studied by Mentuch et al. (2008), that we compare the results of α Per and the Pleiades to, are derived by comparing the dependence of Li abundance on temperature with isochrones from PMS evolutionary tracks. Mentuch et al. state that these ages are consistent with the earlier estimates based on isochrone fitting or other methods. We will not analyse the strengths and weaknesses of cluster age determinations in our discussions. Rather, we note that the crucial point is that the ordering of the clusters according to age is robust. When comparing the results of Li scatter in these young associations with those of clusters from Sestito & Randich (2005) with classical ages, the chronological order of ages is not disturbed even if we adopt the higher LDB ages for the four young clusters, namely NGC 2547, IC 2391, α Per and the Pleiades. It is therefore worth examining the star samples of these associations with those of α Per and other clusters.
Sestito & Randich list NGC 2264 at 5 Myr as their youngest cluster with the survey of Li abundances from Soderblom et al. (1999). The Li abundance for the warmer stars in NGC 2264 is about 3.2, a value consistent with our result for the hotter stars in α Per and also with the canonical value for an initial Li abundance for young stars. Stars between 0.5 and 1.0 M⊙ in NGC 2264 show only a mild (0.4 dex) Li dispersion. Given measurement and analyses uncertainties, one may conclude that PMS depletion has possibly not begun in these young stars. Mild PMS depletion may be seen in the 12-Myr-old ηCha cluster and TW Hydrae association (Mentuch et al. 2008). By 20 Myr, the β Pic moving group and by 27 Myr the Tucanae–Horologium association show nearly a 3.0 dex range in Li abundance (see fig. 8 in Mentuch et al. 2008). However, in the absence of reliable mass determinations, the presence or absence of an abundance dispersion at a particular mass cannot be deciphered.
A clearer view of Li dispersion at a particular mass may be obtained once the cluster is on the MS. Sestito & Randich (2005) list IC 2602, IC 2391, IC 4665 and NGC 2547 as MS clusters younger than α Per. Impression of a smaller star-to-star scatter in Li abundances in clusters younger than α Per is conveyed by results for IC 2602 with an age of 30 Myr (Randich et al. 1997, 2001). Randich et al. (2001) define a regression curve to represent Li abundances from 3900 to 6900 K. This curve is above the upper envelope in Fig. 4 for Teff < 4400 K and coincident with it for higher temperatures. To effect a fair comparison, a correction would need to be made for the mass-dependent temperature change between an age of 30 and 50 Myr. Little additional Li depletion is predicted in this interval. The point of interest here is that the scatter about the regression curve is at most ±0.5 dex, often much less, and less than exhibited in Fig. 3. Indeed, most points in the equivalent plot to Fig. 3 (Randich et al.'s fig. 4) touch the regression curve with their error bars. A similar conclusion applies to IC 2391, also 30 Myr old, from an inspection of the same fig. 4, which assembles Li abundances from that paper and Stauffer et al. (1989b). For IC 4665 at 35 Myr, the available Li abundances (Martín & Montes 1997; Jeffries et al. 2009) are too few at low temperatures to define the Li abundance trend with temperature and certainly not to detect a star-to-star variation. For NGC 2547 also at 35 Myr, there is evidence of a variation approaching that seen in Fig. 3 (Jeffries et al. 2003) with a lower envelope to the Li abundances resembling that of the upper envelope in Fig. 4. One may speculate from these comparisons that the dispersion in Li at a given mass develops and strengthens between 30 and 50 Myr, that is, between the ages of IC 2391 and IC 2602 and the age of α Per.
This is further corroborated by observations of the AB Doradus moving group by Mentuch et al. (2008), which has an age of 45 Myr, very similar to that of α Per. With the additional caveats that the sample is small and there are membership issues in defining a moving group, we compare our α Per sample with that of AB Dor. The comparison is frustrated because Mentuch et al. (2008) systematically find an abundance log N(Li) ≃ 3.8 in their samples for stars that are unaffected by PMS depletion. This ‘initial’ value is about 0.6 dex greater than our value for the hotter stars. We have adopted the view that the high initial abundance is a consequence of a systematic overestimate of the Li abundance, but we have no basis for knowing, if this overestimate carries over to lower temperatures. Between 5300–4900 K, four AB Dor stars have Li abundances between 3.4 and 1.3; the range is comparable to that seen in α Per and larger than that seen in the Sestito & Randich (2005) survey. Below 4900 K, five AB Dor stars are coincident with the upper envelope of α Per stars. There may be some indication in this limited sample that AB Dor exhibits a larger Li spread than the slightly younger clusters discussed in Sestito & Randich (2005) but very similar to what is seen in α Per.
For clusters older than α Per, we restrict comparison to the well-sampled Pleiades (age of 70 Myr) where we have taken Pleiades data from Soderblom et al. (1993, see also King et al. 2000). Perhaps, a fairer comparison would be to take data for both clusters from Sestito & Randich (2005) who undertook a uniform analysis of these and other open clusters. The mean relations and their scatter are very similar but for two minor differences when compared in the abundance–effective temperature plane; the evolution in Teff over the 20 Myr age difference is very small and ignored. First, the α Per cool outliers –# 1612 and #1735 – have no counterparts in the Pleiades. Secondly, and more prominently, the Pleiades has four stars with undepleted Li (log N(Li) ≃ 3.2) at Teff≃ 5000 K with no counterparts in α Per, where log N(Li) ≃ 2.5 at this temperature.
In observed clusters older than Pleiades, MS depletion begins to reduce the Li abundances in the coolest stars noticeably. This is certainly apparent for M34 with an age of 250 Myr, where stars have been observed down to about 4200 K (Jones et al. 1997). Here, the star-to-star scatter remains similar to that of the Pleiades and α Per, but the mean abundances are smaller. By the age of the Hyades, only upper limits to the Li i EQW are measurable in stars ≤5000 K (Soderblom et al. 1995).
In summary, the Li abundances for α Per fit the pattern provided by observations of clusters both younger and older than it. The star-to-star spread appears to develop after about 20 Myr. The spread survives up to 250 Myr and its demise is hidden from observers as MS Li depletion removes any inequalities in Li abundance from observers’ view.
An inspection of Figs 3 and 4 shows a relative dearth of measurements at temperatures lower than about 4700 K. Additional members of the α Per cluster are to be found in Prosser (1992). Although expansion of the sample at lower temperatures would be informative, perhaps the most useful benefit from an enlarged sample would be an application of the best techniques of quantitative stellar spectroscopy to pairs of stars with maximum and minimum Li abundance but similar observed properties, such as colour and rotation period. If such a study discovers differences only for Li, then atmospheric effects may truly be eliminated as the cause of the Li dispersion.
iraf is distributed by the National Optical Astronomy Observatories, which are operated by the Association of Universities for Research in Astronomy, Inc., under cooperative agreement with the National Science Foundation.
This research has made use of the WEBDA data base maintained at the Institute for Astronomy of the University of Vienna. This publication makes use of data products from the Two-Micron All-Sky Survey, which is a joint project of the University of Massachusetts and the Infrared Processing and Analysis Center/California Institute of Technology, funded by the National Aeronautics and Space Administration and the National Science Foundation. We thank the referee for several constructive comments on this manuscript. SCB is pleased to acknowledge support from NSF grant AST-0407057. On the eve of her departure from 25 yr of research in Astronomy, SCB would like to thank colleagues and collaborators who have made it a rich and satisfying experience. DLL wishes to thank the Robert A. Welch Foundation of Houston, Texas, for support through grant F-634. The authors would like to thank the referee for helpful remarks that improved this manuscript.
REFERENCES
