


Abstract
We present deep ground based imaging of the environments of five quasi-stellar objects (QSOs) that contain sub-damped Lyman α (sub-DLA) systems at z < 1 with the Southern Observatories Astrophysics Research (SOAR) telescope and SOAR Optical Imager (SOI) camera. We detect a clear surplus of galaxies in these small fields, supporting the assumption that we are detecting the galaxies responsible for the absorption systems. Assuming these galaxies are at the redshift of the absorption line systems, we detect luminous L > L★ galaxies for four of the five fields within 10 arcsec of the QSO. In contrast to previous imaging surveys of DLA systems at these redshifts, which indicate a range of morphological types and luminosities for the host galaxies of the systems, the galaxies we detect in these sub-DLA fields appear to be luminous (L≳L★). In the case of the absorber towards Q1009−0026 at zabs= 0.8866 we have spectroscopic confirmation that the candidate galaxy is at the redshift of the absorber, at an impact parameter of ∼35 kpc with a luminosity of 3 ≲L/L★≲ 8 depending on the magnitude of the K-correction. These observations are in concordance with the view that sub-DLA systems may be more representative of massive galaxies than DLA systems. The environments of the absorbers span a range of types, from the inner disc of a galaxy, the periphery of a luminous galaxy and the outskirts of interacting galaxies. The large impact parameters to some of the candidate galaxies suggest that galactic outflows or tidal tails are likely responsible for the material seen in absorption. We find a weak correlation between NH i and the impact parameter at the 2σ level, which may be expected from the heterogeneous population of galaxies hosting the absorption line systems and random orientation angles. In addition, we detect a possible gravitationally lensed image of the BL-Lac object Q0826−2230.
1 INTRODUCTION
One of the principal manners in which to study high-redshift galaxies is through the use of quasar [quasar-stellar object (QSO)] absorption line systems. These absorption line systems with the largest NH i as measured by the Lyman α λ1215 line are classified into two groups, the sub-damped Lyman α (sub-DLA) systems (19.0 < log NH i < 20.3 cm−2) and DLA systems (log NH i > 20.3 cm−2). Although it is relatively easy to obtain high signal-to-noise ratio (S/N) spectra of QSOs with the large telescopes and sensitive high-resolution spectrographs available today, much of the difficulty in interpreting the data from spectroscopic observations of QSO absorbers is that the environment in which the absorbing gas is residing is almost always unknown. There have been many studies aimed at imaging of DLA systems (e.g. Le Brun et al. 1997; Kulkarni et al. 2000, 2001; Warren et al. 2001; Chen & Lanzetta 2003; Rao et al. 2003; Christensen et al. 2004, 2005; Chen, Kennicutt & Rauch 2005). However, many of these studies have resulted in non-detections, or detections of dwarf or low surface brightness (LSB) galaxies. Higher redshift systems (z > 1) are increasingly difficult to detect, with only ∼10 per cent of the host galaxies of DLA systems identified.
The non-detection of luminous galaxies in most DLA systems searched for, together with the low metallicities and weak metallicity evolution determined via the absorption lines of undepleted elements such as S or Zn in the DLA systems (e.g. Prochaska & Wolfe 2002; Kulkarni et al. 2005; Meiring et al. 2006), suggests that while these objects do contain the majority of neutral gas in the Universe (Wolfe et al. 1995) they may be tracing mainly star formation in lower mass galaxies. Chemical evolution models of dwarf galaxies predict low metallicity that slowly evolves until more recent times (Pagel & Tautvaisiene 1998).
We have recently completed a survey of 31 sub-DLA systems at z < 1.5 using the Magellan Inamori Kyocera Echelle (MIKE) and Ultraviolet Visual Echelle Spectrograph (UVES; Péroux et al. 2006a,b, 2008; Kulkarni et al. 2007; Meiring et al. 2007, 2008, 2009a,b). At odds with the typically low metallicities seen in DLA systems, several of the sub-DLA systems in the sample showed near solar or above solar metallicity (i.e. [Zn/H]≳ 0.0). In fact, a trend towards increasing metallicity with decreasing NH i is seen over three decades in NH i (Khare et al. 2007; Meiring et al. 2009a).
Several possibilities exist to explain such a trend: (1) there is a dust obscuration bias that limits the number of observable metal-rich DLA systems to be observed as the amount of dust increases with metallicity (Boisse et al. 1998; Vladilo & Péroux 2005); (2) the low H i column densities in the sub-DLA regime are a result of conversion of neutral hydrogen into molecular gas, which is forming stars and producing the metals; (3) the lower H i column densities are a result of increased ionization from star-forming regions that produce metals that enrich the surrounding areas and (4) sub-DLA systems are intrinsically more likely to arise in massive galaxies which are typically more metal rich (Khare et al. 2007). In all likelihood, it is possible that all of these effects are at work together to produce the observed trend.
Few sub-DLA systems have been directly imaged to date (Chen et al. 2005; Christensen et al. 2005; Straka et al. 2010). With this in mind, we have started a programme to conduct follow-up imaging of sub-DLA systems at z < 1.0 to determine the nature of these systems. Here, we present deep SOAR imaging of the five QSO fields Q0826−2230, SDSS J1009−0026, SDSS J1228+1018, SDSS J1323−0021 and SDSS J1436−0051. The structure of this paper is as follows: the observations are discussed in Section 2, notes on the individual fields are given in Section 3, results of the observations are given in Section 4 and a discussion is given in Section 5. Spectra of the QSOs showing the absorption lines can be found in Meiring et al. (2007, 2008, 2009b) and Péroux et al. (2006a).
2 OBSERVATIONS AND DATA REDUCTION
2.1 Observations
These data were obtained with the 4.1-m Southern Observatories Astrophysics Research (SOAR) telescope located at Cerro Pachón and the SOAR Optical Imager (SOI) camera during 2009 February and March. Roughly 1.5 nights were lost due to weather during the four-night run. The SOI camera has a pixel scale of ∼0.154 arcsec pixel−1 with 2 × 2 binning, which was used throughout the observations. The two 2000 × 4000 detectors are arranged in a mosaic configuration with an ∼8-arcsec gap between the detectors. The total field of view of this instrument is 5.25 × 5.25 arcmin2.
Each field was observed in some combination of the Sloan Digital Sky Survey (SDSS; York et al. 2000) g, r, i, z filter set. The targets in this investigation were selected mainly due to visibility at the SOAR telescope and the redshift of the absorber, favouring the lower redshift systems in our prior spectroscopic sample to increase the chances of detections. Exposure times in each band and coordinates of the background QSO are given in Table 1. Each exposure was dithered by ∼10 arcsec to fill the gap between the detectors and minimize the effects of bad pixels. Individual exposure times ranged from 300 to 900 s, depending on the magnitude of the background QSO. Series of twilight sky flats were taken at the beginning of each night for each filter and used for the flat-field images.
Table of observations.
| Q0826−2230 | ||||
| zem > 0.911, α = 08 : 26 : 01.5, δ=−22 : 30 : 26.2 | ||||
| g | r | i | z | |
| Integration time (s) | 600 | 3300 | 3000 | 5400 |
| FWHM (arcsec) | 1.0 | 1.0 | 0.7 | 1.25 |
| Limiting magnitude | 24.5 | 25.0 | 25.0 | 23.5 |
| SDSS J1009−0026 | ||||
| zem = 1.241, α = 10 : 09 : 30.40, δ=−00 : 26 : 19.1 | ||||
| g | r | i | z | |
| Integration time (s) | 6900 | 3600 | 5400 | 2700 |
| FWHM (arcsec) | 0.9 | 0.8 | 1.1 | 1.1 |
| Limiting magnitude | 26.0 | 25.5 | 25.0 | 23.5 |
| SDSS J1228+1018 | ||||
| zem = 2.306, α = 12 : 28 : 36.80, δ=+10 : 18 : 41.7 | ||||
| g | r | i | z | |
| Integration time (s) | – | 3600 | 3600 | 8100 |
| FWHM (arcsec) | – | 0.8 | 0.8 | 1.5 |
| Limiting magnitude | – | 25.0 | 24.5 | 23.0 |
| SDSS J1323−0021 | ||||
| zem = 1.388, α = 13 : 23 : 23.78, δ=−00 : 21 : 55.3 | ||||
| g | r | i | z | |
| Integration time (s) | 2100 | 3600 | 4500 | – |
| FWHM (arcsec) | 0.7 | 0.8 | 0.7 | – |
| Limiting magnitude | 25.5 | 25.5 | 25.0 | – |
| SDSS J1436−0051 | ||||
| zem = 1.275, α = 14 : 36 : 45.03, δ=−00 : 51 : 50.6 | ||||
| g | r | i | z | |
| Integration time (s) | 7200 | 3600 | 4800 | 3600 |
| FWHM (arcsec) | 0.8 | 0.8 | 0.6 | 1.4 |
| Limiting magnitude | 26.5 | 25.5 | 25.0 | 24.0 |
We have reduced these data with the theli pipeline available at http://www.astro.uni-bonn.de/~mischa/theli.html (Erben et al. 2005). theli is a multipurpose pipeline configurable for many mosaic imagers. Data reduction proceeds with typical steps for imaging data. The mosaic frames are first split, then overscan corrected and trimmed. Next, the frames are bias corrected. A flat-field image is made from the twilight exposures taken with the same filter used for the science frames. The data are then processed and a superflat is created from the smoothed data and a fringe model is also created for fields observed in the i and z bands. The fringe model is then scaled and subtracted from the calibrated data.
We used the scamp package for astrometric calibration and swarp for combining the individual frames. Both of these packages can be found at http://terapix.iap.fr/. The SDSS astrometric catalogue was used for all fields except for Q0826−2230, for which we used the Two Micron All Sky Survey (2MASS) for astrometric references. The fields were photometrically calibrated from the SDSS catalogues for the fields with multiple sources with m < 20.0 detected in both the SDSS images and these data. The photometric zero-point for the field of Q0826−2230, which is outside of the SDSS footprint was calibrated by determining the slope of the best-fitting line between the photometric zero-points and airmasses of these fields as well as four others not published here. SExtractor version 2.5.0 was used for object identification and final catalogue creation (Bertin & Arnout 1996). A 7 × 7 convolution mask of a Gaussian point spread function (PSF) with full width at half-maximum (FWHM) of 4 pixels was used to filter the images during object detection. Only objects greater than 3σ above the background noise were included in the final catalogues, with a minimum area of 10 pixels. Magnitudes given in the text are isophotal, and centroid positions are windowed. The magnitudes have been corrected for Galactic extinction using the online calculator available at http://www.ipac.caltech.edu/forms/calculator.html. All magnitudes given here are in the AB system.
Three-band colour images were also made of the frames using the prescription detailed in Lupton et al. (2004). The images were aligned in pixel space, and a scaling was applied to each channel that attempted to match the colours of the objects seen in the SDSS images.
2.2 PSF Subtraction
Galaxies at small radii to the background QSO may become visible after PSF subtraction. With the 5 × 5 arcmin2 field of view of the instrument, several suitable point sources are available in each image for reconstructing the PSF of the instrument. The PSF did not vary significantly over the field of view of the instrument. Factors such as slightly different astrometric solutions and distortions determined for the individual frames as well as tracking jitters due to wind can lead to non-ideal PSFs in the final combined frames. We have used the daophot package in iraf to create model PSFs using multiple stars in the images. The Moffat profile was used with β = 2.5, which provided the best-fitting model of the PSF compared to other options. A 30-pixel wide aperture was used in all cases.
This model PSF was then used to interactively subtract the QSO in the images using the idp3 package in idl. idp3 is available at http://mips.as.arizona.edu/MIPS/IDP3/ for download. The PSF is interactively shifted and scaled to optimally subtract the object of interest.
In the case of Q0826−2230, the peak brightness of the QSO itself in the r and i bands was well above the level where the CCDs in the mosaic pre-form linearly. As such, the PSF needed to be slightly oversubtracted for a proper fit in these images. Accurate PSF subtraction however was not a main goal of these observations, rather deep imaging in multiple bands to allow for galaxy colours to be determined was deemed a more important intent of these observations.
3 COMMENTS ON THE INDIVIDUAL FIELDS
3.1 Q0826−2230: zem > 0.9110 zabs = 0.9110
Q0826−2230 is a BL-Lac object with no known redshift due to the lack of any emission lines, although the absorption system at zabs = 0.9110 does give a lower limit to the redshift of this object (Falomo 1990; Meiring et al. 2007). The sub-DLA in the spectrum of this object has log NH i = 19.04 ± 0.04 (e.g. Rao, Turnshek & Nestor 2006), and a high metallicity of [Zn/H]=+0.68 ± 0.08 with a kinematical width (defined as the width of the profile where the inner 90 per cent of the absorption occurs) of Δv90 = 278 km s−1 based on our earlier high-resolution spectra (Meiring et al. 2007).
This field was observed with the SDSS g, r, i and z filters. Exposure times for each filter are given in Table 1. The final calibrated frames are shown in the top row of Fig. 1, and the colour image composed of the g, r and i images is shown in Fig. 2. The seeing in the final combined images is ∼1.0, 1.0, 0.7 and 1.25 arcsec in the g, r, i and z filters, respectively.
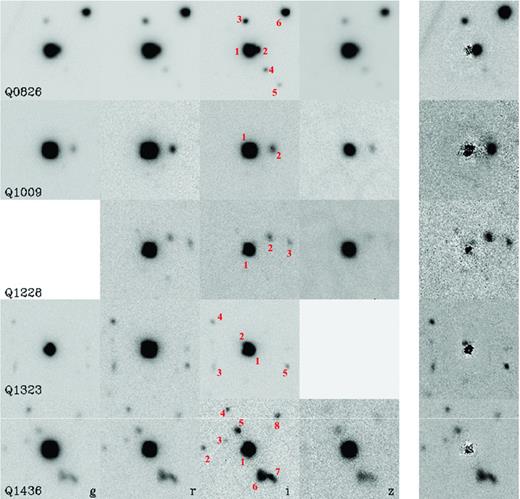
Final co-added frames for the five QSO fields of this sample. Objects from the catalogues are marked in the i-band image. North is up and east is left in each image. Each thumbnail image is 20 arcsec across, corresponding to ∼150 kpc at z = 0.8. The PSF-subtracted image of each field is shown in the rightmost column.
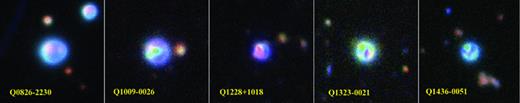
Colour combined red–green–blue (RGB) images of the fields. In all cases, the g, r and i frames where used in the RGB channels, except for Q1228+1018 for which the r, i and z frames were used.
Several objects are detected within 10 arcsec of the QSO, corresponding to ∼78 kpc at zabs = 0.9110. As this objects is near the plane of the Milky Way disc (l = 243.99, b=+8.93), the stellar density is high in the region. An object 1.4 arcsec to the west of the QSO is seen most clearly in the i-band image. A PSF model of 10 stars near the QSO was constructed by fitting 2D Moffat profiles to the individual stars and an average PSF was created that was used to subtract the QSO from the i-band image. The PSF-subtracted i-band image is shown in the last column of Fig. 1.
Limiting magnitudes of ∼24.5, 25, 25 and 23.5 were reached in the g, r, i and z filters, respectively, in the exposure times given in Table 1. Objects labelled 4 and 5 in Fig. 1 are the only possible objects that could be galaxies at z∼ 0.9, objects 3 and 6 are certainly stars. Assuming object 3 is at the redshift of the absorber, L≳ 10L★ making it unlikely to be the host galaxy of the absorption system due to the extreme luminosity and the paucity of such galaxies. hyperz (Bolzonella, Miralles & Pelló 2000) was used to determine photometric redshifts for objects 4 and 5 of zphot = 0.66 ± 0.10, 0.62 ± 0.14, respectively. Magnitudes for the objects are given in Table 2.
AB magnitudes for the objects labelled in Fig. 1. The QSO itself is listed as object 1 in each field. Magnitudes given are the isophotal values given from SExtractor for objects detected above a 3σ significance. Limiting magnitudes are given for objects not detected in a given band.
| QSO | ID | Δα (arcsec) | Δδ (arcsec) | mg | mr | mi | mz |
| Q0826−2230 | 1 | – | – | 16.18 ± 0.01 | 15.74 ± 0.01 | 15.50 ± 0.01 | 15.36 ± 0.01 |
| 2a | −1.5 | 0.2 | 19.16 ± 0.10 | 18.73 ± 0.10 | 18.53 ± 0.10 | 18.52 ± 0.10 | |
| 3 | 0.8 | 6.0 | 20.90 ± 0.05 | 29.88 ± 0.03 | 19.51 ± 0.03 | 19.45 ± 0.05 | |
| 4 | −3.2 | −3.8 | 22.61 ± 0.12 | 21.44 ± 0.06 | 20.57 ± 0.05 | 20.31 ± 0.07 | |
| 5 | −6.1 | −−7.1 | >24.50 | 23.46 ± 0.16 | 22.10 ± 0.10 | 22.58 ± 0.19 | |
| 6 | −7.1 | 7.6 | 18.24 ± 0.02 | 17.69 ± 0.01 | 17.48 ± 0.01 | 17.58 ± 0.02 | |
| Q1009−0026 | 1 | – | – | 17.97 ± 0.02 | 17.59 ± 0.01 | 17.63 ± 0.02 | 17.70 ± 0.03 |
| 2 | −4.6 | 0.1 | 22.42 ± 0.13 | 21.86 ± 0.10 | 21.00 ± 0.08 | 20.83 ± 0.12 | |
| Q1228+1018 | 1 | – | – | – | 18.25 ± 0.01 | 18.12 ± 0.02 | 17.92 ± 0.02 |
| 2 | −4.1 | 2.4 | – | 22.93 ± 0.12 | 22.08 ± 0.09 | 22.00 ± 0.15 | |
| 3 | −8.4 | 1.3 | – | 23.18 ± 0.13 | 22.70 ± 0.13 | 22.93 ± 0.23 | |
| Q1323−0021 | 1 | – | – | 18.24 ± 0.01 | 17.65 ± 0.01 | 17.41 ± 0.01 | – |
| 2 | 0.5b | 1.1b | – | – | – | – | |
| 3 | 7.1 | −3.4 | 24.16 ± 0.20 | 23.78 ± 0.17 | 23.60 ± 0.19 | – | |
| 4 | 7.3 | 5.7 | 24.43 ± 0.23 | 23.43 ± 0.14 | 23.16 ± 0.15 | – | |
| 5 | −7.7 | −3.4 | 25.12 ± 0.32 | 23.87 ± 0.17 | 23.13 ± 0.15 | – | |
| Q1436−0051 | 1 | – | – | 18.61 ± 0.02 | 18.15 ± 0.01 | 18.07 ± 0.01 | 18.04 ± 0.02 |
| 2 | 9.2 | 0.2 | 26.17 ± 0.37 | 24.99 ± 0.29 | 24.09 ± 0.24 | >24.00 | |
| 3 | 4.7 | 1.6 | 25.89 ± 0.45 | 25.18 ± 0.32 | 24.91 ± 0.35 | >24.00 | |
| 4 | 4.5 | 8.0 | 24.33 ± 0.22 | 23.92 ± 0.18 | 23.65 ± 0.20 | >24.00 | |
| 5 | 2.2 | 3.9 | 23.72 ± 0.17 | 22.95 ± 0.12 | 22.14 ± 0.10 | 21.97 ± 0.15 | |
| 6 | −2.8 | −5.5 | 22.49 ± 0.10 | 21.62 ± 0.06 | 20.82 ± 0.05 | 20.69 ± 0.08 | |
| 7 | −4.7 | −5.7 | 23.24 ± 0.14 | 22.44 ± 0.09 | 21.81 ± 0.08 | 21.82 ± 0.14 | |
| 8 | −5.9 | 6.6 | 25.43 ± 0.37 | 24.55 ± 0.24 | 23.50 ± 0.18 | >24.00 |
aMagnitudes for this object were determined from fitting the profile of the object after subtraction of the brighter object.
bThis object is detected in the PSF-subtracted i-band image, but the PSF subtraction is not adequate to determine a magnitude.
Object labelled number 2 in Fig. 1, located ∼1.5 arcsec west of the brighter object is more clearly visible in the PSF-subtracted image shown in right-hand column of Fig. 1. There are several suggestions that this QSO may be gravitationally lensed. The colours of this object are quite similar to the main object, the QSO has a large luminosity (Mi≲−28.2) indicative of magnification, and the side-by-side lensing pattern is the most commonly found lensing pattern for QSOs (Kochanek, Schneider & Wambsganss 2004). Falomo (1990) also noted that this QSO is analogous to other lensed objects. Hubble Space Telescope (HST) imaging would likely reveal if this object is indeed gravitationally lensed.
3.2 Q1009−0026: zem = 1.241 zabs = 0.8426, 0.8866
There are two sub-DLA systems in the spectrum of this QSO. One system has an absorption redshift of zabs = 0.8426 with a low metallicity ([Zn/H] < −0.98 and [Fe/H]=−1.28 and a kinematical width of Δv90 = 36 km s−1; Meiring et al. 2007) and log NH i = 20.20 ± 0.06 (Rao et al. 2006), and a second system at zabs = 0.8866 has a high metallicity ([Zn/H]=+0.25 ± 0.06 and [Fe/H]=−0.58 with Δv90 = 94 km s−1; Meiring et al. 2007) and log NH i = 19.48 (Rao et al. 2006).
This field was observed in the griz filters. Exposure times are given in Table 1. The final combined frames are shown in the second row of Fig. 1, and the colour combined image composed of the gri frames is shown in Fig. 2. The seeing in the final combined frames was ∼0.9, 0.8, 1.1 and 1.1 arcsec in the g, r, i and z filters, respectively. Limiting magnitudes of ∼ 26, 25.5, 25 and 23.5 were reached in the g, r, i and z filters, respectively.
One object is detected in the images within 10 arcsec of the QSO, 4.6 arcsec to the west of the QSO (corresponding to a comoving impact parameter of ∼35 kpc at z = 0.8426 or ∼36 kpc at z = 0.8866). This object has been confirmed to be at z = 0.8866 via integral field unit (IFU) observations (Péroux et al. 2010). The hyperz software package was used to determine a photometric redshift of zphot = 0.79 ± 0.08.
We note that photometric redshifts for star-forming galaxies are difficult due to the flatness of their spectrum, and four-band photometry is a minimum requirement for determining photometric redshifts. Additional photometric points in the infrared (IR) and near-ultraviolet (NUV) help to tightly constrain photometric redshifts (Margonier, Connolly & Tyson 2005). No candidate galaxies for the zabs = 0.8426 system are observed in the field. The limiting i-band magnitude of ∼25 corresponds to a limiting luminosity of this galaxy of L≲ 0.1L★ in the observed frame i band. No object at z∼ 0.8426 was observed in the IFU observations of this QSO either (Péroux et al. 2010). The only other possible source in this field is a faint object south of the QSO which is minimally visible in the r and i frames, as well as the colour combined frame in Fig. 2. The object was not detected at >2σ with SExtractor however, and was not included in the final catalogue. A second possibility is that the z = 0.8426 galaxy could be at a small impact parameter to the QSO and not have significant star formation. The previous IFU observations would not likely detect such a galaxy, and higher quality PSF subtraction or space-based imaging would be necessary to rule out such a scenario.
3.3 Q1228+1018: zem = 2.306 zabs = 0.9376
A sub-DLA system is observed in the spectrum of this QSO at zabs = 0.9376 with log NH i = 19.41 ± 0.04 (Rao et al. 2006). Although the Zn ii λλ2026, 2062 lines were not detected in our earlier spectra, the system does have a high metallicity based on the depleted element Fe of [Fe/H]=−0.31 ± 0.02 and a kinematical width Δv90 = 116 km s−1 (Meiring et al. 2008).
This field was observed in the riz filters with the exposure times given in Table 1. The final combined frames are shown in the third row of Fig. 1, and the colour combined image composed of the riz frames is shown in Fig. 2. The seeing in the final combined frames was ∼0.8, 0.8 and 1.5 arcsec in the r, i, and z filters, respectively. Limiting magnitudes of ∼ 25.0, 24.5 and 23 were reached in the r, i, z filters.
Two galaxies are seen north-west of the QSO at projected impact parameters of 38 and 66 kpc with i-band magnitudes of 22.08 and 22.70, respectively. Two other objects are also seen in the r-band image of this field, but they were not detected above a 2σ significance with SExtractor and are not included in the final object catalogues.
3.4 Q1323−0021: zem = 1.388 zabs = 0.7160
A metal-rich sub-DLA system is observed in the spectrum of this QSO at zabs = 0.7160 with log NH i = 20.21 ± 0.20 (Péroux et al. 2006a). From high-resolution Very Large Telescope (VLT) spectra of this object, metallicities based on Zn of [Zn/H]=+0.61 ± 0.20 and based on Fe of [Fe/H]=−0.51 ± 0.20 and a kinematical width Δv90 = 91 km s−1 have been determined (Khare et al. 2004; Péroux et al. 2006a).
This field was observed in the gri filters with the exposure times given in Table 1. The final combined frames are shown in the fourth row of Fig. 1, and the colour combined image composed of the gri frames is shown in Fig. 2. The seeing in the final combined frames was ∼0.7, 0.8 and 0.7 arcsec in the g, r and i filters, respectively. Limiting magnitudes of ∼.525.5, 25.5 and 25 were reached in the g, r and i filters, respectively.
Three objects are detected in the field, with one object detected in the i-band image north-east of the QSO. After PSF subtraction of the QSO, the nearby object is more visible (labelled 2 in Fig. 1, and is in the same position as the object that was detected in the K-band IR imaging of this QSO in Hewett & Wild (2007) and adaptive optics imaging of Chun et al. (2010). The quality of the PSF subtraction of the QSO is not adequate to obtain a magnitude of this object in the i-band image, and we note only its position in Table 2.
It is interesting to note that no Hα emission is detected in this galaxy (Péroux et al. 2010). The lack of Hα emission and the non-detections in the g and r images of this field (even though the seeing and depths were similar) indicate that this galaxy is of moderately early type, with few young stars producing emission in the NUV and u band at the redshift of the absorber. Indeed, Péroux et al. (2010) determine a star formation rate (SFR) of< 0.1 M⊙ yr−1 for this object based on the non-detection of Hα. Magnitudes for the remaining objects are also given in Table 2.
3.5 Q1436−0051: zem = 1.275 zabs = 0.7377, 0.9281
Two systems are observed in the spectrum of this QSO at zabs = 0.7377 and 0.9281 with log NH i = 20.08 ± 0.11 and log NH i < 18.8, respectively. Both systems have high metallicities, with the lower redshift system at zabs = 0.7377 having [Zn/H]=−0.05 ± 0.12 and [Fe/H]=−0.61 ± 0.11 with Δv90 = 71 km s−1, while the system at zabs = 0.9281 is highly enriched with [Zn/H] > +0.86 and [Fe/H] > −0.07 and Δv90 = 62 km s−1. Both systems show Ca ii λλ3934, 3969 absorption lines, with [Ca/Fe]=−0.98 ± 0.03 and [Ca/Fe]=−0.79 ± 0.04 for the zabs = 0.7377 and 0.9281 systems, respectively (Meiring et al. 2008).
The field of this QSO was observed in the griz filters with the exposure times given in Table 1. The final combined frames are shown in the fifth row of Fig. 1, and the colour combined image composed of the gri frames is shown in Fig. 2. The seeing in the final combined frames was ∼0.8, 0.8, 0.6 and 1.4 arcsec in the g, r, i and z filters, respectively. Limiting magnitudes of ∼26.5, 25.5, 25 and 24 were reached in the g, r, i and z filters, respectively.
Several objects are detected within 10 arcsec of the QSO, as can be seen in Fig. 1. Objects labelled 5, 6 and 7 are the brightest galaxies in the region, with mi = 23.86, 20.90 and 21.89. Object 6 and 7 appear to be interacting. All of these three objects have relatively flat spectral energy distributions, typical of actively star-forming galaxies at the redshift of the absorbers. Photometric redshifts for these three objects determine zphot∼ 0.70, consistent with these being members of a group. We note that the 1σ error on the photometric redshift of object 5 is ∼0.11, i.e. the photometric redshift determined from hyperz is only 2σ away from the redshift of the higher z system at zabs = 0.9281. The extremely blue colours of objects labelled 3 and 4 in Fig. 1 likely exclude these galaxies of being at the redshift of either absorber. hyperz determines photometric redshifts of zphot = 0.25 ± 0.10, 0.18 ± 0.10.
4 RESULTS
4.1 Luminosities and K-corrections
In order to determine the absolute magnitudes of the galaxies observed in these fields, K-corrections must be applied for an accurate estimate. We have determined i-band K-corrections for these galaxies assuming both a starburst-type galaxy and an Sa-type galaxy, with the templates originating from the SDSS galaxy spectra template libraries available at http://www.sdss.org/dr7/algorithms/spectemplates/index.html. Although in principle the galaxies hosting the absorbers in question could be of early type, the fact that there is significant continuum emission at short wavelengths apparent from the g-band images and flat spectral energy distributions for these galaxies indicates that star formation is currently ongoing in these systems. Hence, we have chosen to include only the templates for these star-forming galaxies for the K-corrections. Assuming an early-type galaxy spectrum would increase the absolute magnitudes of these galaxies. The K-corrected absolute magnitudes are given in Table 3, assuming that each galaxy is at the redshift of the absorber. The value of M★i=−21.59 from Blanton et al. (2003) was used for determining luminosities.
Magnitudes and luminosities of the galaxies observed in the fields.
| Object | zabs | log NH i (dex) | [Zn/H] (dex) | [Fe/H] (dex) | ID | Mi Sa | Mi Burst | Li/L★i Sa | Li/L★i Burst | ρ kpc |
| Q0826−2230 | 0.9110 | 19.04 ± 0.04 | +0.68 ± 0.08 | −0.94 ± 0.06 | 4 | −24.1 | −23.2 | 10.1 | 4.4 | 40.1 |
| 3 | −25.2 | −24.3 | 27.8 | 12.1 | 47.3 | |||||
| 5 | −22.6 | −21.7 | 2.6 | 1.1 | 72.5 | |||||
| Q1009−0026 | 0.8426, 0.8866 | 20.20 ± 0.06, 19.48 ± 0.05 | < −0.98, +0.25 ± 0.06 | −1.28 ± 0.07, −0.58 ± 0.06 | 2 | −23.8a | −22.7a | 7.7a | 2.8a | 35.7a |
| Q1228+1018 | 0.9376 | 19.41 ± 0.02 | < −0.37 | −0.30 ± 0.02 | 2 | −23.0 | −21.9 | 3.7 | 1.3 | 37.8 |
| 3 | −22.4 | −21.3 | 2.1 | 0.8 | 66.1 | |||||
| Q1323−0021 | 0.7160 | 20.21 ± 0.19 | +0.61 ± 0.20 | −0.51 ± 0.20 | 2 | – | −25.0b | – | 6.3b | 9.0b |
| 3 | −20.3 | −19.3 | 0.3 | 0.1 | 58.4 | |||||
| 5 | −20.7 | −19.9 | 0.4 | 0.2 | 59.8 | |||||
| 4 | −20.7 | −19.9 | 0.4 | 0.2 | 66.3 | |||||
| Q1436−0051 | 0.7377, 0.9281 | 20.08 ± 0.11, <18.8 | −0.05 ± 0.12, > +0.86 | −0.61 ± 0.11, > −0.07 | 5 | −21.8, − 22.9 | −21.0, − 21.8 | 1.2,3.4 | 0.6, 1.2 | 32.7, 35.2 |
| 3 | −19.0, − 20.1 | −18.2, − 19.0 | 0.1, 0.3 | 0.1, 0.1 | 36.2, 39.0 | |||||
| 6 | −23.1, − 24.2 | −22.3, − 23.1 | 4.0, 11.0 | 1.9, 4.0 | 45.0, 48.4 | |||||
| 7 | −22.1, − 23.2 | −21.3, − 22.1 | 1.6, 4.4 | 0.8, 1.6 | 53.9, 58.0 | |||||
| 8 | −20.4, − 21.5 | −19.6, − 20.4 | 0.3, 0.9 | 0.2, 0.3 | 64.6, 69.5 | |||||
| 4 | −20.3, − 21.4 | −19.5, − 20.3 | 0.3, 0.8 | 0.1, 0.3 | 67.0, 72.1 | |||||
| 2 | −19.9, − 21.0 | −19.0, − 19.8 | 0.2, 0.6 | 0.1, 0.2 | 67.2, 72.2 |
aAs this object has been confirmed to be at the redshift of the higher z absorber (Péroux et al. 2010), the values given are for this redshift only. We estimate the limiting luminosity of the zabs = 0.8426 system to be L < 0.1L★ or the galaxy is at a small impact parameter and blended in the PSF of the QSO.
bValues taken from Chun et al. (2010), based on the K-band adaptive optics imaging of this system with an Sc-type K-correction.
In total, the fields of Q1009−0026, Q1228+1018, Q1323−0021 and Q1436−0051 all contain L > L★ galaxies within 75 kpc projected impact parameters. Could these galaxies be unrelated field galaxies that just happen to lie near the sightline to the QSOs? This is a persistent question when imaging QSO absorbers, which can ultimately only be settled with follow-up spectroscopy to confirm the redshifts of the galaxies. However, the probability of observing an L > 0.1L★ galaxy in a small projected diameter pencil beam survey such as this is quite small. Assuming the Schechter function parameters of the i-band galaxy luminosity distribution from Blanton et al. (2003) of M★i=−21.59, ϕ★ = 0.005 Mpc−3 and α=−1.00, we have estimated the number of galaxies with L > 0.1L★ that will be intercepted in a random 100-arcsec2 field, shown in Fig. 3 as a function of redshift. As can be seen, we expect to intercept less than one L > 0.1L★ galaxy in a random 100-arcsec2 field for z < 1.5. Hence, the likelihood of each of these fields containing bright galaxies not associated with the hosts of the sub-DLA systems is very small. Using the luminosity function parameters at z∼ 1 from Ilbert et al. (2005) results in the same conclusions.
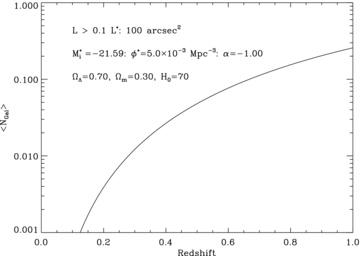
The expected number of galaxies with L > 0.1L★ in a pencil beam of area 100 arcsec2 as a function of redshift, assuming the Schechter luminosity function parameters from Blanton et al. (2003).
4.2 Column density versus impact parameter
We have compiled the available data from the literature on impact parameters for absorption systems that have known NH i at z≲ 1. These data are given in Table 4. We have taken a subsample of these data to include only the systems that have spectroscopically confirmed galaxy redshifts, or secure photometric redshifts. A Kendall's τ test was used to determine the probability of a correlation between NH i and impact parameter ρ, resulting in τ=−0.23 and a probability of no correlation of 0.47. If one includes the data points that do not have spectroscopic redshifts of the galaxies, Kendall's τ then becomes τ=−0.48 with a probability of no correlation of 0.05.
Impact parameters and column densities for these data and the literature data.
| QSO | zabs | log NH i (cm−2) | ρ (kpc) | zgal typea | Reference |
| Ton1480 | 0.0036 | 20.34 | 8.48 | s | 1 |
| Q1543+5921 | 0.0090 | 20.35 | 0.44 | s | 1 |
| J1042+0748 | 0.0330 | <19.98 | 1.7 | s | 2 |
| Q0738+313 | 0.0910 | 21.17 | <3.6 | n | 3 |
| Q0439−433 | 0.1010 | 19.75 | 7.57 | s | 4 |
| Q0151+045 | 0.1600 | 19.85 | 17.6–30.1 | s | 5, 6 |
| Q0850+440 | 0.1638 | 19.81 | 25 | s | 7 |
| Q0738+313 | 0.2210 | 20.89 | 20 | s | 3,4 |
| Q0952+179 | 0.2390 | 21.32 | <4.5 | n | 8 |
| Q1127−145 | 0.3130 | 21.71 | >17 | s | 8,9 |
| Q0150−203 | 0.3830 | 18.47 | 54.9 | s | 5 |
| Q1229−021 | 0.3950 | 20.75 | 7.6 | n | 10, 11 |
| Q0809+483 | 0.4370 | 20.79 | 9.6 | s | 10, 12 |
| Q0235+164 | 0.5240 | 21.65 | 6 | n | 13 |
| Q0827+243 | 0.5250 | 20.3 | 38 | s | 4, 8 |
| Q1629+120 | 0.5320 | 20.7 | 17 | s | 8 |
| Q0058+0155 | 0.6130 | 20.08 | 8.1 | s | 1 |
| Q1229+107 | 0.6330 | 20.3 | 11.2 | n | 10 |
| Q1122−1649 | 0.6810 | 20.45 | 5.1 | p | 1 |
| Q1328+307 | 0.6920 | 21.17 | 6.5 | n | 10, 11 |
| Q1323−0031 | 0.7160 | 20.21 | 9 | n | 14, 15 |
| Q1137+3907 | 0.7185 | 21.1 | 11 | s | 16 |
| Q1436−0051 | 0.7377 | 20.08 | >33 | n | 15 |
| Q0051+0041 | 0.7400 | 20.4 | 24 | s | 16 |
| Q1009−0026 | 0.8426 | 20.2 | <15 | n | 15 |
| Q0454+039 | 0.8590 | 20.67 | 6.4 | n | 10 |
| Q1009−0026 | 0.8866 | 19.48 | 35.7 | s | 15, 17 |
| Q1436−0051 | 0.9281 | <18.8 | >35 | n | 14 |
| Q1228+1018 | 0.9376 | 19.41 | >38 | n | 14 |
| Q1727+5302 | 0.9450 | 21.16 | 29.2 | n | 18 |
| Q0302−223 | 1.0100 | 20.36 | 25.0 | s | 10, 17 |
an = no redshift information, p = secure photometric redshift and s = spectroscopic redshift.
References: (1) Chen & Lanzetta (2003), (2) Borthakur et al. (2010), (3) Turnshek et al. (2001), (4) Chen et al. (2005), (5) Ellison, Kewley & Mallen-Ornelas (2005), (6) Christensen et al. (2005), (7) Lanzetta et al. (1997), (8) Rao et al. (2003), (9) Kacprzak, Murphy & Churchill (2010), (10) Le Brun et al. (1997), (11) Steidel et al. (1994), (12) Gharanfoli et al. (2007), (13) Burbidge et al. (1996), (14) Chun et al. (2010), (15) this paper, (16) Lacy et al. (2003), (17) Péroux et al. (2010) and (18) Hewett & Wild (2007).
We have preformed a linear regression on these data, using survival analysis to include the mixed censored data in the fit using Schmitt's binning method. We find the best-fitting trend line of log NH i = (20.67 ± 0.23) − (0.028 ± 0.014) ×ρ when using only the spectroscopically confirmed galaxies and log NH i = (20.86 ± 0.14) − (0.03 ± 0.008) ×ρ when including galaxies without redshift information.
Fig. 4 shows a plot of impact parameter versus NH i for the literature data, and the points from the observations in this investigation. For Q1228+1018 and Q1436−0051 we give the impact parameter as a lower limit as it is uncertain to which galaxy in these fields the absorption is linked to without spectroscopic observations of the galaxies. For the absorber at zabs = 0.8426 in Q1009−0026 we give the impact parameter as an upper limit based on a 2-arcsec threshold radius inside the PSF. Also shown in Fig. 4 are the radial 21-cm profile of Malin1, a nearby LSB galaxy from Pickering et al. (1994) and the average Sc-type 21-cm radial profile from Swaters et al. (2002). The data in that work are normalized relative to the 21-cm H i radius (i.e. R/RH), so we have used the median H i radius for L∼L★ galaxies from Noordermeer et al. (2005) of 28 kpc to scale the profile. The minimal correlation between impact parameter and NH i indicates that the QSO absorber population stems from a range of environments and morphological types, which is also supported in the heterogeneous collection of galaxies that comprise the literature sample.
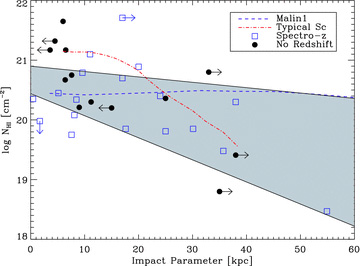
Log NH i versus impact parameter for QSO absorbers with follow-up imaging data. Square data points have spectroscopic or secure photometric redshift determinations of the galaxies, and circular points have no redshift information on the galaxies. The shaded region represents the 1σ confidence intervals on the best-fitting linear regression line using the Schmitt method to include upper and lower limits in the spectroscopically confirmed sample. Also overplotted is the 21-cm profile of the LSB galaxy Malin1 from Pickering et al. (1994) and the average 21-cm profile of local star-forming galaxies from Swaters et al. (2002) and Noordermeer et al. (2005).
The random orientations of galaxy disc inclinations increase the dispersion in the trend between impact parameter and NH i. Monte Carlo simulations of ρ versus NH i reported in Chen et al. (2005) have a scatter of ∼0.5 dex in NH i for a given impact parameter. These simulations were conducted using idealized smooth H i profiles; using more realistic simulations that include the patchy and filamentary features typically seen in the interstellar medium of the Milky Way and nearby galaxies would likely increase the scatter even more. A larger sample of DLA systems and sub-DLA systems with imaging data at z < 1 would allow for a direct comparison of objects in terms of their impact parameters an luminosities.
5 DISCUSSION AND CONCLUSIONS
In our previous spectroscopic observations of sub-DLA systems at z < 1.5, we have shown that this population is more metal rich than their DLA counterparts. With the observed correlation between luminosity and metallicity seen in Tremonti et al. (2004), one would suspect that the host galaxies of the metal-rich DLA systems in our sample should be L≳L★. We have preformed deep imaging of the fields of five QSOs that harbour metal-rich sub-DLA systems in their spectrum with the SOAR telescope and the SOI camera. In four of the five fields, luminous galaxies are observed, and one QSO (Q0826−2230) is likely gravitationally lensed by the intervening absorbing galaxy.
Is it possible that the candidate galaxies are directly atop the QSOs? The PSF subtraction of Q1323−0021 successfully reveals the galaxy detected in Chun et al. 2010, and no other bright galaxies are detected in the PSF-subtracted images, so we feel that this is unlikely. There are several reasons to suspect that the galaxies at large impact parameters are in fact the host galaxies of these sub-DLA systems. The ever possible scenario of an LSB galaxy at low impact parameter is unlikely, as the low metallicities of LSB galaxies (McGaugh 1994; Habberzettl, Bowmans & Dettmar 2007) exclude them as possible candidates for these high-metallicity sub-DLA systems. The probability of observing any interloping field galaxy with L > L★ in a pencil beam survey such as this is small, as is shown in Fig. 3, and the photometric redshifts for the galaxies are consistent with these galaxies being at substantial redshifts. Aside from the case of Q1323−0021 in which the impact parameter is ∼9 kpc, in the fields of Q1009−0026, Q1228+1018 and Q1436−0051 the impact parameters of all the galaxies in the fields is ≳35 kpc.
These large impact parameters in several cases certainly raise the question as to the origins of the absorbing material. Could the material be ordinary interstellar gas residing in the extended disc of the host galaxies? The H i envelope of gas-rich galaxies typically does extend to much greater distances than the optical images suggest (Walter et al. 2008), although not often to great enough radii to produce sub-DLA H i column densities at these impact parameters. Above a certain critical surface density, local pockets of gas are unstable to gravitational collapse (Toomre 1964; Kennicutt 1989). The low H i column densities of these sub-DLA systems are well below the typical H i column density threshold of ∼1020.5 cm−2 of Kennicutt (1989), hence star formation is unlikely to occur in these regions. Observations have shown some amount of star formation at large galactic radii in nearby galaxies; however the star formation complexes are sparse with a low filling factor, making a random sightline passing through such regions improbable (Ferguson, Gallagher & Wyse 1998; Goddard, Kennicutt & Weber 2010). Merging galaxies do however often show high levels of star formation at large galactic radii (Larson & Tinsley 1978; Smith et al. 2010).
Similarly, the abundances as derived from the nebular lines in the outer regions (R > R25) of nearby late-type galaxies are typically ∼0.1 Z⊙ even where the abundances are roughly solar in the inner regions of the galaxy. These metallicities are similar to that of many DLA systems, but well below the abundances we see in the sub-DLA systems in this sample (Ferguson et al. 1998; Bresolin et al. 2009). The impact parameters we see in these absorbers is several times greater than R25∼ 10–15 kpc typical of late-type galaxies.
The relatively flat spectral energy distributions for the galaxies in the fields of Q1009−0026 and Q1436−0051, for which we have four filter imaging, are indicative of star-forming galaxies. In the case of Q1436−0051, there are clear indications of interacting galaxies which are typically actively forming stars. We feel that a more likely explanation for the origins of this gas in light of these imaging observations is that it is the signature of outflowing galactic winds (Bouché et al. 2007; Kobayashi, Springel & White 2007). The high metallicities of these systems along with the large impact parameters suggest that this gas is the result of recent bursts of star formation in the galaxies or possibly tidally stripped material in the interacting galaxies.
The mean Δv90 of sub-DLA system as a population is ∼125 km s−1, slightly higher than the mean for DLA systems of 103 km s−1 (Kulkarni et al. 2010). The sub-DLA systems in this work have a slightly lower mean velocity width than the total sub-DLA population of Δv90 = 107 km s−1. The complex velocity profiles seen in some absorption line systems have often been attributed to merging or interacting galaxies (Petitjean, Srianand & Ledoux 2002; Quast, Reimers & Baade 2008). The profiles for both the systems in the spectrum of Q1436−0051 are not unusually broad, each extending ∼100 km s−1. If the interacting galaxies seen to the south of this field are indeed responsible for the absorption line system, then at least in this case interacting galaxies surprisingly do not seem to produce a complex velocity structure. At smaller impact parameters the profiles may show signs of broader velocity profiles. The inclination of the disc to the QSO line of sight possibly plays a large part in the kinematic width of the absorption profiles.
It is interesting to note that although the recent compilation of Noterdaeme et al. (2008a) focused on DLA systems (77 total systems were included in the sample, with only seven sub-DLA systems and all had log NH i >20.0), one of the systems with a high molecular fraction was in fact a sub-DLA. Similarly high molecule-rich sub-DLA systems have also been seen in other investigations (Noterdaeme et al. 2008b; Quast et al. 2008; Noterdaeme et al. 2010). It would be interesting to expand the number of H2 measurements in sub-DLA systems to see if they perhaps also have high molecular fractions, and thus favouring the scenario where the lower H i column densities are due to the conversion of gas from neutral to molecular.
Although the number of DLA systems or sub-DLA systems that have been observed with high-quality spectra has increased, there is still a very small number of galaxies that has been confirmed at the redshift of the absorber with follow-up spectroscopic measurements. Even fewer DLA systems have spectra of the host galaxy of high-enough S/N that can be used to determine the properties of the galaxy's stellar population such as the SFR, masses and star formation histories via spectral template fitting and emission-line diagnostics.
Follow-up spectroscopy is clearly necessary to link the properties we see in absorption such as the metallicity, kinematics and abundance patterns with the properties of the stellar populations of the host galaxies. DLA systems and sub-DLA systems are likely to arise in a range of environments, a larger sample with imaging and spectroscopy of the host galaxies would reveal any potential dichotomy in the populations. The sub-DLA systems in this sample seem to arise in a range of environments themselves, from the inner region of a possible early-type galaxy in the case of the sub-DLA in SDSS J1323−0021, from the periphery of a luminous star-forming galaxy in SDSS J1009−0026 and from the outskirts of an interacting pair of galaxies in SDSS J1436−0051. However, in all cases we observe luminous galaxies that are the likely host galaxies of these metal-rich absorbers. A large sample of both spectroscopic and photometric measurements of DLA and sub-DLA host galaxies will allow for studying trends between luminosity, impact parameter and SFR. Higher spatial resolution imaging with the HST would also allow for detailed information on the morphology of the absorbing galaxies.
Present address: Department of Astronomy, University of Massachusetts, Amherst, MA 01003, USA.
We thank the exceptionally helpful staff of SOAR for their assistance during the observing runs. The SOAR Telescope is a joint project of Conselho Nacional de Pesquisas Cientificas e Tecnologicas CNPq-Brazil, the University of North Carolina at Chapel Hill, Michigan State University and the National Optical Astronomy Observatory. iraf is distributed by the National Optical Astronomy Observatory, which is operated by the Association of Universities for Research in Astronomy (AURA) under cooperative agreement with the National Science Foundation. We thank the anonymous referee for the helpful comments in the preparation of this manuscript. VPK acknowledges partial support from the National Science Foundation grant AST-0908890.
REFERENCES
