


Abstract
We present five epochs of VLBI water maser observations around the massive protostar Cepheus A HW2 with 0.4 mas (0.3 au) resolution. The main goal of these observations was to follow the evolution of the remarkable water maser linear/arcuate structures found in earlier VLBI observations. Comparing the data of our new epochs of observation with those observed 5 yr before, we find that at ‘large’ scales of >rsim1 arcsec (700 au) the main regions of maser emission persist, implying that both the surrounding medium and the exciting sources of the masers have been relatively stable during that time-span. However, at smaller scales of ≲0.1 arcsec (70 au) we see large changes in the maser structures, particularly in the expanding arcuate structures R4 and R5. R4 traces a nearly elliptical patchy ring of ∼70 mas size (50 au) with expanding motions of ∼5 mas yr−1 (15 km s−1), consistent with previous results of Gallimore and collaborators. This structure is probably driven by the wind of a still unidentified YSO located at the centre of the ring (∼0.18 arcsec south of HW2). On the other hand, the R5 expanding bubble structure (driven by the wind of a previously identified YSO located ∼0.6 arcsec south of HW2) is currently dissipating in the circumstellar medium and losing its previous degree of symmetry, indicating a very short lived event. In addition, our results reveal, at scales of ∼1 arcsec (700 au), the simultaneous presence of a relatively slow (∼10–70 km s−1) wide-angle outflow (opening angle of ∼102°), traced by the masers, and the fast (∼500 km s−1) highly collimated radio jet associated with HW2 (opening angle of ∼18°), previously observed with the VLA. This simultaneous presence of a wide-angle outflow and a highly collimated jet associated with a massive protostar is similar to what is found in some low-mass YSOs. There are indications that the primary wind(s) from HW2 could be rotating. The implications of these results in the study of the formation of high-mass stars are discussed.
1 INTRODUCTION
The main characteristics of the formation process and evolutionary sequence of low-mass young stellar objects (YSO) is relatively well understood, with their formation via accretion discs (precursors of planetary systems) and the simultaneous ejection of collimated winds through the poles of the disc. The subsequent interaction of the winds with the ambient medium gives rise to other observed phenomena, such as molecular outflows and Herbig–Haro (HH) systems (Anglada 1996; Shang et al. 2006; Bally, Reipurth & Davis 2007; Machida, Inutsuka & Matsumoto 2008). In the case of massive stars (M > rsim 8 M⊙), the progress in the understanding of their formation and influence on the environment medium has been more difficult (Hoare & Franco 2007; Hoare et al. 2007; Zinnecker & Yorke 2007). It might be possible that high-mass stars form in a similar way as low-mass stars, namely through accretion on to the protostar until a massive object is assembled. However, there are significant differences between low- and high-mass star formation, of which two major differences are (i) massive stars are on the main sequence almost from their birth, with radiation pressure acting on dust grains that can become large enough to reverse the infall of matter (in the case of low-mass stars, radiation pressure does not play any significant role in the halting of the accretion process), and (ii) they form in clusters and associations, within warmer, larger and more massive molecular clouds, with strong and complex influences on the surrounding molecular material via ionizing radiation, outflows and gravitational interactions. These differences have led to the suggestion that different mechanisms (or modes) may apply to low- and high-mass star formation; for example, through an accretion disc in a similar way to the low-mass case, but with very high accretion rates (Yorke & Sonnhalter 2002; McKee & Tan 2003; Krumholz, Klein & McKee 2005; Krumholz et al. 2009); through a competitive accretion in a protocluster environment (Bonnell & Bate 2006); or through coalescence of previously formed stars of lower mass (Bonnell, Bate & Zinnecker 1998).
One observational approach in the study of high-mass star formation has been to search for discs and jets in young high-mass stars, trying to find a parallelism with the formation of low-mass stars (see e.g. the disc-outflow systems associated with the massive stars in W51N and W33A at scales of ∼2000–3000 au; Zapata et al. 2009; Davies et al. 2010; and the radio jets in HH80-81, AFGL 2591, IRAS 20126+4104 and IRAS 18089-1732; Martí, Rodríguez & Reipurth 1998; Trinidad et al. 2003; Hofner et al. 2007; Beuther & Walsh 2008). However, only a handful of sources have been studied in detail due to several strong observational limitations. These limitations arise from the fact that there is a relatively small number of young high-mass stars (they are a very small fraction of the new stars and besides evolve quickly); they are highly obscured [they are frequently only observable at centimetre and (sub)millimetre wavelengths]; and they are remote, which makes it very difficult to identify and isolate single young high-mass stars owing to the lack of sufficient angular resolution. For example, an angular resolution of 1 arcsec implies a linear scale of 2000 au for sources at distances of 2 kpc (a typical distance for high-mass star formation regions), which are scales where multiple high-mass objects are expected to be found (extrapolating from what is observed in Orion, the closest region of massive star formation; e.g. Zinnecker & Yorke 2007).
At a distance of 725 pc (Johnson 1957; Moscadelli et al. 2009), Cepheus-A is the second nearest high-mass star formation region after Orion (see Kun, Kiss & Balog 2008 for a review of the main observational characteristics of this region). Because of its relative proximity, it has been possible to identify and isolate at the centre of this region the young massive star Cepheus A HW2, the brightest of the radio continuum sources observed in the region (Hughes & Wouterloot 1984; Rodríguez et al. 1994; Garay et al. 1996). With a mass of ∼15–20 M⊙, HW2 is deeply embedded in a high-density core with visual extinction AV≃ 103 mag (Torrelles et al. 1985, 1993). In fact, Pravdo et al. (2009) and Schneider, Günter & Schmitt (2009) have recently found that while some of the other radio continuum sources near HW2 are detected in X-rays with Chandra, HW2 itself is not detected at these frequencies, deriving very high absorbing column densities towards this massive object (although see Parkin et al. 2009 showing that massive YSOs are hard to detect in X-rays even with moderate column densities). HW2 is also hidden at 24.5 μm (de Wit et al. 2009). The nature of HW2 as a young massive star is also inferred from its association with very bright masers and intense magnetic fields (Torrelles et al. 1996; Minier, Booth & Conway 2000; Gallimore et al. 2003; Niezurawska et al. 2004; Bartkiewicz et al. 2005; Vlemmings et al. 2006; Curran & Chrysostomou 2007; Patel et al. 2007; Sugiyama et al. 2008). However, what makes this source a singular young massive star is its association with an ionized biconical highly collimated jet at scales ≲1000 au (outflow opening angle ∼18°), exhibiting ejections in opposite directions moving away from the central source at ∼500 km s−1, with an orientation similar to that of the more extended (∼1 arcmin) bipolar molecular outflow seen in HCO+ (Rodríguez et al. 1994; Gómez et al. 1999; Curiel et al. 2006, hereafter C2006). These observational characteristics, in analogy to what is observed in low-mass YSOs, support the hypothesis that the massive young star HW2 has been formed through an accretion disc, rather than by merging of lower-mass stars, because in this last case a collimated jet is not expected to survive. The detection of a rotating disc of dust and molecular gas with a size of ∼700 au oriented perpendicular to, and spatially coincident with, the HW2 radio jet, together with the magnetic field predominantly aligned along the outflow and perpendicular to the disc, gives further support to the accretion disc scenario for the formation of this massive star (Patel et al. 2005; Jiménez-Serra et al. 2007; Torrelles et al. 2007; Vlemmings et al. 2010).
The presence of a disc–YSO–jet system associated with Cepheus A HW2 (the smallest one ever detected around a young massive star), which is a part of a cluster of massive stars observed in the region (Garay et al. 1996; Martín-Pintado et al. 2005; Curiel et al. 2006; Jiménez-Serra et al. 2009), has turned this object into an ideal laboratory for testing current theories of high-mass star formation, as well as to study their influence on the surrounding high-density molecular material via radiation (e.g. ionization, dust and molecular gas heating; Garay et al. 1996; Jiménez-Serra et al. 2009); outflows (e.g. shock-excited molecular gas emission; Hartigan et al. 1986; Hartigan, Morse & Bally 2000; Torrelles et al. 2001a, hereafter T2001a; Torrelles et al. 2001b, hereafter T2001b; Patel et al. 2007); and gravitational interactions between the members of the cluster (e.g. precession of the disc–HW2–jet system; C2006; Cunningham, Moeckel & Bally 2009).
In this paper, we present Very Long Baseline Interferometry (VLBI) multi-epoch water maser observations of the Cepheus A region. The high brightness and the compact nature of masers have proven to be extremely useful to study, with angular resolution better than 1 mas, the main properties of the gas very close to the YSOs. The main goal of the observations presented here was to follow the evolution of the remarkable water maser linear/arcuate structures found in earlier VLBI observations (T2001a; Gallimore et al. 2003). These previous observations led to the identification of at least three different centres of star formation activity in a region of ∼0.3 arcsec (200 au) radius; the first one associated with HW2, a second one associated with the exciting source of the expanding water maser bubble R5 and the third one associated with the exciting source of the maser arcuate structure R4. Our new data were obtained from five epochs of observation (Section 2). In Section 3 we present our main observational results, and their implications in the study of the formation of high-mass stars are discussed in Section 4. The main conclusions of this work are presented in Section 5.
2 OBSERVATIONS
The multi-epoch water maser line (616→ 523; ν = 22 235.080 MHz) observations were carried out with the Very Long Baseline Array (VLBA) of the National Radio Astronomy Observatory (NRAO)1 on 2001 July 11, July 30, August 18, September 13, and 2002 January 27, for ∼11 h during each of the five epochs. We used 512 spectral line channels of 0.21 km s−1 width, covering the velocity range of VLSR≃− 66 to +42 km s−1, where LSR is local standard of rest. After correlation at the NRAO Array Operation Center (AOC), the data were calibrated and imaged using the Astronomical Image Processing System (AIPS). Delay and phase calibration was provided by 3C345, 1739+522, 2007+777, BL Lac and 3C454.3, while bandpass corrections were made using 3C345, BL Lac and 3C454.3. The synthesized beam size was ∼0.4 mas for the five epochs. We identified a strong (≥10 Jy) point-like water maser at VLSR=−6 km s−1 persisting in all the observed epochs, allowing us to self-calibrate the data using that same reference feature. The absolute coordinates obtained for the reference feature in the five epochs were in agreement to within ∼0.01 arcsec. A first coordinate alignment of the five epochs of observations was made with respect to this reference feature.
In order to identify the regions of water maser emission, we first made large data cubes of 512 channel images of 8192 × 8192 pixels with a cell size of 1 mas for each of the five epochs, centred on the reference feature that was used for self-calibration. Water maser emission was found essentially around HW2 and HW3d, spread over a spatio-kinematical region of ∼4 arcsec and ∼200 velocity channels (VLSR≃−30 to +10 km s−1). After that, we simultaneously mapped, for each epoch, seven fields of 4096×4096 pixels × (200 velocity channels) with a cell-size of 0.1 mas to image, with the full angular resolution, the space–velocity regions identified with lower angular resolution in the previous step. In this way, about 1800 maser spots for each epoch were identified, most of them unresolved, obtaining their positions by fitting a two-dimensional Gaussian profile (we define a maser spot as emission occurring at a given velocity channel and distinct spatial position). The rms noise level of the individual channel maps ranges from ∼5 to 400 mJy beam−1, depending on the intensity of the maser components present in each velocity channel. For the identification of the maser spots a signal-to-noise (S/N) ratio ≳8 was adopted as the detection threshold. From this S/N ratio and the beam size of 0.4 mas, we estimate that the accuracy in the relative positions of the spots within each epoch is better than 0.03 mas.
In general, VLBA proper motion measurements of water masers are limited by the high time variability of their flux density. The standard method is to phase reference to a particular strong maser spot, as the one used here for self-calibration (see above). However, the selected reference spot may have its own proper motion, which therefore results in arbitrary offsets in the proper motions for the whole system. For the measurement of proper motions of water masers presented in this paper (Section 3), we defined a more ‘stationary’ reference frame, by identifying nine strong masers (≳1 Jy) with different LSR velocities, spread over the full region of ∼4 arcsec size where maser emission is detected, and persisting in the five observed epochs. The new reference position is defined as the mean position of these nine strong masers. We calculated this mean position for each epoch, and assuming that it is stationary, we realigned all epochs with respect to it. After that, all the offset positions presented in this paper are with respect to the nominal position of HW2 [ ; C2006]. In the following section we present the main results obtained towards HW2 and HW3d. All the proper motion values given in this paper have been determined considering the first four epochs, which are grouped in a short time-span of 2 months, thus minimizing variability effects. The fifth epoch, separated from the fourth one by four and a half months, has been used to confirm trends in the derived proper motions, but not in their explicit calculation.
3 RESULTS AND DISCUSSION
In Fig. 1 we show the positions and radial velocities (LSR) of the water maser spots detected with the VLBA in the five observed epochs (hereafter VLBA 2001–2002 data set). In this figure we also show the 1.3-cm continuum and water maser sources observed previously with the VLA (hereafter VLA 1995 data set; Torrelles et al. 1998, hereafter T98), as well as the water masers observed in 1996 with the VLBA (hereafter VLBA 1996 data set; T2001a,b). The alignment of the different data sets (VLA 1995, VLBA 1996, and VLBA 2001–2002) has been made by their absolute coordinates. The accuracy of this simple alignment is better than 0.05 arcsec, which is good enough for a general comparison between the different data sets at the scale shown in Fig. 1. In this figure we have also labelled several subregions ‘R’ (using the naming convention of T2001a,b and Gallimore et al. 2003). We can see that the spatio-kinematical distribution of the masers around HW2 and HW3d traced by the different data sets coincides quite well at scales >rsim1 arcsec (≳700 au), without major changes over the 1995–2002 period. This implies that both the surrounding interstellar medium and the exciting sources of the water masers have been relatively stable over these spatial and temporal scales.

Positions of the water maser spots measured with the VLA 1995 (beam size ≃80 mas; T98), VLBA 1996 (beam size ≃0.5 mas; T2001a,b) and VLBA 2001–2002 (beam size ≃0.4 mas; this paper) data sets, overlaid on to the 1.3 cm continuum contour map showing the HW2 radio jet, and the HW3c, and HW3d radio sources (beam size ≃80 mas; T98). Colour code indicates the LSR radial velocity (km s−1) of the individual maser spots. Different subregions ‘R’ discussed in this paper are numbered (see Sections 3.1, 3.2 and 4, and Figs 2–4). Offsets positions are referred with respect to the HW2 position,  (C2006).
The water masers associated with HW3d are mainly located at the border of the radio continuum emission as seen in the two VLBA data sets (1996 and 2001–2002; Fig. 1). These masers cover a velocity range VLSR≃− 16 to +8 km s−1, with intensities from ∼0.03 to 130 Jy beam−1 (brightness temperatures up to ∼2 × 10¹² K), and showing a more compact distribution (within ∼0.1 arcsec radius, ∼70 au) than the masers around HW2 (Fig. 1). Contrary to the masers around HW2, the masers spatially associated with HW3d show no evidence of any clear linear/arcuate structure, any velocity segregation as a function of position, nor clear proper motions. The association of intense water masers with HW3d further supports the observation that this source harbours an internal young massive star (early B star) as suggested by Garay et al. (1996), although perhaps less evolved than HW2 because of the compactness of both the 1.3-cm continuum emission and the cluster of masers.
With regard to the masers around HW2, large changes are observed at scales ≲0.1 arcsec (70 au) in the linear/arcuate water maser structures found in the earlier VLBA 1996 data, including the disappearance of the R1 linear structure in the VLBA 2001–2002 data, and the evolutionary changes of the R4 and R5 expanding arcuate structures. In addition, we detected new maser structures labelled as R6, R7 and R8 in Fig. 1 that were not seen in the previous VLBA 1996 data set. In what follows (Sections 3.1, 3.2), we present and discuss all these results obtained with the VLBA 2001–2002 data set, analysing the spatio-kinematical distribution of the masers in the different subregions, including proper motion measurements.
3.1 Spatio-kinematical distribution of the R6, R7 and R8 maser structures
R6. This remarkable linear structure, with a velocity range VLSR≃− 18 to −11 km s−1 and intensities from ∼0.03 to 14 Jy beam−1, is located ∼0.8 arcsec (580 au) east of HW2 (Fig. 2), and persists as a whole in the five epochs of the VLBA 2001–2002 data set (R6 was also detected by Vlemmings et al. 2006 in their single epoch observations carried out in 2004 with the VLBA). This linear structure (Fig. 2) is oriented north-east–south-west [position angle (PA) ≃ 66°]; has a size of ∼100 mas in length (this is, ∼250 times larger than the VLBA beam); and is formed by 2–3 roughly parallel ‘layers’ in each one of the individual observed epochs, with the ‘upper layer’ blueshifted (VLSR≃− 16 km s−1) with respect to the ‘lower layer’ (VLSR≃− 13 km s−1). In addition, an LSR radial velocity gradient of ∼4–5 km s−1 over a scale of 0.1 arcsec (∼0.06 km s−1 au−1) is observed along the linear structure, with more redshifted velocities towards the edge closer to HW2, and more blueshifted velocities outward (this is more clearly seen in the ‘lower layer’; Fig. 2). The entire linear structure shows a transversal motion in the sky, with a proper motion of ∼13 km s−1 towards the south-east (PA ≃ 118°; see Fig. 2 and the animation in the Supporting Information section).
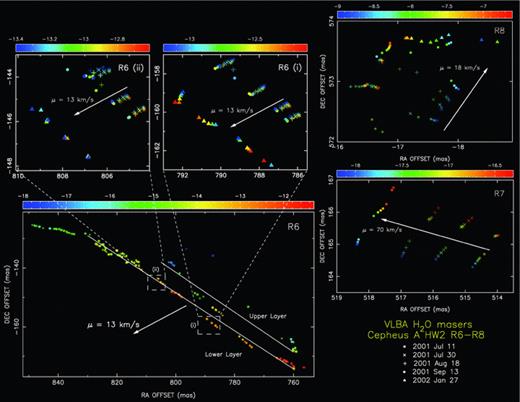
Positions of the water maser spots measured in subregions R6, R7 and R8 in the five epochs of the VLBA 2001–2002 data set (see also Fig. 1). These masers were not detected in the VLBA 1996 data set (T2001b). Each of the five epochs is represented by a different symbol. Colour code indicates the LSR radial velocity (km s−1) of the individual spots. Proper motions are clearly seen in all these subregions (solid arrows indicate the mean values and directions of these motions in the sky). For the structure R6 (bottom left), we have only drawn the positions measured in the first epoch to show more clearly its linear structure and the two parallel layers discussed in the text, although close-ups of two small sections including the five epochs are also shown. See also the animations in the Supporting Information showing the motions of the masers in the sky.
R7. This structure is detected in the first four epochs of the VLBA 2001–2002 data set at ∼0.6 arcsec (400 au) north-east of HW2. It is located in between R6 and R8 (Figs 1 and 2), forming a linear structure oriented north-west–south-east (Fig. 2), with the masers having radial velocities in the range VLSR≃− 18 to −16 km s−1 and intensities from ∼0.03 to 0.25 Jy beam−1. Interestingly, while keeping both its radial velocity distribution and linear structure, it increases progressively its linear size as a function of time, from 1.3 mas (0.9 au) to 1.7 mas (1.2 au), 1.9 mas (1.4 au) and 2.1 mas (1.5 au), for the first, second, third and fourth epoch, respectively. There is also a clear LSR radial velocity gradient of ∼1 km s−1 mas−1 (1.4 km s−1 au−1) along the linear structure seen in all the observed epochs, with more redshifted velocities at the north-western parts (Fig. 2). Furthermore, the entire R7 linear structure is moving in the sky towards the north-east (PA ≃ 74°; i.e. nearly perpendicular to the direction of the linear structure), forming a relatively fast opening outflow with proper motions of ∼70 km s−1 (see Fig. 2 and the animation in the Supporting Information section). These motions are a factor of ∼5 larger than the proper motions observed in R6 and R8 (see below) and present a significantly different direction. On the other hand, R7 moves with a proper motion ∼7 times smaller than those observed in the ionized jet with PA ≃ 45° (C2006).
R8. It is located ∼0.6 arcsec (400 au) north of HW2, with their masers having radial velocities in the range VLSR≃− 9 to −7 km s−1 (intensities from ∼0.05 to 5 Jy beam−1) persisting in the five observed epochs. In this region, the masers show no clear linear/arcuate structures (except for the linear structure observed in epoch 3, Fig. 2), nor a clear radial velocity gradient. However, maser motions in the sky are clearly seen towards the north-west, with values of ∼18 km s−1 (PA ≃− 35°; Fig. 2 and the animation in the Supporting Information section). These proper motion values, while significantly smaller than those measured in R7, are of the order of those measured in R6 but with different orientation (Fig. 2).
The general properties of the masers in R6–R7–R8 can be explained within a shock interaction scenario within the disc–HW2–outflow system, with the simultaneous presence of a fast highly collimated jet and a slower wide-angle outflow associated with the massive protostar HW2 (see below, Section 4). Masers in the R6–R7–R8 structures appear globally blueshifted (VLSR≃− 18 to −7 km s−1) with respect to the velocity system of the circumstellar disc associated with HW2 (VLSR≃− 7 to −3 km s−1; Patel et al. 2005; Jiménez-Serra et al. 2007, 2009). We attribute this global blueshift of the R6–R7–R8 masers to the fact that they are located on the blueshifted lobe of the more extended (∼1 arcmin ) north-east–south-west bipolar molecular (HCO+) HW2 outflow (Gómez et al. 1999) and therefore they present an additional (global) blueshifted component also moving towards the observer.
3.2 Evolution of the R5 and R4 arcuate maser structures
R5. This subregion contains the arc structure detected by T2001a,b with the VLBA 1996 data set. In those data, the R5 arc structure, with a size of ∼100 mas (700 au), defined a circle of radius ∼60 au with an accuracy of one part in a thousand. It expanded at ∼9 km s−1, and was interpreted by these authors as caused by a short-lived episodic spherical ejection of material (dynamical time-scale of ∼30 yr) from a massive young star located at the centre of the fitted circle. In fact, after the recognition of this maser structure, Curiel et al. (2002) detect a very weak 3.6-cm-continuum source (∼0.2 mJy) towards the centre of the circle (∼0.6 arcsec south of HW2), and they propose it to be a candidate for the excitation of the R5 masers. However, the nature of this faint centimetre-continuum source is still unknown (e.g. we do not know its spectral index yet).
In Fig. 3, we show the spatio-kinematical distribution of the masers as observed with the VLBA 2001–2002 data set in R5. A coordinate alignment with the VLBA 1996 data set was made assuming that the strongest maser within the R5a group (VLBA 2001–2002 data set; Fig. 3) corresponds to the strongest maser within the group labelled as R5-V (VLBA 1996 data set; fig. 6 of T2001b), both having similar velocities (VLSR≃− 8.5 km s−1). For a proper alignment, we estimated the position that the strong maser in R5-V (VLBA 1996 data set) should have had in the VLBA 2001–2002 data set, assuming that the proper motions of the expanding structure (9 km s−1) remained constant over the whole time period. The final alignment resulted in RA and Dec. shifts on the VLBA 1996 data set of −25 and −10 mas, respectively. The value of this shift is smaller than the estimated error of the simple alignment by the absolute coordinates (∼50 mas). We point out that this alignment is only valid for general description/comparison purposes between the different VLBA 1996 and 2001–2002 data sets, but not for detailed studies. This caution arises because we cannot be sure that the individual maser spot selected for the alignment is the same maser spot that has persisted during the large time-span of 5 yr.
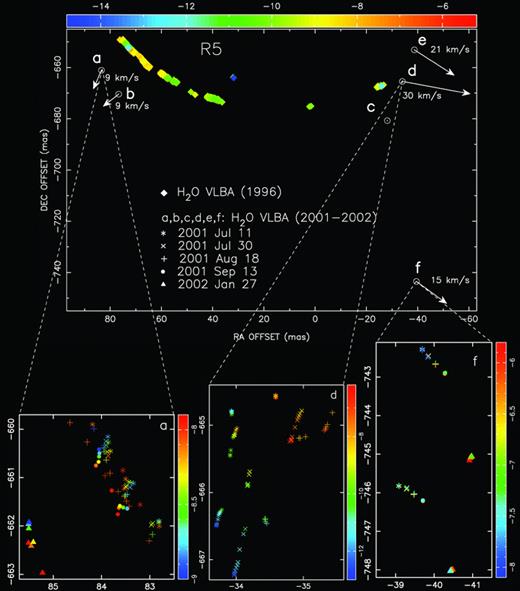
Spot positions measured in the five epochs of the VLBA 2001–2002 data set in subregion R5 (see Fig. 1). Six groups of masers are detected (a, b, c, d, e, f), some of them (a, d, f) shown as a close-up. Colour code indicates the LSR radial velocity (km s−1) of the spots. The R5 arc structure observed with the VLBA 1996 data (T2001a,b) is also shown in the upper panel. Vectors indicate the direction and values of the mean proper motions measured in the a, b, d, e and f maser groups (proper motions were not measured in c). See the animation in the Supporting Information showing the motions in the sky of these maser groups.
With the new VLBA 2001–2002 data set, we note that the R5 maser structure has persisted during 5 yr, although its spatial morphology has significantly changed over this time-span. In these new data we identify six regions that we label as R5a–f (Fig. 3). Regions R5a, R5b and R5c apparently correspond to the expansion of the ring, while most of the arc structure observed in 1996 is not present in the 2001–2002 data. In addition, new ‘subgroups’ of masers have appeared, labelled in Fig. 3 as R5d and R5e to the west, and R5f to the south-west. Interestingly, the maser emission detected with the VLBA 2001–2002 data set covers approximately the same radial velocity range as in 1996 (VLSR≃− 15 to −5 km s−1; Sν≃ 0.03 –16 Jy beam−1), and the directions of the proper motions are consistent with those previously observed. In fact, while the groups of masers in the eastern part of the R5 structure (R5a and 5b; Fig. 3) are moving towards the south-east, with proper motion values of ∼9 km s−1, the group of masers to the west (R5c, 5d, 5e and 5f) are moving towards the south-west, with proper motion values of ∼15–30 km s−1. These properties led us to conclude that we are indeed observing the same expanding structure as that reported by T2001a,b, but that this structure is undergoing a distortion in its expansion through the circumstellar medium, losing its previous degree of symmetry.
Different scenarios have been proposed to explain the R5 structure, one of which is the above-mentioned short-lived episodic spherical ejection of material from a YSO (which is not predicted by current star formation theories) and, alternatively, that the maser structure corresponds to a shocked layer of ambient molecular material around an expanding HII region (see Curiel et al. 2006; Lizano 2008). In both scenarios, the spherical molecular shell evolution could be affected by internal instabilities and by ambient inhomogeneities during its expansion, as observed in R5. In any case, the dissipation of the R5 structure in the ambient medium corroborates the short-lived nature of this phenomenon.
R4. A remarkable, arcuate structure of ∼35 mas size (25 au) with proper motions of 10–30 km s−1 was observed in this subregion with the VLBA 1996 data set (∼0.17 arcsec south of HW2; Fig. 1). This arcuate structure had the highest LSR radial velocity dispersion of all the observed maser structures in Cepheus A, and was interpreted as a bow shock moving towards the north-west excited by the wind of an energy source other than HW2 (T2001b). Gallimore et al. (2003), through Multi-Element Radio-Linked Interferometer Network (MERLIN) water maser observations on 2000 April 9, also detected this structure, and found a displacement of ∼16 mas towards the north-west between the arc observed in 1996 (VLBA) and 2000 (MERLIN), corresponding to proper motions of ∼4 mas yr−1 (14 km s−1). Furthermore, these authors find that the displacement of the arc is compatible with expansion about a common centre, proposing that the R4 arcuate structure is part of an expanding elliptical ring (rather than a simple bow shock) driven by a wind from a still unidentified central massive YSO. In this scenario, the elliptical ring would be produced by a shock wave propagating through a rotating disc surrounding the YSO.
The VLBA 2001–2002 water maser observations show that the R4 arcuate structure is persisting 5 yr after its first detection, with the emission covering a line-of-sight velocity range VLSR≃− 27 to +7 km s−1 and with a range of intensities ∼0.03–100 Jy beam−1 (among the most intense of the region, together with R5). In Fig. 4 we plot together the VLBA 1996 and 2001–2002 maser spots using the same alignment explained above for R5. The VLBA 2001–2002 masers trace a nearly elliptical patchy ring of ∼70 mas size (50 au; PA ≃− 30°), with most of the masers detected in the previous epochs of the VLBA 1996 data set located inside the ring (see upper panel of Fig. 4). This ring, which was only partially visible in the VLBA 1996 data set (T2001b), is similar in size and orientation to that found by Gallimore et al. (2003) with MERLIN (epoch 2000; see their fig. 7). The most clearly defined part of the ring is the north-western R4 arcuate structure, which in 5 yr has moved ∼25 mas towards the north-west. This corresponds to a proper motion of ∼15 km s−1, consistent with the values measured with the VLBA in the 1996 epoch (∼10–30 km s−1) as well as with the value measured by Gallimore et al. (2003) from VLBA 1996 to MERLIN 2000 (∼14 km s−1). These proper motions are better appreciated in the lower panel of Fig. 4, where we show a close-up of the arc structure. A progressive spatial displacement is clearly distinguished, both in the three epochs of the VLBA 1996 observations (T2001b), as well as in the five epochs of our new VLBA 2001–2002 observations. With our present data we cannot establish if the expanding motions have been accelerating or decelerating during this time-span of 5 yr. More recent VLBA water maser observations carried out in 2004 by Vlemmings et al. (2006) suggest that the ring structure (with much less detected spots) has suffered a strong deceleration 8 yr after its first detection, probably due to mass loading as matter is swept up during the expanding shock-wave. However, the morphology of R4 is complex, showing several ‘shells’ in our 2001–2002 data (see Fig. 4) and we cannot rule out that we are seeing different features produced by multiple ejections in the different epochs. From the size of the ring (∼50 au), and assuming a constant expansion velocity of ∼15 km s−1, we estimate a dynamical time-scale of ∼8 yr for R4.
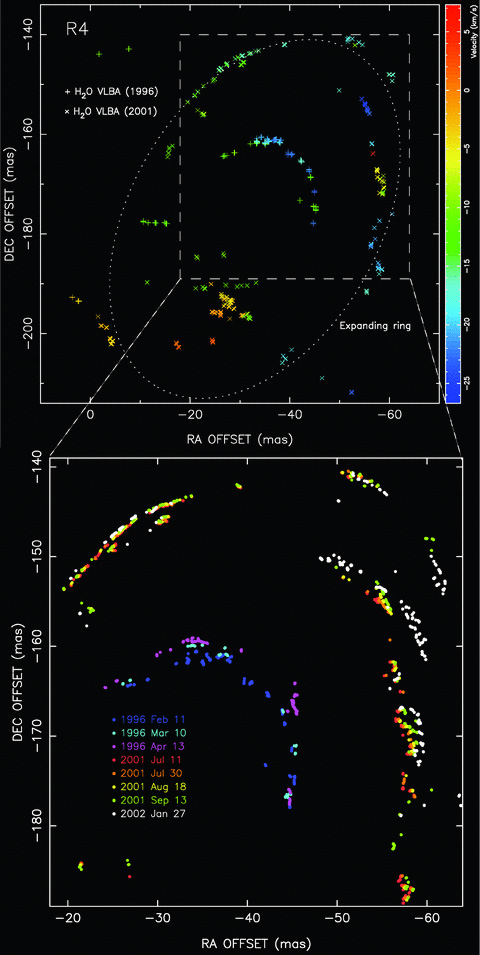
Upper panel: Spot positions measured with the VLBA 1996 (T2001b) and 2001–2002 (this paper) in subregion R4 (see also Fig. 1). Colour code indicates the LSR radial velocity (km s−1) of the spots. In this panel only the epochs of 1996 February 11 and 2001 September 13 are plotted. The VLBA 2001–2002 masers trace in the sky an expanding elliptical ring (dotted line). Lower panel: Spot positions measured in all the observed VLBA epochs (represented by dots with different colours), showing progressively the expanding motions in the sky. From 1996 to 2001–2002, the R4 structure has moved ∼25 mas, which represents proper motions of ∼5 mas yr−1 (15 km s−1). The alignment of the 1996 and 2001–2002 data sets is the same than the alignment explained in Section 3.2 to plot the masers in Fig. 3. See also the animation showing the motions in the sky.
Our new VLBA water maser observations give better support to the expanding ring scenario driven by a central YSO, as proposed by Gallimore et al. (2003), rather than supporting a simple bow-shock scenario (T2001b). It is important to point out that the method of alignment between the different data sets used here (see above) has been different and independent of the method used by Gallimore et al. (2003) to compare the 1996 (VLBA) and 2000 (MERLIN) data sets (these authors assumed that the proper motion of the expansion centre of the R4 ring is negligible), but with very similar final results, reinforcing the idea that the expanding motions have been originated truly at the centre of the ring. With our data we estimate that the central YSO driving the expanding motions of the R4 structure should be located at a position offset by (−0.03 arcsec, −0.18 arcsec) from HW2.
Given the patchy ring structure, with the masers to the north-west showing a more regular distribution than the ones to the south-east (Fig. 4), an alternative explanation for the R4 structure could be that this is an expanding reverse shock where an external wind (from HW2) is interacting with a small dense clump located at the centre of the structure (reverse shocks have been predicted by Parkin et al. 2009 within wind–cavity interactions in massive YSOs). However, although we cannot discard this possibility, the fact that the masers in R4 show the highest LSR radial velocity dispersion of all the maser structures in the region, well differentiated from the others and with very high flux densities, led us to favour that they have been excited by a close massive YSO other than HW2 through some kind of violent ejection event.
According to the current literature, we did not find any known source at the centre of the R4 structure. The detection of this source is mandatory to ascertain its nature and test the expanding ring scenario. We think that the future e-MERLIN and EVLA instruments, with a continuum sensitivity improvement over the VLA by a factor of ∼10, will be well suited to reach this goal.
4 JET AND WIDE-ANGLE OUTFLOWS IN HW2
Since the first bipolar molecular outflows and highly collimated jets from YSOs were discovered (Rodríguez, Moran & Ho 1980; Snell, Loren & Plambeck 1980; Mundt & Fried 1983), one of the main issues that immediately arose was to know their driving and collimating mechanism, as well as to ascertain the relationship between molecular outflows and jets. Multiple observations towards low-mass protostars show that when highly collimated high-velocity jets are detected (usually in visible or radio continuum wavelengths), they are enclosed within relatively low-velocity outflows with a wide opening angle (usually observed in molecular line transitions). Some clear examples of the simultaneous presence of a jet and a wide-angle outflow in low-mass YSOs can be found in L1551 (Itoh et al. 2000), HH 46/47 (Velusamy et al. 2007), HH 211 (Hirano et al. 2006) and IRAS 04166+2706 (Santiago-García et al. 2009); see also Machida et al. (2008), and references therein. Various theoretical models have been developed to explain these outflows and their relationship in low-mass YSOs, archetypal among them are the ‘X-wind’ and the ‘Disc-wind’ models. In the X-wind model, the primary wind is driven magnetocentrifugally from the interface between the magnetosphere of the YSO and the associated circumstellar disc. The primary wind has an angle-dependent density distribution, with a dense axial jet surrounded by a more tenuous wide-angle wind. The morphology of both the observed highly collimated jets and the wide-angle molecular outflows are explained through the interaction of the primary wind with the ambient gas (e.g. Shu et al. 1994; Shang et al. 2006). On the other hand, in the Disc-wind model the highly collimated wind is driven magnetocentrifugally from a wide range of circumstellar disc radii, surrounded by a wide-angle wind driven by toroidal magnetic pressure during the evolution of a rotating collapsing magnetized molecular core (e.g. Banerjee & Pudritz 2006). Recently, Machida et al. (2008) follow, through MHD simulations, the evolution of a collapsing cloud, until protostar formation takes place. These authors find two distinct flows with different degrees of collimation and velocities: a low-velocity wide-angle outflow, magnetocentrifugally driven from the circumstellar disc, and guided by hourglass-like field lines, and a fast highly collimated outflow driven by magnetic pressure and guided by straight field lines near the protostar. The main difference in terms of observational predictions between the Machida et al. and the other models is that in the former, both high-velocity and low-velocity outflows are naturally explained. All these models are very valuable as a first step to understand both the driving agent of the primary wind(s) and the simultaneous presence of highly collimated jets surrounded by wide-angle outflows observed in low-mass YSOs. Current observations, however, do not have enough angular resolution and sensitivity to resolve the launching region of the primary wind(s) at scales of a few au, and therefore it is not possible to discriminate between the different models proposed (see the review by Ray et al. 2007).
The VLBA multi-epoch water maser observations towards the HW2–disc system show now, for the first time in a high-mass YSO, and similar to what is observed in low-mass YSOs, the simultaneous presence of a high-velocity jet surrounded by a wide-angle outflow in the HW2–disc system at scales ≲600 au. This is inferred from the observation of the R6, R7 and R8 masers (Section 3.1). These masers are located (in projection) near the north-east edge of the HW2 dust disc, as observed with the SMA by Patel et al. (2005). Their location and motions suggest that they are associated with the blueshifted, north-east lobe of the HW2 bipolar molecular (HCO+) outflow (Gómez et al. 1999), tracing wide-angle movements. In fact, while R6 and R8 (which are located at both sides of R7; Figs 1 and 2) exhibit motions in the sky almost in opposite directions (R6 towards the south-east with PA ≃ 118°, and R8 towards the north-west with PA ≃− 35°), R7 shows faster motions towards the north-east (PA ≃ 74°), along a direction closer to the jet axis, with a difference in position angle of ∼30° with respect to the highly collimated HW2 radio jet (PA ≃ 45°) (see Figs 1 and 2). All these properties can be explained in a shock interaction scenario within the disc–HW2–outflow system. In this scenario, outlined in Fig. 5, we propose that R6 and R8 represent emission fronts from the walls of expanding cavities of the circumstellar gas around HW2, created and shocked by a wide-angle primary wind from this source (outflow opening angle ∼102°). We also propose that the linear structure R6 (VLSR≃− 11 to −18 km s−1, blueshifted with respect to the ambient cloud; Section 3.1) is the counterpart of the R1–R3 linear structure (VLSR≃− 10 to +1 km s−1, redshifted; T2001b) located in the opposite side (to the west of HW2; Fig. 1). This structure was interpreted previously as produced in the shocked walls of an expanding cavity (T2001b). In fact, although both linear structures (R6 and R1–3) have similar orientations, their proper motions are almost in opposite directions (R6: μ≃ 13 km s−1 at PA ≃ 118°; R1: μ≃ 5 km s−1 at PA ≃− 55°). Furthermore, in R6 there is an LSR radial velocity gradient of ∼4–5 km s−1 along the filament, with more blueshifted velocities away from HW2 (Fig. 2), and in R1 there is also an LSR radial velocity gradient of ∼2 km s−1 along the filament with the same trend, more redshifted velocities away from HW2 (T2001b). These velocity gradients with the same trend in R6 and R1 can be explained by the acceleration of maser gas at the walls of the cavities by the wide-angle primary wind from HW2.
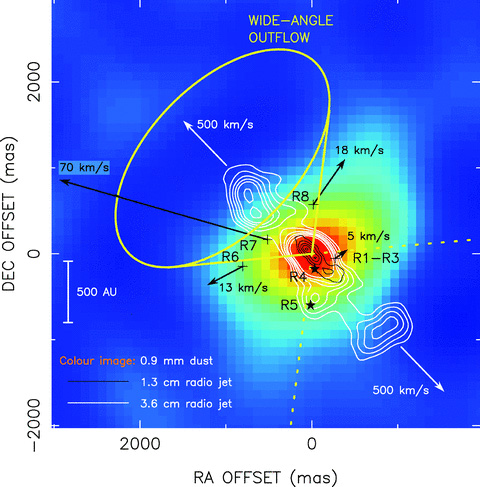
Wide-angle outflow and jet scenario in HW2. The dust continuum disc of HW2 (Patel et al. 2005) is shown in this figure as a colour image superposed to the highly collimated radio jet (Torrelles et al. 1996, hereafter T96; C2006). The radio jet, with an outflow opening angle of ∼18°, exhibits ejections in opposite directions moving away at ∼500 km s−1 from the central source (C2006). R6, R8 and R1–3 trace emission fronts from the walls of the expanding cavities, created and shocked by the wide-angle primary wind of HW2 (opening angle ∼102°). The R7 masers, with motions along an axis at an angle of ∼30° with respect to the radio jet axis, are excited inside the cavity by a wide-angle primary wind. They exhibit larger motions than R6, R8 and R1 located at the expanding cavity walls, but lower than the motions of the radio jet. The R6, R7 and R8 masers are blueshifted with respect to the systemic velocity of the circumstellar disc, while R1–3 are redshifted. The north-eastern part of the wide-angle outflow is directed towards us, as indicated by the blueshifted motions observed in that direction of the more extended (∼1 arcmin) bipolar molecular outflow (Gómez et al. 1999) and the R6–R7–R8 water maser motions. The position of the two nearby massive YSOs required to excite the R4 and R5 arcuate maser structures are indicated by star symbols (see text). The star associated with R4 is not yet detected. Note that the arrows indicating the motions of the radio jet are shown much smaller than those of the water masers.
On the other hand, the higher motions of the R7 masers along a direction closer to the main axis of the HW2 radio jet suggest that the interaction of the wide-angle primary wind from HW2 with the molecular gas is within the cavities, through a less slowed-down ambient medium. As seen in Section 3.1 and Fig. 6, the expanding motions of the masers form a fan-like structure at very small scales (∼4 mas, ∼3 au). By means of a linear fitting of the average positions of each of the linear structures observed in the different epochs of R7, we find that the line joining these average positions (hereafter central line; Fig. 6) is pointing back towards the HW2 position within ∼20 mas. A linear fitting of the positions of each of the two edges of the R7 structures at different epochs gives two lines that intersect at (Δα, Δδ) ≃ (509.1 mas, 163.2 mas), almost exactly (within ∼0.3 mas!) on the central line, but much closer to the position of the detected maser emission than to that of HW2. From these values we estimate a dynamical time-scale of ∼0.3 yr for the expanding structure. These results suggest that the R7 masers, which are moving along a direction with a difference angle of ∼30° with respect to the main axis of the radio jet, are excited by the HW2 wide-angle primary wind via interaction with small clumps of gas within the cavity, accelerated and beginning to expand in a short-lived event. In fact, we note that R7 is not detected in the fifth epoch of the VLBA 2001–2002 data set, 6 months after its first detection, consistent with the short dynamical time.
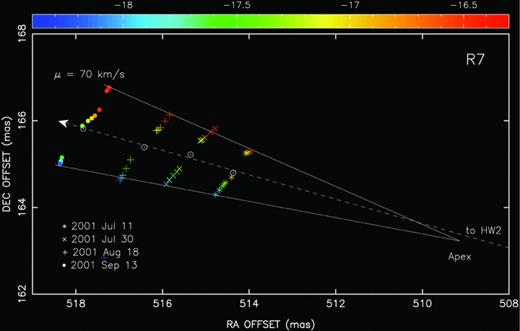
Fan-like water maser structure formed by the expanding motions of the R7 linear structure at scales of ∼4 mas (3 au). The continuum lines indicate the linear fitting of the outer water masers of the fan-like structure (see Section 4). The dashed line indicates the linear fitting of the average positions (open circles) of each of the linear structures observed in the different epochs. This central line points to HW2 within ∼20 mas. The apex of the fan-like structure is almost exactly on this line (within ∼0.3 mas), but much closer to the position of the detected maser emission than to that of HW2. The water maser structure, while moving towards the north-east, presents an LSR radial velocity gradient (colour code in km s−1) along the linear structure, suggesting that it is caused by a rotation (see Section 4).
In addition, the LSR radial velocity gradient of ∼2 km s−1 observed along the linear structure of R7, with more redshifted velocities towards the north-western part (Figs 2 and 6), could trace a rotating outflow from HW2, extracting angular momentum from the disc. In fact, an LSR radial velocity gradient of ∼5 km s−1 is observed along the major axis of the rotating disc of HW2, with more redshifted velocities also towards the north-west (Patel et al. 2005; Jiménez-Serra et al. 2007, 2009). This LSR radial velocity gradient was also observed in the H2O masers of the VLA 1995 data set (T96), with more redshifted velocities towards the north-west, although it is less evident in the VLBA 1996 and VLBA 2001–2002 data sets (Fig. 7). However, with the present data we cannot distinguish whether the observed velocity gradient in the linear structures of R7 is due to a rotating outflow or due to intrinsic velocity shifts in the surrounding ambient molecular gas, before the interaction with the HW2 primary wind. To differentiate clearly between these two possibilities it would be necessary to detect another fan-like water maser structure in the opposite side, to the south-west of HW2, with similar velocity gradients. We also note that even if the velocity gradient observed in the masers of R7 has a rotation origin, it seems that now the structure is not conserving angular momentum, because even when it expands significantly between the four epochs, the total velocity difference for any given epoch remains approximately constant (see Fig. 6). If we had a structure with angular momentum conservation, this total velocity difference would have to diminish with expansion. Most likely, the features constituting R7 are at present moving ballistically.
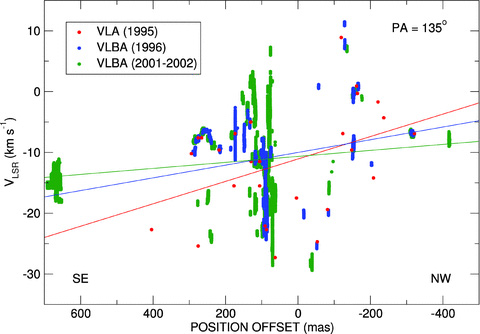
Position–LSR radial velocity distribution of the H2O masers as observed with the VLA 1995 (red dots), VLBA 1996 (blue dots) and VLBA 2001–2002 (green dots) data sets along an axis with PA = 135° (perpendicular to the main axis of the HW2 radio jet). Position offsets are with respect to the HW2 position. Masers with a broad velocity distribution (∼30 km s−1) with position offsets ∼70 mas correspond to the R4 structure. Masers associated with R5 (∼0.6 arcsec south of HW2) have not been plotted here. Colour lines indicate the linear fitting of the position–velocity distribution of all the masers for the VLA 1995 (red), VLBA 1996 (blue) and VLBA 2001–2002 (green) data sets. A velocity gradient is observed in the VLA 1995 data set, with more redshifted velocities towards the north-west. This gradient, although still present, is less evident in the VLBA 1996 and VLBA 2001–2002 data sets (see Section 4).
The scenario proposed to explain the R6, R7, R8 and R1-3 structures in HW2 is similar to what was proposed by Moscadelli, Cesaroni & Rioja (2005) to explain the conical outflow in the high-mass object IRAS 20126+4104 (also observed through VLBI multi-epoch water maser observations). The main difference is that while in IRAS 20126+4104 the masers were observed to be tracing an outflow with an opening angle of ∼34°, in HW2 the masers trace a wider outflow (opening angle of ∼102°) with expanding cavities surrounding the radio continuum jet (opening angle of ∼18°).
We also considered the possibility that the R6, R8 and R1–3 masing regions could be associated with the far wings of a bow shock driven by a collimated jet (i.e. the jet observed in radio continuum) with successive working surfaces produced by an outflow variability, in the absence of a wide-angle wind, as proposed for the low-mass protostar XZ Tau (Krist et al. 2008). A working surface is formed in a supersonic flow (in this case, the jet) as a result of a supersonic increase in its ejection velocity. High-velocity material catches up with the previously ejected, lower-velocity flow, forming two shocks: a leading one which accelerates the lower-velocity flow and a reverse shock which decelerates the higher-velocity material ejected at later times (for details see Raga et al. 1990). Material is constantly being accumulated between the two shocks, and part of it is ejected sideways, transferring its linear momentum to the surrounding medium (by means of a bow shock driven into this medium). However, although we cannot rule out this possibility (detailed modelling of the proper motions are required), the motions of the R7 structure along an axis at an angle of ∼30° with respect to the radio jet axis would imply the presence of a wider outflow than that indicated by the jet.
Wide-angle outflows have been observed in YSOs of all luminosities, from ∼1 to 105 L⊙ (e.g. Shepherd 2005; Qiu et al. 2009; Matthews et al. 2010). What makes our VLBA water maser results in Cepheus A HW2 highly significant is the fact that both, highly collimated and wide-angle outflows, are observed simultaneously, and at similar physical scales. Although at the moment, there are no models predicting the simultaneous presence of these two kinds of outflows in young high-mass stars, as those developed for low-mass YSOs, we think that our observational results represent an important constraint for future models on high-mass stars when trying to reproduce the scale where these outflows are observed. Future (sub)millimetre high-angular observations would also be very valuable to look for the presence of molecular (e.g. CO, SiO) conical shells associated with HW2 to have an even stronger comparison to what is observed in low-mass objects.
5 CONCLUSIONS
We have carried out VLBA multi-epoch (2001–2002 epochs) water maser observations towards the high-mass protostar Cepheus A HW2 with 0.4 mas (0.3 au) resolution. These observations show that the previously reported R5 and R4 arcuate structures (1996 epochs; T2001b) have suffered large morphological changes at scales of ≲0.1 arcsec (70 au) in a time-span of 5 yr. In particular, the R5 expanding bubble structure observed 5 yr before, located ∼0.6 arcsec (400 au) south of HW2, is currently dissipating in the circumstellar medium, losing its previous degree of symmetry, thus corroborating the very short lived nature of this phenomenon. On the other hand, the masers of the R4 structure trace a nearly elliptical patchy expanding ring of ∼70 mas size (50 au), supporting the ring scenario proposed previously by Gallimore et al. (2003), rather than the bow-shock scenario proposed by T2001b. We propose that the central YSO driving the observed expanding motions of the ring is a still unidentified source (probably a massive object given the high luminosity of the associated water masers) that should be located ∼0.2 arcsec (145 au) south of HW2.
Our water maser observations also reveal a relatively slow wide-angle outflow (opening angle ∼102°) with the simultaneous presence of the high-velocity ionized jet (opening angle ∼18°) associated with HW2. The presence of high-velocity jets, enclosed within wide-angle outflows, has been observed in low-mass protostars. The importance of our result is that this is now observed in a massive protostar, with the highly collimated and wide-angle outflow in HW2 occurring simultaneously at a similar physical scale of ∼1 arcsec (700 au). Our results provide important constraints for future models of high-mass stars that try to reproduce the different outflow opening angles observed in the Cepheus A HW2 system.
The high brightness of the masers has proven to be extremely useful to study the gas very close to young massive stars through VLBI multi-epoch observations. These observations, in addition, are revealing very short-lived events. Particularly, in Cepheus A HW2, the different water maser structures detected around this source have dynamical time-scales from 0.3 to 30 yr, with large structural changes in the time-span of years at scales of ≲0.1 arcsec (70 au), providing new insights into the study of the dynamic scenario that seems to characterize the formation of high-mass stars.
The NRAO is a facility of the National Science Foundation operated under cooperative agreement by Associated Universities Inc.
We would like to thank our referee for the very careful and useful report on our manuscript. GA, RE, JFG and JMT acknowledge support from MICINN (Spain) AYA2008-06189-C03 grant (co-funded with FEDER funds). GA, JFG and JMT acknowledge support from Junta de Andalucía (Spain). GG acknowledges support from projects FONDAP No. 15010003 and BASAL PFB-06. SC acknowledges support from CONACyT grant G0581. JC and AR acknowledge support from CONACyT grant 61547. LFR acknowledges the support of DGAPA, UNAM and of CONACyT (México). WV acknowledges support by the Deutsche Forschungsgemeinschaft (DFG) through the Emmny Noether Research grant VL 61/3-1.
REFERENCES
SUPPORTING INFORMATION
Additional Supporting Information may be found in the online version of this article:
Animations.
We provide in the form of electronic animations the water maser motions observed in R6 (Anim-R6.gif, Anim-R6-i.gif, Anim-R6-ii.gif), R7 (Anim-R7.gif), R8 (Anim-R8.gif), R1 (Anim-R1.gif, Anim-R1-i.gif, Anim-R1-ii.gif), R5 (Anim-R5.gif, Anim-R5-ab.gif, Anim-R5-cde.gif, Anim-R5-f.gif) and R4 (Anim-R4.gif, Anim-R4-zoom.gif). The colour code indicates the LSR radial velocity (km s-1) of the maser spots.
Please note: Wiley-Blackwell are not responsible for the content or functionality of any supporting materials supplied by the authors. Any queries (other than missing material) should be directed to the corresponding author for the article.
