


Abstract
An abundance analysis is presented for IRAS 18095+2704 (V887 Her), a post-asymptotic giant branch star and protoplanetary nebula. The analysis is based on high-resolution optical spectra from the McDonald Observatory and the Special Astrophysical Observatory. Standard analysis using a classical Kurucz model atmosphere and the line analysis program moog provides the atmospheric parameters: Teff= 6500 K, log g=+0.5, microturbulent velocity ξ= 4.7 km s−1 and [Fe/H]=−0.9. Extraction of these parameters is based on excitation of Fe i lines, ionization equilibrium between neutral and ions of Mg, Ca, Ti, Cr and Fe, and the wings of hydrogen Paschen lines. Elemental abundances are obtained for 22 elements and upper limits for an additional four elements. These results show that the star's atmosphere has not experienced a significant number of C- and s-process enriching thermal pulses. Abundance anomalies as judged relative to the compositions of unevolved and less-evolved normal stars of a similar metallicity include Al, Y and Zr deficiencies with respect to Fe of about 0.5 dex. Judged by composition, the star resembles an RV Tauri variable that has been mildly affected by dust–gas separation reducing the abundances of the elements of highest condensation temperature. This separation may occur in the stellar wind. There are indications that the standard one-dimensional local thermodynamic equilibrium analysis is not entirely appropriate for IRAS 18095+2704. These include a supersonic macroturbulent velocity of 23 km s−1, emission in Hα and the failure of predicted profiles to fit observed profiles of Hβ and Hγ.
1 INTRODUCTION
Stars of low and intermediate mass with initial masses between 0.8 and 8 M⊙ evolve to the asymptotic giant branch (AGB). Thanks to severe mass-loss, the AGB star evolves rapidly at nearly constant luminosity to higher effective temperatures to the white dwarf cooling track. Typical stellar lifetimes of post-AGB stars are expected to be of the order of 104 yr (Schönberner 1983). The gas lost by the AGB star forms a circumstellar shell. When the post-AGB star is cool, the dust in the shell heated by stellar radiation provides an infrared (IR) excess. When the star has traversed the top of the Hertzsprung–Russell diagram to higher effective temperatures, the circumstellar gas is ionized. The star is then said to have evolved to reach the protoplanetary nebula stage. Shortly after this, the post-AGB star has evolved to become a planetary nebula with a hot white dwarf as the central star. Determinations of the chemical composition for post-AGB star hold the potential of yielding insights into the chemical history of the AGB star and its conversion by mass-loss to its slimmer post-AGB form.
In this paper, we present a determination of the chemical composition of IRAS 18095+2704, a post-AGB star with a substantial dusty circumstellar shell. The discovery of the optical counterpart IRAS 18095+2704 was made by Hrivnak, Kwok & Volk (1987, 1988). This V = 10.4 mag star is a high-latitude F supergiant with a large far-IR excess. In the ‘Catalog of Low Resolution IRAS Spectra’ assembled by Hrivnak, Kwok & Volk (1988), the star has a peculiar IR continuum slope at wavelengths shortward of the 10-μm silicate emission feature. According to Volk & Kwok (1987), this peculiar continuum shape is a result of a detached dust shell. Observational evidence for an expanding shell came from Lewis, Eder & Terzian (1985) and Eder, Lewis & Terzian (1988) via detection of OH maser emission at 1612 and 1665/67 MHz from the Arecibo telescope. Gledhill et al. (2001) from imaging polarimetry reported an extended envelope or a reflection nebula around the star.
The pioneering study of the composition of IRAS 18095+2704 was reported by Klochkova (1995) from echelle spectra (R = 24 000) covering the wavelength ranges 5050–7200 and 5550–8700 Å. Abundances of 26 elements were obtained. The star was found to be moderately metal poor, [Fe/H]=−0.78,1 with a relative enrichment of C and N, that is  and
and  , as might be expected of a post-AGB star evolved from a C-rich AGB star. Although other elements up through the Fe peak had roughly their anticipated abundances, two results drew comment. First, there was a difference in abundances [X/H] derived from neutral and first-ionized lines of several elements, that is, differences of 1.6 dex (Ti), 1.4 dex (V), 1.0 dex (Cr) and 2.2 dex (Y). For Fe, this difference was zero, because it was the condition enforced in determining the surface gravity. Secondly, the accessible lanthanides (La, Pr, Nd and Eu) represented by ionized lines were overabundant by about [X/Fe]≃+ 0.7 relative to what is expected for an unevolved metal-poor star. Although one might attribute this overabundance to s-process enrichment expected of a post-AGB star, one notes that Eu, predominantly an r-process element, had the highest overabundance ([Eu/Fe]=+1.2), Ba was not overabundant ([Ba/Fe]=−0.2) and yttrium, the sole representative of lighter s-process species, as analysed from Y ii lines, was also not overabundant ([Y/Fe]≃ 0).
In this paper, we determine afresh the composition of IRAS 18095+2704 from echelle optical spectra: one spectrum was obtained at the W. J. McDonald Observatory and another at the Special Astrophysical Observatory (SAO). In addition to examining the unusual results noted above, we seek an interpretation of the star's composition in light of its proposed status as a slightly metal-poor post-AGB star.
2 OBSERVATIONS AND DATA REDUCTION
The McDonald spectrum for the abundance analysis was obtained on the night of 2008 August 10 (JD 245 4688.7) at the 2.7-m Harlan J. Smith reflector with the Tull cross-dispersed échelle spectrograph (Tull et al. 1995) at a spectral resolution of λ/ dλ≃ 60 000. The spectrum covers the wavelength ranges 3800–10 500 Å with no gaps in the wavelength ranges 3800–4885 and 5020–5685 Å but the coverage is incomplete but substantial beyond 5700 Å; the effective short and long wavelength limits are set by the useful signal-to-noise ratio (S/N). A ThAr hollow cathode lamp provided the wavelength calibration. Flat-field and bias exposures completed the calibration files. The S/N ranges between 40 and 90 per pixel, not only changes with the blaze function within echelle orders but also changes with star brightness between echelle orders.
The McDonald observations were reduced using the STARLINK echelle reduction package echomop (Mills & Webb 1994). The spectra were extracted using echomop's implementation of the optimal extraction algorithm developed by Horne (1986). echomop propagates error information based on photon statistics and readout noise throughout the extraction process. The bias level in the overscan area was modelled with a polynomial and subtracted. The scattered light was modelled and removed from the spectrum. In order to correct for pixel-to-pixel sensitivity variations, ‘flat-field’ exposures from a halogen lamp were used. Individual orders were cosmic-ray cleaned and continuum normalized with the bespoke echelle reduction software in IDL (Şahin 2008). Reduced spectra were transferred to the STARLINK spectrum analysis program dipso (Howarth et al. 1998) for further analysis [e.g. for equivalent width (EW) measurement]. In EW measurements, local continua on both sides of the lines were fitted with a first-degree polynomial and then EWs were measured with respect to these local continua using a fitted Gaussian profile. For strong lines, a direct integration was preferred to the Gaussian approximation. The errors for each EW measurement were determined on the basis of scatter of linear continuum fit and S/N of each measured line in the spectra. Errors on the measured EWs are calculated using the prescriptions given by Howarth & Phillips (1986).
The SAO spectrum was obtained on the night of 2009 June 10 (JD 245 2993.4) by the VK and NST with the NES echelle spectrograph mounted at the Nasmyth focus of the 6-m telescope of the Special Astrophysical Observatory (Panchuk 2007) with a 2048 × 2048 CCD with an image slicer (Panchuk 2007) and a spectral resolution of λ/ dλ≥ 60 000. A modified ECHELLE context (Yushkin & Klochkova 2005) of midas package was used to extract one-dimensional vectors from the two-dimensional echelle spectra. Wavelength calibration was performed using a hollow-cathode ThAr lamp. The wavelength coverage for the SAO spectrum was 4460–5920 Å. Measurement of EWs was carried out as for the McDonald spectrum.
The agreement between the McDonald and SAO spectra is satisfactory, that is, the two spectra are similar with respect to linewidth, depth and EW for weak to strong lines. This is shown by the section of the reduced spectra illustrated in Fig. 1. A sample of apparently unblended lines was selected from across the common wavelength interval and their EWs measured in both the McDonald and the SAO spectra. The comparison of EWs shown in Fig. 2 shows good agreement between the two sets of measurements. Across the common wavelength interval, we compare EWs from McDonald and SAO spectra, especially for lines at the limit of detection and for elements represented by just one or two lines. The SAO spectrum was used to provide lines that fell in the interorder gaps of the McDonald spectrum.
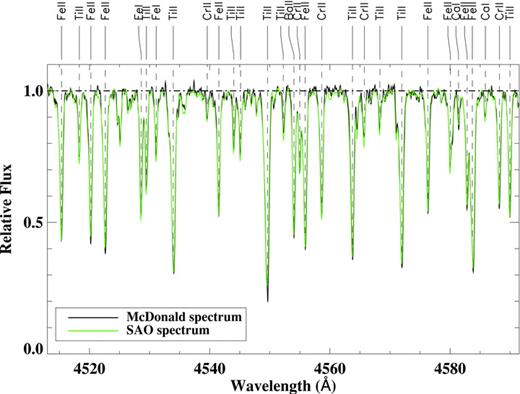
The spectrum for IRAS 18095+2704 over the wavelength region 4513–4592 Å. The McDonald spectrum is plotted in black and the SAO spectrum in green. Selected lines are identified.
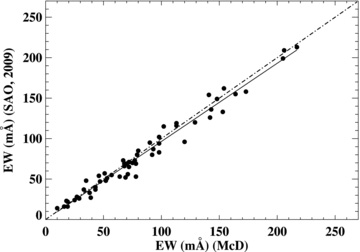
EWs for 69 lines in the McDonald spectrum versus the EWs of the same lines from the SAO (2009) spectrum. The solid line is the least-squares fit. The dot–dashed line indicates the EW quality.
3 GENERAL FEATURES OF THE SPECTRA
Although the data are sparse, the star is probably not a large-amplitude velocity variable. Klochkova (1995) reported a heliocentric radial velocity of −32.5 ± 0.4 km s−1. Hrivnak et al. (1988) reported −30 ± 2 km s−1 from an unspecified number of measurements, but added that there is ‘an indication of variability’. The McDonald spectrum gives −30 ± 1 km s−1 from the metal lines. The 2009 SAO spectrum gives −31.8 ± 1.7 km s−1. Although Lewis et al. (1985) and Eder et al. (1988) cited the heliocentric velocity as −17.4 km s−1 from their observed OH radio lines, Hrivnak (2009, private communication) indicated that this value resulted from an incorrect conversion of the local standard of rest to heliocentric velocity and a velocity of about −30 km s−1 is obtained from the OH velocities.
The Na D lines show four components. Fig. 3 shows the Na D lines from the McDonald and SAO spectra. Heliocentric velocities of the four principal components in the McDonald spectrum are listed in Table 1. The SAO spectrum gives similar velocities. Stellar photospheric Na lines at about −30 km s−1 must be largely masked by these multiple circumstellar components. Component 1, if not an interstellar component, represents an outflow at a velocity of about 12 km s−1. Components 3 and 4 are falling towards the star at velocities of about 12 and 25 km s−1, respectively.
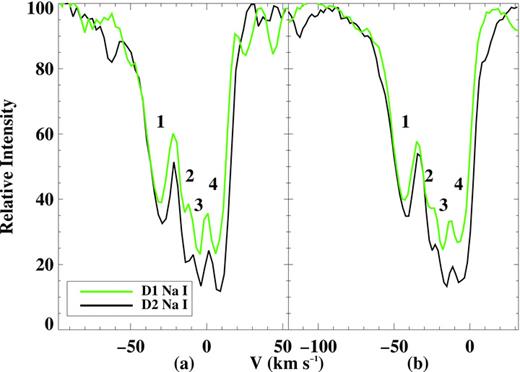
The profile of the D-lines of Na i (a) in the McDonald 2008 spectrum and (b) in the SAO 2009 spectrum of IRAS 18095+2704. Telluric H2O lines have not been removed.
Absorption components of Na i D1 (5895.923 Å) and Na i D2 (5889.953 Å) lines in the McDonald spectrum of IRAS 18095+2704.
| Component | Na i D1V⊙ (km s−1) | Na i D2V⊙ (km s−1) |
| 1 | −43.6 | −41.7 |
| 2 | −27.1 | −26.1 |
| 3 | −18.1 | −17.0 |
| 4 | −6.8 | −4.5 |
| Component | Na i D1V⊙ (km s−1) | Na i D2V⊙ (km s−1) |
| 1 | −43.6 | −41.7 |
| 2 | −27.1 | −26.1 |
| 3 | −18.1 | −17.0 |
| 4 | −6.8 | −4.5 |
Note. V⊙ denotes the heliocentric radial velocity of the components.
Weak emission in the blue and red wings of the Hα profile flanking a deep narrow absorption core was reported by Klochkova (1995, see also Tamura, Takeuti & Zalewski 1993). On the McDonald spectrum, Hα occurs at the very edge of an order, but a very shallow a deep core flanked by red emission is seen. Hβ and higher lines in the Balmer series and Paschen lines are purely in absorption. The 2009 SAO spectrum did not include Hα.
The stellar absorption lines are broad. If one accepts classical notions of microturbulence and macroturbulence, this width suggests substantial macroturbulence in the atmosphere. The microturbulence is about 5 km s−1 (see below). The instrumental width is about 5 km s−1. Correcting for the microturbulence and the instrumental width, the macroturbulence is estimated to be about 23 km s−1. This represents a highly supersonic velocity.
Strong lines clearly show asymmetric profiles with an extended blue wing. This is illustrated in Fig. 4, where the O i triplet lines at 7771–7775 Å and the Si ii 6347 Å lines are shown. The blue wing extension extends from about −25 to −50 km s−1 with respect to the photospheric velocity. Inspection of strong unblended lines shows that the blue asymmetry is also present for low-excitation strong lines (e.g. Mg ib 5167 Å, 5172 Å and Sr ii 4215 Å). This outward motion may represent the early stages of a stellar wind or inhomogeneities (i.e. stellar supergranulation) in the photosphere.
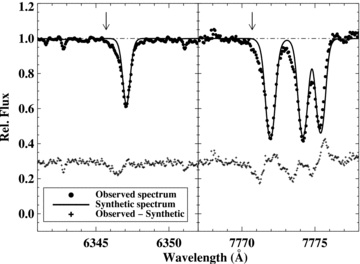
Profiles of Si ii 6347 Å line and O i 7772 Å triplet in the McDonald spectrum. The best-fitting synthetic spectra (in green) fail to account for the extended blue wings. The bottom of each panel shows the residuals shifted by 0.3 relative flux for clarity.
4 ABUNDANCE ANALYSIS – THE MODEL ATMOSPHERES AND STELLAR PARAMETERS
The abundance analysis was performed using the current version of the local thermodynamic equilibrium (LTE) stellar line analysis program moog (Sneden 1973). Model atmospheres were obtained by interpolating in the ATLAS9 model atmosphere grid (Kurucz 1993). The models are line-blanketed plane-parallel uniform atmospheres in LTE and hydrostatic equilibrium with flux (radiative plus convective) conservation. A model is defined by an effective temperature, Teff, surface gravity, g, chemical composition as represented by metallicity, [Fe/H], and a microturbulence velocity ξ of 2 km s−1.
Several of the assumptions adopted in the construction and application of the model atmospheres are of uncertain validity when considering post-AGB stars and supergiants in general. The presence of supersonic levels of macroturbulence and hints of a stellar wind seem incompatible with the assumption of hydrostatic equilibrium. Departures from LTE are probable for these low-density atmospheres. The real atmosphere is likely to depart from the uniform plane-parallel layered theoretical construction. These qualifying remarks should be borne in mind when interpreting the derived abundances.
4.1 Spectroscopy – Fe i and Fe ii lines
A standard spectroscopic method of determining the effective temperature, surface gravity and the microturbulence using Fe i and Fe ii was applied. Application of strict criteria2 in the selection of suitable lines provided a list of 31 Fe i lines with lower excitation potentials (LEPs) ranging from 0.9 to 4.5 eV and EWs of up to 224 mÅ and 11 Fe ii lines with excitation potentials of 2.8–3.9 eV and EWs of up to 154 mÅ. Only six Fe i lines have EWs greater than 150 mÅ. These lines are listed in Table 2. The gf values are taken from Führ & Wiese (2006).
Fe i and Fe ii lines used in the analysis and corresponding abundances for a model of Teff = 6500 K, log g = 0.5.
| Species | λ (Å) | EW (mÅ) | log ε(Fe) (dex) | LEP (eV) | log (gf) | RMT | Species | λ (Å) | EW (mÅ) | log ε(Fe) (dex) | LEP (eV) | log (gf) | RMT |
| Fe i | 4447.717 | 135 | 6.74 | 2.22 | −1.342 | 68 | Fe i | 5429.697 | 220 | 6.83 | 0.96 | −1.879 | 15 |
| Fe i | 4459.118 | 153 | 6.78 | 2.18 | −1.279 | 68 | Fe i | 5434.524 | 141 | 6.42 | 1.01 | −2.122 | 15 |
| Fe i | 4476.019 | 124 | 6.66 | 2.85 | −0.819 | 350 | Fe i | 5446.917 | 206 | 6.74 | 0.99 | −1.914 | 15 |
| Fe i | 4531.148 | 129 | 6.84 | 1.49 | −2.155 | 39 | Fe i | 5569.618 | 79 | 6.43 | 3.42 | −0.486 | 686 |
| Fe i | 4871.318 | 193 | 6.81 | 2.87 | −0.362 | 318 | Fe i | 5572.842 | 113 | 6.47 | 3.40 | −0.275 | 686 |
| Fe i | 4872.138 | 139 | 6.54 | 2.88 | −0.567 | 318 | Fe i | 5615.644 | 167 | 6.54 | 3.33 | 0.050 | 686 |
| Fe i | 4903.308 | 85 | 6.46 | 2.88 | −0.926 | 318 | Fe i | 5624.542 | 61 | 6.53 | 3.42 | −0.755 | 686 |
| Fe i | 4918.993 | 168 | 6.52 | 2.87 | −0.342 | 318 | Fe i | 6230.710 | 68 | 6.36 | 2.56 | −1.281 | 207 |
| Fe i | 5014.941 | 60 | 6.53 | 3.94 | −0.303 | 965 | Fe i | 6393.601 | 56 | 6.43 | 2.43 | −1.580 | 168 |
| Fe i | 5074.748 | 75 | 6.84 | 4.22 | −0.230 | 1094 | Fe i | 6411.649 | 53 | 6.61 | 3.65 | −0.718 | 816 |
| Fe i | 5090.774 | 38 | 6.69 | 4.26 | −0.440 | 1090 | Fe ii | 4472.929 | 154 | 6.74 | 2.84 | −3.530 | 37 |
| Fe i | 5216.274 | 98 | 6.66 | 1.61 | −2.150 | 36 | Fe ii | 4893.820 | 58 | 6.64 | 2.83 | −4.270 | 36 |
| Fe i | 5232.940 | 224 | 6.86 | 2.94 | −0.057 | 383 | Fe ii | 5120.352 | 63 | 6.63 | 2.83 | −4.214 | 35 |
| Fe i | 5302.302 | 72 | 6.49 | 3.28 | −0.720 | 553 | Fe ii | 5132.669 | 70 | 6.55 | 2.81 | −4.090 | 35 |
| Fe i | 5324.179 | 148 | 6.42 | 3.21 | −0.103 | 553 | Fe ii | 5254.929 | 143 | 6.64 | 3.23 | −3.227 | 49 |
| Fe i | 5364.871 | 77 | 6.59 | 4.45 | 0.228 | 1146 | Fe ii | 5256.938 | 71 | 6.79 | 2.89 | −4.250 | 41 |
| Fe i | 5367.467 | 93 | 6.49 | 4.42 | 0.443 | 1146 | Fe ii | 5325.553 | 128 | 6.50 | 3.22 | −3.220 | 49 |
| Fe i | 5369.962 | 105 | 6.45 | 4.37 | 0.536 | 1146 | Fe ii | 5432.967 | 93 | 6.68 | 3.27 | −3.629 | 55 |
| Fe i | 5383.369 | 113 | 6.35 | 4.31 | 0.645 | 1146 | Fe ii | 6147.741 | 104 | 6.40 | 3.89 | −2.721 | 74 |
| Fe i | 5393.168 | 67 | 6.40 | 3.24 | −0.715 | 553 | Fe ii | 6149.258 | 106 | 6.54 | 3.89 | −2.840 | 74 |
| Fe i | 5397.128 | 192 | 6.64 | 0.92 | −1.993 | 15 | Fe ii | 6416.920 | 93 | 6.47 | 3.89 | −2.880 | 74 |
Note. RMT is the multiplet number given by the Revised Multiplet Table (Moore 1945).
One estimate of the temperature is found from Fe i lines by excitation balance. The value for Teff is chosen so that the abundance is independent of a line's LEP. The microturbulence is determined by adjusting the ξ so that the abundances were independent of reduced EW (W/λ). For our sample of Fe i lines, these two conditions are imposed simultaneously (see Fig. 5). The microturbulence may also be determined from the Ti ii lines as they are numerous and of suitable strength. For a given model, we compute the dispersion in the Fe (or Ti) abundances over a range in ξ from 2 to 10 km s−1. In Fig. 6, the dispersion σ for Fe and Ti lines is displayed. The dispersion σ values for the Fe i and Ti ii lines are computed for two different effective temperature values: Teff = 5750 K (e.g. green curve for Fe) and 6500 K (e.g. blue curve for Ti). From the dispersion σ versus microturbulence velocity ξ plots for the Fe lines, the microturbulence velocity is found to be in the range 4.7 ≤ ξ≤ 6.0 km s−1. A minimum value of σ for the Ti lines is reached at ξ≈ 5.0 km s−1. We adopt 4.7 ± 0.5 km s−1. The solutions for ξ are not particularly dependent on the chosen Teff of the model.
![Determination of atmospheric parameters Teff and ξ using abundance [] as a function of both LEP and reduced EW [log (W/λ)]. In all the panels, the solid black line is the least-square fit to the data. The zero slope of this line is for Teff = 6500 K. The ionized (in red) iron lines were overplotted.](https://oup.silverchair-cdn.com/oup/backfile/Content_public/Journal/mnras/410/1/10.1111_j.1365-2966.2010.17467.x/1/m_mnras0410-0612-f5.jpeg?Expires=1749890201&Signature=szM1Y0V3Ns6JbUeC3n8Q5Qsm0vWkp6Oc1VcemYr18i0u7YPYPgpM0iUQRxtLlVj095lFcD-5QaB0jJVbALkg~YPYBjoztkYqlYgkXvCuSKaFvlGsQOl5NW0wG~X2Gsq8QJEMmQOTAD4DIfCy0RelvZvM3OU0Sdbz4xBZnv5VlHAwsOgyY5ft0fBZZu-mSh3zeovnd5JDoBR1OxEzEeR8nCO2eGIRsz8IUT9AUfkIdaNnIUsYoMfefegjqSr-MwjS45SozOr-Ltixa89RwvcBigCpoNLBrIl-9x45Eu6bgtsdB-HDU72xLMcB1qkI7PEAGWLc1ymp0ractz9mUEt39w__&Key-Pair-Id=APKAIE5G5CRDK6RD3PGA)
Determination of atmospheric parameters Teff and ξ using abundance [ ] as a function of both LEP and reduced EW [log (W/λ)]. In all the panels, the solid black line is the least-square fit to the data. The zero slope of this line is for Teff = 6500 K. The ionized (in red) iron lines were overplotted.

The standard deviation of the Fe and Ti abundances from the suite of Fe i and Ti ii lines as a function of the microturbulence ξ.
Imposition of ionization equilibrium for an element represented by lines from neutral atoms and singly charged ions provides a locus in the temperature–gravity plane running from low Teff and low g to high Teff and high g. Such loci are shown in Fig. 7 for Mg, Si, Ca, Cr and Fe; silicon presents a problem (see below). These loci with the (vertical) loci provided by Teff from excitation of Fe i lines and the Paschen line profiles (see below) give Teff = 6500 K and log g=+0.5 cgs, when greatest weight is given to the Fe ionization equilibrium on account of the greater number of Fe lines.
![The Teff versus log g plane showing the various loci discussed in the text. Loci include those derived from the Paschen line profiles (P11,14, dashed line), the excitation of the Fe i lines [Fe i(ext), dashed line] and the imposition of ionization equilibrium for Mg, Si, Ca, Cr and Fe.](https://oup.silverchair-cdn.com/oup/backfile/Content_public/Journal/mnras/410/1/10.1111_j.1365-2966.2010.17467.x/1/m_mnras0410-0612-f7.jpeg?Expires=1749890201&Signature=F6J0pJyK-h2~g3ekZ9LFcBVW6guzR0VB3Dt9PeVlSNOuUaI5uGlW9npVxJyqZX4a4VJd0Bz0AD1PjU8n2YBKg5O-NY6Yo954uHH5q6i79vPUnammm8BKK9bU7oz4Dl8cMXzID088roF0JOi073ZGz3aPfdAT3H8Xfbwpb8-D6a9US1eQ8MH3yF0rVPVDPfn40FySSSujyY27YtHTxzezm48UhmMRm-bKGnHp-r5tqDf-2fru3x~63huC8~fz3tydW1YWgwtqrEfc4PGctPg4RYtAb-PxJKqFIdC~hkQXOWhiak-FolBG6Y6UlbLVzjkmFKZe6XdoO1lgR4yAy~ESyQ__&Key-Pair-Id=APKAIE5G5CRDK6RD3PGA)
The Teff versus log g plane showing the various loci discussed in the text. Loci include those derived from the Paschen line profiles (P11,14, dashed line), the excitation of the Fe i lines [Fe i(ext), dashed line] and the imposition of ionization equilibrium for Mg, Si, Ca, Cr and Fe.
4.2 The Balmer and Paschen lines
In principle, Balmer line profiles offer an alternative method of estimating atmospheric parameters. For warm supergiants like IRAS 18095+2704, the Balmer lines are sensitive to Teff and insensitive to log g so that they provide an isothermal in Fig. 7. Hα is unsuited to this purpose because it shows strong emission distorting the expected deep and broad photospheric absorption profile. Both Hβ and Hγ appear to have the anticipated profiles. Predicted profiles are computed with synthe as moog does not compute synthetic profiles for the hydrogen lines. Fig. 8 shows observed and predicted profiles from synthetic spectrum calculations for Teff from 5500 to 6500 K. It is apparent that for both lines the best-fitting predicted profile corresponds to an effective temperature of around 5750 K; this estimate is almost independent of the adopted surface gravity. This temperature is significantly cooler than that suggested by the intersection of the Fe excitation temperature and the various ionization equilibria (Fig. 7).
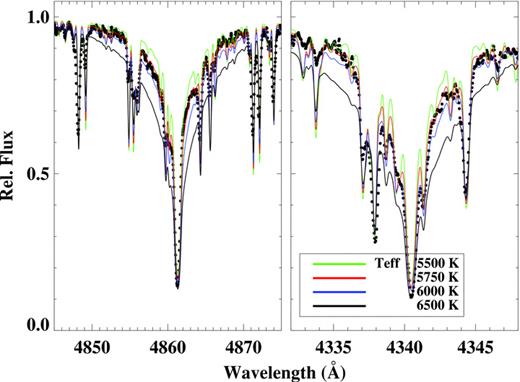
Observed and model line profiles for Hβ and Hγ. The green, red, blue and black lines show the theoretical profiles for Teff = 5500, 5750, 6000 and 6500 K, respectively, all for a surface gravity log g = 0.5 dex.
Emission in the Balmer lines may be responsible in part for a systematically lower estimate of the effective temperature. The Hα profile is very strongly affected by emission at the time of our observation. In order to provide a more complete assessment of the emission, we use the Hα profile illustrated by Khochkova (1995). The observed profile is much shallower than a profile synthesized according to the adopted atmospheric parameters (i.e. Teff = 6500 K). Obviously, emission is present across the entire profile and sharp emission just to the red of the centre hints at the presence of a P Cygni profile. An emission profile expressed as the difference between the adopted observed profile and that computed for 6500 K has the shape necessary to correct the observed Hβ and Hγ profiles to the predicted profiles also for 6500 K.
The outstanding issue is the question of the strength of the emission at Hβ and Hγ. Standard Case A (where H i in the ionized gas is optically thin, that is, of low density that Lyman photons can escape) and Case B (where H i in the ionized gas is optically thick to Lyman line photons, that is, Lyman line photons in consequence get absorbed) decrements of the recombination theory for ionized gas suggest that flux ratios might be Hα/Hβ∼ 3 and Hβ/Hγ∼ 2.5 (Osterbrock & Ferland 2006). Reduction in the Hα emission by these factors provides an emission component at Hβ and Hγ that is slightly too weak to reconcile the observed (corrected for emission) with the profile predicted for 6500 K. Additionally, the fact that Hγ and Hβ require the same low effective temperature (Teff≃ 5750 K) suggests that superposition of emission on a photospheric profile may not be the explanation. Possibly, the Balmer line profiles are influenced by an upper photosphere (a highly structured chromosphere with a developing wind?) that distorts the observed profiles in a way that cannot be modelled using Case A or Case B decrements.
Paschen lines are expected to be less sensitive to structural adjustments of the upper photosphere and to emission. Fig. 9 shows observed and synthesized profiles for a selection of Paschen lines recorded on the McDonald spectrum. Profiles for the model with Teff = 6500 K, log g=+0.5 offer a fine fit to the observed profiles. The latter are very poorly fitted with the Teff = 5750 K model suggested by the Balmer Hβ and Hγ profiles. Thus, the Paschen profiles confirm the effective temperature from the excitation of the Fe i lines. The new isothermal provided by the hydrogen lines of the Paschen series at 8862 Å (P11) and 8598 Å (P14) coincides with the locus from the excitation of Fe i lines in Fig. 7.
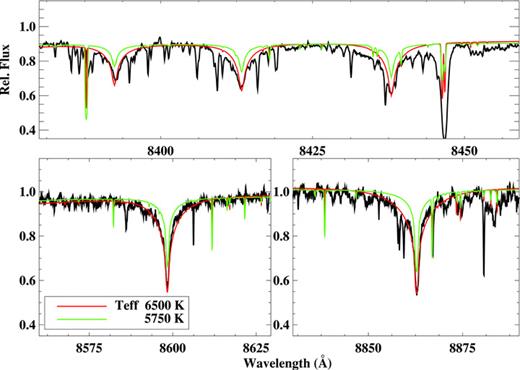
Observed and model line profiles for hydrogen Paschen lines. The green and red lines show the theoretical profiles for Teff = 5750 and 6500 K, respectively, both for a surface gravity log g = 0.5 dex.
5 ABUNDANCE ANALYSIS – ELEMENTS AND LINES
For the lines of neutral and/or singly ionized atoms, we conducted a systematic search by using the LEP and gf value as the guides. The Revised Multiplet Table (RMT) (Moore 1945) is used as an initial guide in this basic step. Lines chosen by this search are listed in Table 3. When a reference to solar abundances is necessary in order to convert our abundance of element X to either of the quantities [X/H] or [X/Fe], Asplund et al. (2009) is preferred.
Species used in the analysis and corresponding abundances for a model of Teff = 6500 K, log g = 0.5.
| Species | λ (Å) | EW (mÅ) | log ε(X) (dex) | LEP (eV) | log(gf) | RMT | Species | λ (Å) | EW (mÅ) | log ε(X) (dex) | LEP (eV) | log(gf) | RMT |
| C i | 4766.620 | 40 | 8.28 | 7.48 | −2.62 | 6 | Ca ii | 5019.971 | SS | 5.40 | 7.52 | −0.28 | 15 |
| C i | 4770.000 | 27 | 7.90 | 7.48 | −2.44 | 6 | Ca ii | 5285.266 | 14 | 5.43 | 7.51 | −1.18 | 14 |
| C i | 4771.690 | 108 | 8.15 | 7.49 | −1.87 | 6 | Ca ii | 5307.224 | SS | 5.50 | 7.52 | −0.90 | 14 |
| C i | 4775.870 | 51 | 8.10 | 7.49 | −2.30 | 6 | Ca ii | 5339.190 | 12 | 5.25 | 8.44 | −0.33 | 20 |
| C i | 4932.049 | 64 | 7.75 | 7.68 | −1.66 | 13 | Sc ii | 5031.019 | 169 | 2.06 | 1.36 | −0.40 | 23 |
| C i | 5380.340 | SS | 7.85 | 7.68 | −1.62 | 11 | Sc ii | 5239.823 | 78 | 1.82 | 1.46 | −0.77 | 26 |
| C i | 7111.470 | SS | 7.90 | 8.64 | −1.09 | 26 | Sc ii | 5318.350 | 19 | 2.23 | 1.36 | −2.01 | 22 |
| C i | 7113.180 | SS | 7.80 | 8.65 | −0.77 | 26 | Sc ii | 5526.810 | 164 | 1.95 | 1.77 | 0.02 | 31 |
| C i | 7115.170 | SS | 7.77 | 8.64 | −0.94 | 26 | Sc ii | 5640.971 | 69 | 2.13 | 1.50 | −1.13 | 29 |
| C i | 7116.990 | SS | 7.80 | 8.65 | −0.91 | 26 | Sc ii | 5667.149 | SS | ≤1.94 | 1.50 | −1.31 | 29 |
| C i | 7119.660 | SS | 7.85 | 8.64 | −1.15 | 26 | Sc ii | 5669.040 | 64 | 2.15 | 1.50 | −1.20 | 29 |
| N i | 8216.340 | SS | ≤7.19 | 10.34 | 0.13 | 2 | Sc ii | 5684.190 | 90 | 2.25 | 1.51 | −1.07 | 29 |
| N i | 8223.130 | SS | ≤7.19 | 10.33 | −0.27 | 2 | Ti i | 4999.503 | 33 | 3.97 | 0.83 | 0.25 | 38 |
| [O i] | 5577.340 | SS | 8.52 | 1.97 | −8.23 | 3 | Ti i | 5036.468 | SS | ≤4.13 | 1.44 | 0.13 | 110 |
| [O i] | 6300.304 | 18 | 8.57 | 0.00 | −9.78 | 1 | Ti i | 5192.969 | SS | ≤4.15 | 0.02 | −1.01 | 4 |
| [O i] | 6363.780 | SS | 8.42 | 0.02 | −10.26 | 1 | Ti ii | 4493.513 | 72 | 4.10 | 1.08 | −3.02 | 18 |
| O i | 6155.970 | SS | 8.60 | 10.74 | −0.66 | 10 | Ti ii | 4544.009 | 102 | 4.04 | 1.24 | −2.58 | 60 |
| O i | 6156.760 | SS | 8.52 | 10.74 | −0.44 | 10 | Ti ii | 4568.312 | 78 | 4.19 | 1.22 | −2.94 | 60 |
| O i | 6158.170 | SS | 8.67 | 10.74 | −0.30 | 10 | Ti ii | 4708.663 | 153 | 4.16 | 1.24 | −2.34 | 48 |
| Na i | 4978.541 | 28 | 6.15 | 2.10 | −1.22 | 9 | Ti ii | 4798.535 | 120 | 4.11 | 1.08 | −2.68 | 17 |
| Na i | 5682.633 | SS | 6.02 | 2.10 | −0.71 | 6 | Ti ii | 4865.620 | 128 | 4.30 | 1.11 | −2.79 | 29 |
| Na i | 5688.205 | SS | 5.87 | 2.10 | −0.45 | 6 | Ti ii | 4874.014 | 114 | 3.96 | 3.09 | −0.80 | 114 |
| Na i | 8183.255 | SS | 6.27 | 2.10 | 0.24 | 4 | Ti ii | 4911.193 | 143 | 4.03 | 3.12 | −0.61 | 114 |
| Na i | 8194.790 | SS | 6.27 | 2.10 | −0.46 | 4 | Ti ii | 5072.281 | 113 | 4.24 | 3.12 | −1.06 | 113 |
| Mg i | 4057.505 | SS | 7.22 | 4.35 | −0.90 | 16 | Ti ii | 5185.900 | 173 | 4.03 | 1.89 | −1.49 | 86 |
| Mg i | 4702.991 | 205 | 7.10 | 4.35 | −0.44 | 11 | Ti ii | 5381.015 | SS | 3.73 | 1.57 | −1.92 | 69 |
| Mg i | 5528.410 | 217 | 7.26 | 4.35 | −0.50 | 9 | Ti ii | 5418.751 | 92 | 3.63 | 1.58 | −2.00 | 69 |
| Mg i | 5711.090 | 47 | 6.98 | 4.34 | −1.72 | 8 | V ii | 4036.779 | SS | 3.14 | 1.48 | −1.53 | 9 |
| Mg ii | 4481.126 | SS | 7.17 | 8.86 | 0.75 | 4 | V ii | 4039.574 | SS | ≤3.14 | 1.82 | −2.11 | 32 |
| Mg ii | 4481.150 | SS | 7.17 | 8.86 | −0.55 | 4 | V ii | 4564.578 | SS | 3.34 | 2.27 | −1.39 | 56 |
| Mg ii | 4481.325 | SS | 7.17 | 8.86 | 0.59 | 4 | Cr i | 4545.945 | 25 | 4.80 | 0.94 | −1.38 | 10 |
| Al i | 3944.020 | SS | 4.91 | 0.00 | −0.64 | 1 | Cr i | 4646.144 | 51 | 4.57 | 1.03 | −0.71 | 21 |
| Al i | 3961.523 | SS | 4.81 | 0.01 | −0.34 | 1 | Cr i | 4652.158 | 29 | 4.57 | 1.00 | −1.03 | 21 |
| Si i | 5665.550 | 12 | 7.06 | 4.92 | −1.94 | 10 | Cr i | 5204.518 | 142 | 4.71 | 0.94 | −0.21 | 7 |
| Si i | 5701.108 | 19 | 7.29 | 4.93 | −1.95 | 10 | Cr i | 5208.420 | 197 | 4.82 | 0.94 | 0.16 | 7 |
| Si i | 5708.437 | 46 | 7.17 | 4.95 | −1.37 | 10 | Cr i | 5296.686 | SS | 4.81 | 0.98 | −1.41 | 18 |
| Si i | 5772.150 | 20 | 7.14 | 5.08 | −1.65 | 17 | Cr i | 5297.360 | SS | 4.81 | 2.90 | 0.17 | 94 |
| Si i | 5793.070 | 29 | 7.50 | 4.93 | −1.96 | 9 | Cr i | 5298.269 | SS | 4.71 | 0.98 | −1.16 | 18 |
| Si i | 6145.020 | SS | ≤6.99 | 5.62 | −0.84 | 29 | Cr i | 5348.312 | 18 | 4.56 | 1.00 | −1.29 | 18 |
| Si i | 6155.140 | 66 | 6.90 | 5.62 | −0.30 | 29 | Cr i | 5409.790 | 68 | 4.71 | 1.03 | −0.72 | 18 |
| Si ii | 5055.980 | SS | 6.70 | 10.07 | 0.52 | 5 | Cr ii | 4812.350 | 68 | 4.42 | 3.86 | −1.80 | 30 |
| Si ii | 6347.091 | 285 | 8.03 | 8.12 | 0.15 | 2 | Cr ii | 4884.607 | 57 | 4.58 | 3.86 | −2.08 | 30 |
| Si ii | 6371.359 | 252 | 7.91 | 8.12 | −0.08 | 2 | Cr ii | 5246.768 | 35 | 4.56 | 3.71 | −2.46 | 23 |
| S i | 4694.113 | 43 | 6.98 | 6.53 | −1.71 | 2 | Cr ii | 5305.850 | 57 | 4.55 | 3.83 | −2.08 | 24 |
| S i | 4695.443 | 39 | 7.08 | 6.53 | −1.87 | 2 | Cr ii | 5308.440 | 53 | 4.44 | 4.07 | −1.81 | 43 |
| S i | 4696.252 | 16 | 6.88 | 6.53 | −2.10 | 2 | Cr ii | 5310.687 | 28 | 4.57 | 4.07 | −2.27 | 43 |
| S i | 6052.583 | SS | 7.00 | 7.86 | −1.26 | 10 | Cr ii | 5313.590 | 98 | 4.69 | 4.07 | −1.65 | 43 |
| S i | 6743.580 | 25 | 7.20 | 7.87 | −1.07 | 8 | Cr ii | 5478.365 | 52 | 4.62 | 4.17 | −1.91 | 50 |
| S i | 6748.840 | SS | 6.90 | 7.87 | −0.64 | 8 | Cr ii | 5510.702 | 27 | 4.51 | 3.82 | −2.45 | 23 |
| S i | 6757.170 | SS | 6.83 | 7.87 | −0.35 | 8 | Mn i | 4041.361 | SS | 4.48 | 2.11 | 0.29 | 5 |
| Ca i | 4425.441 | 95 | 5.36 | 1.88 | −0.36 | 4 | Mn i | 4754.040 | 43 | 4.36 | 2.27 | −0.09 | 16 |
| Ca i | 4434.957 | SS | 5.50 | 1.88 | −0.01 | 4 | Mn i | 4783.420 | 64 | 4.47 | 2.29 | 0.04 | 16 |
| Ca i | 4435.679 | SS | 5.50 | 1.88 | −0.52 | 4 | Co i | 3995.306 | SS | 4.26 | 0.92 | −0.22 | 31 |
| Ca i | 4578.550 | 19 | 5.21 | 2.52 | −0.56 | 23 | Co i | 4121.318 | SS | ≤4.06 | 0.92 | −0.32 | 28 |
| Ca i | 5581.965 | SS | 5.60 | 2.52 | −0.71 | 21 | Ni i | 4714.408 | 78 | 5.34 | 3.38 | 0.23 | 98 |
| Ca i | 5588.749 | 98 | 5.35 | 2.53 | 0.21 | 21 | Ni i | 4829.016 | 26 | 5.43 | 3.54 | −0.33 | 131 |
| Ca i | 5590.114 | SS | 5.60 | 2.52 | −0.71 | 21 | Ni i | 4937.341 | 19 | 5.40 | 3.61 | −0.40 | 114 |
| Ca i | 5594.462 | 80 | 5.45 | 2.52 | −0.05 | 21 | Ni i | 4980.166 | 42 | 5.50 | 3.61 | −0.11 | 112 |
| Ca i | 5601.277 | 33 | 5.59 | 2.53 | −0.69 | 21 | Ni i | 5035.357 | SS | 5.39 | 3.64 | 0.29 | 143 |
| Ca i | 5857.454 | 73 | 5.47 | 2.93 | 0.23 | 47 | Ni i | 5080.523 | SS | 5.39 | 3.66 | 0.13 | 143 |
| Ca i | 6122.219 | 131 | 5.57 | 1.89 | −0.32 | 3 | Ni i | 5081.107 | SS | 5.54 | 3.85 | 0.30 | 194 |
| Ca i | 6162.172 | 161 | 5.60 | 1.90 | −0.09 | 3 | Ni i | 5082.354 | SS | 5.69 | 3.66 | −0.54 | 130 |
| Ca i | 6462.566 | 122 | 5.44 | 2.52 | 0.31 | 18 | Ni i | 5084.081 | SS | 5.69 | 3.68 | 0.03 | 162 |
| Ni i | 5099.927 | SS | 5.44 | 3.68 | −0.10 | 161 | Y ii | 5119.111 | SS | ≤0.81 | 0.99 | −1.36 | 20 |
| Ni i | 5155.762 | SS | 5.44 | 3.90 | −0.09 | 210 | Y ii | 5123.210 | SS | 0.81 | 0.99 | −0.83 | 21 |
| Cu i | 5105.537 | SS | ≤3.35 | 1.39 | −1.52 | 2 | Y ii | 5200.413 | SS | ≤0.68 | 0.99 | −0.57 | 20 |
| Zn i | 4680.138 | 19 | 3.91 | 4.00 | −0.86 | 2 | Zr ii | 4050.329 | SS | ≤1.24 | 0.71 | −1.06 | 43 |
| Zn i | 4722.153 | 44 | 3.88 | 4.03 | −0.39 | 2 | Zr ii | 4208.980 | SS | 1.14 | 0.71 | −0.51 | 41 |
| Zn i | 4810.534 | 53 | 3.80 | 4.08 | −0.17 | 2 | Zr ii | 4211.880 | 44 | 1.35 | 0.53 | −1.04 | 15 |
| Sr ii | 4077.714 | SS | 2.54 | 0.00 | 0.14 | 1 | Zr ii | 4496.960 | 54 | 1.44 | 0.71 | −0.89 | 40 |
| Sr ii | 4215.524 | SS | 2.49 | 0.00 | −0.18 | 1 | Ba ii | 5853.675 | 79 | 1.05 | 0.60 | −1.01 | 2 |
| Y ii | 4854.867 | SS | 0.88 | 0.99 | −0.38 | 22 | La ii | 5114.560 | SS | ≤0.31 | 0.24 | −1.03 | 36 |
| Y ii | 4883.690 | 83 | 0.59 | 1.08 | 0.07 | 22 | Nd ii | 4303.580 | SS | ≤0.44 | 0.00 | 0.08 | 10 |
| Y ii | 5087.420 | SS | 0.58 | 1.08 | −0.17 | 20 | Eu ii | 4129.720 | SS | −0.05 | 0.00 | 0.22 | 1 |
Note. RMT is the multiplet number given by the Revised Multiplet Table (Moore 1945).
Comments on individual elements with notes on the adopted gf values are as follows:
C: The gf values are taken from Wiese, Führ & Deters (1996). 10 lines give a mean abundance
 . Observed and synthetic spectra for three different carbon abundances are shown in Fig. 10 for a region providing three of the 10 chosen lines.
N: The gf values are taken from Wiese et al. (1996). Promising N i lines are in the red outside the wavelength range covered by the SAO spectrum. The McDonald spectrum covers the region spanned by several multiplets. Several potential lines fall in interorder gaps. Fig. 11 shows a possible detection of one N i line. The N abundance is log ε(N)≤ 7.1, but this might properly be considered an upper limit.
O: The gf values for the permitted and forbidden O i lines are taken from Wiese et al. (1996). On the McDonald spectrum, the forbidden oxygen lines at 5577, 6300 and 6363 Å are detected. Weak permitted lines of RMT 10 near 6156 Å are also analysed. Fig. 12 shows the best-fitting synthetic spectrum for the O i 6156 Å region. Forbidden and permitted lines give a very similar abundance. The strong O i triplet at the 7774- and the 8446-Å feature gives an abundance about 1.5 dex higher, a difference attributed to non-LTE effects.
Na: The gf values are taken from the NIST data base. Five Na i lines were suitable for abundance analysis from the McDonald spectrum (Table 3). RMT 4 and 6 give somewhat different results, but we assign to all lines the same weight.
Mg: The gf values for Mg i and Mg ii lines are taken from the NIST data base. Four Mg i lines are listed in Table 3. Fig. 13 shows the best-fitting synthetic spectrum for the 5528 Å Mg i line. The strongest lines not included in Table 3 are the Mg b triplet at 5167 (blended with Fe i), 5172 (blended with Fe i) and 5183 Å having measured EWs of 470, 413 and 496 mÅ in the McDonald spectrum, respectively. These yield an (uncertain) abundance of 7.12 dex in good agreement, however, with lines in Table 3. The strong Mg ii 4481 Å feature (Fig. 13) is well reproduced by the abundance from the Mg i lines and shows the asymmetry in the blue wing attributed to a wind.
Al: The resonance lines at 3944 and 3961 Å are detectable. Their gf values are from the NIST data base. A comparison of observed and synthetic spectra is presented in Fig. 14. Excited Al i lines were searched for but not surprisingly were undetectable.
Si: Selection of Si i lines was made starting with the list of lines used by Asplund (2000) for his solar abundance determination. Asplund's adopted gf values come from Garz (1973) with the adjustment recommended by Becker, Zimmermann & Holweger (1980). Asplund et al. (2009) remarked that the use of a three-dimensional model solar atmosphere and non-LTE corrections (Shi et al. 2008) do not change his 2000 estimate for the Si abundance.
The gf values for Si ii lines are those recommended by Kelleher & Podobedova (2008). Especially prominent in the McDonald spectrum are the lines at 6347 and 6371 Å. These lines provide an implausibly high abundance, a value about 1.0 dex higher than that from the Si i lines and corresponding to [Si/Fe]≃+ 1.4. This abundance is likely an indication that the lines are not formed in LTE. A search for weak Si ii lines yielded the line at 5055.98 Å from RMT 5 lines, which provides the abundance log ε (Si) = 6.7. This is not only 1.3 dex less than the value from the 6347- and 6371-Å lines, but also about 0.5 dex less than the abundance from Si i lines.
S: The gf values for S i lines were taken from Podobedova, Kelleher & Wiese (2009). Seven lines from three multiplets are easily measurable.
Ca: The gf values for the 13 Ca i lines in Table 3 are taken from the NIST data base. New measurements for RMT 3 by Aldenius, Lundberg & Blackwell-Whitehead (2009) are smaller by only 0.07 dex, a difference that is ignored here. Fig. 15 shows the best-fitting synthetic spectrum for the Ca i 4425- and 4435-Å regions.
The gf values for three of the four Ca ii lines in Table 3 are taken from the NIST data base with the entry for the 5339-Å line from the Kurucz data base in the absence of an entry in the former data base. The four lines give consistent results: Fig. 16 shows the best-fitting synthetic spectrum for the Ca ii lines at 5019, 5285 and 5307 Å.
Sc: The gf values for the Sc ii lines in Table 3 are exclusively taken from Lawler & Dakin (1989), who combined radiative lifetime and branching ratio measurements.
Ti: The gf values for Ti ii lines are taken from Pickering et al. (2001, 2002). The 4999-Å Ti i line gives the abundance in Table 3. Neutral titanium abundance is constrained with Ti i lines at 5036 and 5192 Å for which we set abundance limits in Table 3 using gf values from the NIST data base.
V: The gf values for V ii lines are taken from Biémont et al. (1989). The leading lines in the solar spectrum expected in the spectrum of IRAS 18095+2704 are at 4036.77 and 4564.58 Å. The former is detectable but the latter's absence provides an upper limit to the V abundance.
Cr: The gf values for Cr i lines are taken from the NIST data base. Sobeck, Lawler & Sneden (2007) measurements are within ±0.02 dex of NIST values for most lines in Table 3 and always within ±0.10 dex.
A majority of the selected Cr ii lines has gf values in the NIST data base and for the missing minority, we take semi-empirical values from the Kurucz linelist. Nilsson et al. (2006) reported new measurements of Cr iigf values from a combination of radiative lifetimes and branching fractions. The majority of chosen stellar lines in Table 3 are longwards of 4850 Å which is the long wavelength limit for the lines measured by Nilsson et al. For the seven lines in Nilsson et al.'s list between 4000 and 4850Å, the mean difference between the NIST and their entries for log gf is just −0.06. Therefore, we make no adjustment to the NIST (and Kurucz) entries.
Mn: The gf values for Mn i lines are taken from Blackwell-Whitehead & Bergemann (2007) when available or otherwise from the NIST data base. Hyperfine structure was considered for all lines with data taken from the Kurucz data base,3 as discussed by Prochaska & McWilliam (2000).
Fe: The gf values for Fe i and Fe ii lines are taken from Führ & Wiese (2006). Exclusion of three relatively strong Fe i lines at 5232 (EW = 224 mÅ), 5429 (EW = 220 mÅ) and 5446 Å (EW = 206 mÅ) changes the Fe abundance by only −0.02 dex. Analysis of these lines was discussed in Section 4.1.
Co: The search for Co i lines drew on the tabulation of gf values provided by the NIST data base. Few Co i lines are expected to be present: the leading candidates are lines at 3995.31, 4121.32 and 4118.77 Å. The 3995-Å line, after allowance for a blending Fe i line, gives the abundance in Table 3. The other two lines are present but blended.
Ni: The gf values for the Ni i lines are taken from the NIST data base. A good selection of Ni i lines is available for an abundance analysis.
Cu: Copper through Cu i lines of RMT 2 is not detectable in the spectrum. The strongest line of RMT 2 at 5105.54 Å gives the upper limit in Table 3 with the line's gf value taken from Bielski (1975).
Zn: Zinc is represented by the three Zn i lines of RMT 2 at 4722, 4680 and 4810 Å. The gf values are taken from Biémont & Godefroid (1980).
Sr: The Sr ii resonance lines at 4077 and 4215 Å are present as very strong lines and too strong for a reliable abundance determination, that is, they have EWs of 473 and 408 mÅ, respectively.
Y: Selection of Y ii lines is based on the solar lines judged to be unblended Y ii lines in the solar spectrum by Hannaford et al. (1982), who provided accurate gf values. Fig. 17 shows the best-fitting synthetic spectrum for the Y ii line at 4883 Å.
Zr: Our search for Zr ii lines drew on the papers by Biémont et al. (1981) and Ljung et al. (2006), who measured accurate laboratory gf values and conducted an analysis of Zr ii lines to determine the solar Zr abundance. Fig. 18 shows synthetic spectra fits to two Zr ii lines.
Ba: The Ba abundance is based on the 5854 Å Ba ii line, the weakest line of RMT 2. The gf value adopted is the mean of the experimental values from Gallagher (1967) and Davidson et al. (1992). Hyperfine and isotopic splittings are taken into account from McWilliam (1998). The stronger lines from RMT 2 and the resonance lines (RMT 1) give roughly 0.7 dex higher Ba abundance and are not considered further.
La: The La ii line at a 5114 Å region was too weak to measure but used to set the upper limit: log ε(La) ≤ 0.31. The gf value for the line is taken from Lawler, Bonvallet & Sneden (2001a).
Nd: The absent Nd ii line at 4303 Å is used to set an upper limit: log ε(Nd) ≤ 0.44. The gf value for the line is taken from Den Hartog et al. (2003).
Eu: The Eu ii resonance lines at 4129 and 4205 Å were searched for in the spectra. The gf values, hyperfine and isotopic structures are taken from Lawler, Wickliffe & Den Hartog (2001b). Spectrum synthesis of the 4129 Å line gives the abundance in Table 4. The 4205 Å line is too seriously blended to yield a useful Eu abundance.
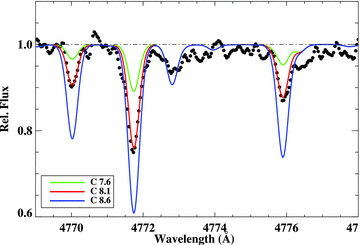
The observed spectrum near 4774 Å and synthetic spectra for the three carbon abundances shown on the figure.
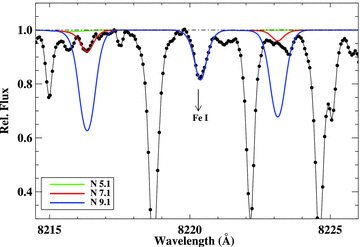
The observed spectrum near 8216 Å and synthetic spectra for the three nitrogen abundances shown on the figure.
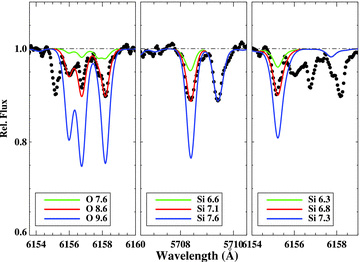
The spectrum near 6156 Å, a region containing the Si i 6155 Å and the three lines of O i RMT 10. Synthetic spectra are shown for the O and Si abundances indicated on the figure.
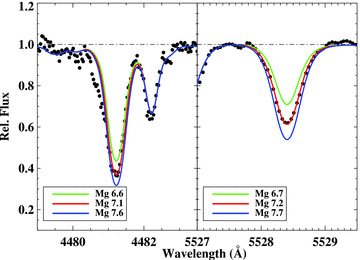
The Mg i 5528 Å and Mg ii 4481 Å regions showing a comparison of the observed spectrum versus the synthetic spectra for three Mg abundances.
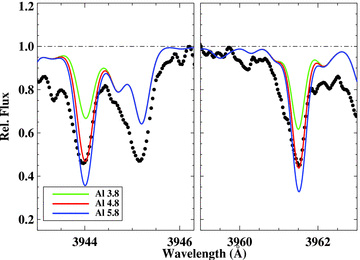
Sample region of the McDonald spectrum including Al i lines at 3944 and 3961 Å.
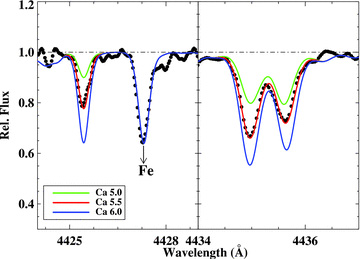
The Ca i 4425 Å and 4435 Å regions showing a comparison of the observed spectrum versus synthetic spectra for three Ca abundances.
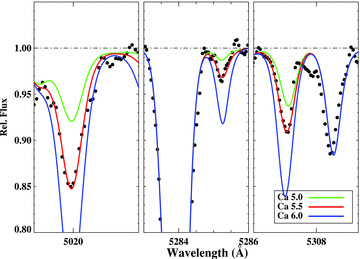
The Ca ii 5019, 5285, and 5307 Å regions showing a comparison of the observed spectrum versus the synthetic spectra for three Ca abundances.
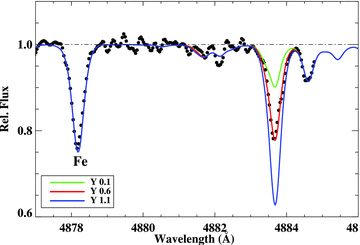
Observed and synthetic spectra for the Y ii line at 4883 Å.
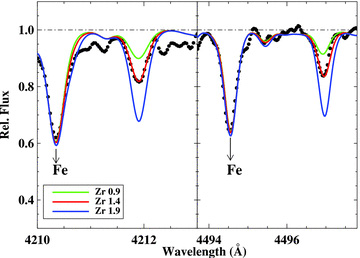
Observed and synthetic spectra for the Zr ii lines at 4211 and 4496 Å.
Abundances of the observed species for IRAS 18095+2704 are presented for a model atmospheres of Teff = 6700 K, log g = 0.3 (KT), ξ = 6.0 and Teff = 6500 K, log g = 0.5, ξ = 4.7 (this work). The solar abundances from Asplund et al. (2009) is used to convert Klochkova's abundance of element X to [X/Fe] for comparison purposes.
| Species | K95 | K95 | This work | log ε⊙ | |||
| log ε(X) | [X/Fe] | log ε(X) | [X/Fe] | Δ | N | ||
| C i | 8.27 | +0.50 | 7.92 | +0.40 | −0.35 | 11 | 8.43 |
| N i | 7.66 | +0.47 | ≤7.19 | ≤+0.27 | ≤−0.47 | 2 | 7.83 |
| O i | 8.74 | +0.65 | 8.55 | +0.77 | −0.19 | 6 | 8.69 |
| Na i | 6.02 | +0.47 | 6.12 | +0.79 | +0.10 | 5 | 6.24 |
| Mg i | 7.42 | +0.62 | 7.14 | +0.45 | −0.28 | 4 | 7.60 |
| Mg ii | 7.52 | +0.72 | 7.17 | +0.48 | −0.35 | 1 | 7.60 |
| Al i | 5.81 | +0.12 | 4.86 | −0.68 | −0.95 | 2 | 6.45 |
| Si i | 7.48 | +0.71 | 7.18 | +0.58 | −0.30 | 6 | 7.51 |
| Si ii | … | … | 6.70 | +0.10 | … | 1 | 7.51 |
| S i | 6.96 | +0.53 | 6.98 | +0.77 | +0.02 | 7 | 7.12 |
| Ca i | 5.84 | +0.26 | 5.48 | +0.05 | −0.36 | 13 | 6.34 |
| Ca ii | … | … | 5.40 | −0.03 | … | 4 | 6.34 |
| Sc ii | 2.25 | −0.30 | 2.08 | −0.16 | −0.17 | 7 | 3.15 |
| Ti i | 5.68 | +1.44 | 3.97 | −0.07 | −1.71 | 1 | 4.95 |
| Ti ii | 4.05 | −0.19 | 4.04 | +0.00 | −0.01 | 12 | 4.95 |
| V ii | 3.45 | +0.23 | 3.24 | +0.22 | −0.21 | 2 | 3.93 |
| Cr i | 6.02 | +1.13 | 4.71 | −0.02 | −1.31 | 10 | 5.64 |
| Cr ii | 4.98 | +0.09 | 4.54 | −0.19 | −0.44 | 9 | 5.64 |
| Mn i | 5.12 | +0.51 | 4.44 | −0.08 | −0.68 | 3 | 5.43 |
| Fe i | 6.71 | −0.01 | 6.59 | +0.00 | −0.12 | 31 | 7.50 |
| Fe ii | 6.73 | +0.01 | 6.59 | +0.00 | −0.14 | 11 | 7.50 |
| Co i | 5.74 | +1.60 | 4.26 | +0.18 | −1.48 | 1 | 4.99 |
| Ni i | 6.13 | +0.66 | 5.48 | +0.17 | −0.65 | 11 | 6.22 |
| Cu i | 4.06 | +0.63 | ≤3.35 | ≤ +0.07 | ≤−0.71 | 1 | 4.19 |
| Zn i | 4.60 | +0.78 | 3.86 | +0.21 | −0.74 | 3 | 4.56 |
| Sr ii | … | … | 2.52 | +0.56 | … | 2 | 2.87 |
| Y ii | 1.42 | −0.04 | 0.72 | −0.58 | −0.70 | 4 | 2.21 |
| Zr ii | … | … | 1.31 | −0.36 | … | 3 | 2.58 |
| Ba ii | 1.13 | −0.22 | 1.05 | −0.22 | −0.08 | 1 | 2.18 |
| La ii | 0.83 | +0.39 | ≤0.31 | ≤ +0.12 | ≤−0.52 | 1 | 1.10 |
| Nd ii | 1.56 | +0.84 | ≤0.44 | ≤ −0.07 | ≤−1.12 | 1 | 1.42 |
| Eu ii | 0.96 | +1.23 | −0.05 | +0.34 | −1.01 | 1 | 0.52 |
Notes. K95: Klochkova (1995).

N is the number of the lines employed in our abundance determination.
The solar abundances (log ε⊙) are from Asplund et al. (2009).
Abundances of the observed species for IRAS 18095+2704 are presented for a model atmospheres of Teff = 6700 K, log g = 0.3 (KT), ξ = 6.0 and Teff = 6500 K, log g = 0.5, ξ = 4.7 (this work). The solar abundances from Asplund et al. (2009) is used to convert Klochkova's abundance of element X to [X/Fe] for comparison purposes.
| Species | K95 | K95 | This work | log ε⊙ | |||
| log ε(X) | [X/Fe] | log ε(X) | [X/Fe] | Δ | N | ||
| C i | 8.27 | +0.50 | 7.92 | +0.40 | −0.35 | 11 | 8.43 |
| N i | 7.66 | +0.47 | ≤7.19 | ≤+0.27 | ≤−0.47 | 2 | 7.83 |
| O i | 8.74 | +0.65 | 8.55 | +0.77 | −0.19 | 6 | 8.69 |
| Na i | 6.02 | +0.47 | 6.12 | +0.79 | +0.10 | 5 | 6.24 |
| Mg i | 7.42 | +0.62 | 7.14 | +0.45 | −0.28 | 4 | 7.60 |
| Mg ii | 7.52 | +0.72 | 7.17 | +0.48 | −0.35 | 1 | 7.60 |
| Al i | 5.81 | +0.12 | 4.86 | −0.68 | −0.95 | 2 | 6.45 |
| Si i | 7.48 | +0.71 | 7.18 | +0.58 | −0.30 | 6 | 7.51 |
| Si ii | … | … | 6.70 | +0.10 | … | 1 | 7.51 |
| S i | 6.96 | +0.53 | 6.98 | +0.77 | +0.02 | 7 | 7.12 |
| Ca i | 5.84 | +0.26 | 5.48 | +0.05 | −0.36 | 13 | 6.34 |
| Ca ii | … | … | 5.40 | −0.03 | … | 4 | 6.34 |
| Sc ii | 2.25 | −0.30 | 2.08 | −0.16 | −0.17 | 7 | 3.15 |
| Ti i | 5.68 | +1.44 | 3.97 | −0.07 | −1.71 | 1 | 4.95 |
| Ti ii | 4.05 | −0.19 | 4.04 | +0.00 | −0.01 | 12 | 4.95 |
| V ii | 3.45 | +0.23 | 3.24 | +0.22 | −0.21 | 2 | 3.93 |
| Cr i | 6.02 | +1.13 | 4.71 | −0.02 | −1.31 | 10 | 5.64 |
| Cr ii | 4.98 | +0.09 | 4.54 | −0.19 | −0.44 | 9 | 5.64 |
| Mn i | 5.12 | +0.51 | 4.44 | −0.08 | −0.68 | 3 | 5.43 |
| Fe i | 6.71 | −0.01 | 6.59 | +0.00 | −0.12 | 31 | 7.50 |
| Fe ii | 6.73 | +0.01 | 6.59 | +0.00 | −0.14 | 11 | 7.50 |
| Co i | 5.74 | +1.60 | 4.26 | +0.18 | −1.48 | 1 | 4.99 |
| Ni i | 6.13 | +0.66 | 5.48 | +0.17 | −0.65 | 11 | 6.22 |
| Cu i | 4.06 | +0.63 | ≤3.35 | ≤ +0.07 | ≤−0.71 | 1 | 4.19 |
| Zn i | 4.60 | +0.78 | 3.86 | +0.21 | −0.74 | 3 | 4.56 |
| Sr ii | … | … | 2.52 | +0.56 | … | 2 | 2.87 |
| Y ii | 1.42 | −0.04 | 0.72 | −0.58 | −0.70 | 4 | 2.21 |
| Zr ii | … | … | 1.31 | −0.36 | … | 3 | 2.58 |
| Ba ii | 1.13 | −0.22 | 1.05 | −0.22 | −0.08 | 1 | 2.18 |
| La ii | 0.83 | +0.39 | ≤0.31 | ≤ +0.12 | ≤−0.52 | 1 | 1.10 |
| Nd ii | 1.56 | +0.84 | ≤0.44 | ≤ −0.07 | ≤−1.12 | 1 | 1.42 |
| Eu ii | 0.96 | +1.23 | −0.05 | +0.34 | −1.01 | 1 | 0.52 |
| Species | K95 | K95 | This work | log ε⊙ | |||
| log ε(X) | [X/Fe] | log ε(X) | [X/Fe] | Δ | N | ||
| C i | 8.27 | +0.50 | 7.92 | +0.40 | −0.35 | 11 | 8.43 |
| N i | 7.66 | +0.47 | ≤7.19 | ≤+0.27 | ≤−0.47 | 2 | 7.83 |
| O i | 8.74 | +0.65 | 8.55 | +0.77 | −0.19 | 6 | 8.69 |
| Na i | 6.02 | +0.47 | 6.12 | +0.79 | +0.10 | 5 | 6.24 |
| Mg i | 7.42 | +0.62 | 7.14 | +0.45 | −0.28 | 4 | 7.60 |
| Mg ii | 7.52 | +0.72 | 7.17 | +0.48 | −0.35 | 1 | 7.60 |
| Al i | 5.81 | +0.12 | 4.86 | −0.68 | −0.95 | 2 | 6.45 |
| Si i | 7.48 | +0.71 | 7.18 | +0.58 | −0.30 | 6 | 7.51 |
| Si ii | … | … | 6.70 | +0.10 | … | 1 | 7.51 |
| S i | 6.96 | +0.53 | 6.98 | +0.77 | +0.02 | 7 | 7.12 |
| Ca i | 5.84 | +0.26 | 5.48 | +0.05 | −0.36 | 13 | 6.34 |
| Ca ii | … | … | 5.40 | −0.03 | … | 4 | 6.34 |
| Sc ii | 2.25 | −0.30 | 2.08 | −0.16 | −0.17 | 7 | 3.15 |
| Ti i | 5.68 | +1.44 | 3.97 | −0.07 | −1.71 | 1 | 4.95 |
| Ti ii | 4.05 | −0.19 | 4.04 | +0.00 | −0.01 | 12 | 4.95 |
| V ii | 3.45 | +0.23 | 3.24 | +0.22 | −0.21 | 2 | 3.93 |
| Cr i | 6.02 | +1.13 | 4.71 | −0.02 | −1.31 | 10 | 5.64 |
| Cr ii | 4.98 | +0.09 | 4.54 | −0.19 | −0.44 | 9 | 5.64 |
| Mn i | 5.12 | +0.51 | 4.44 | −0.08 | −0.68 | 3 | 5.43 |
| Fe i | 6.71 | −0.01 | 6.59 | +0.00 | −0.12 | 31 | 7.50 |
| Fe ii | 6.73 | +0.01 | 6.59 | +0.00 | −0.14 | 11 | 7.50 |
| Co i | 5.74 | +1.60 | 4.26 | +0.18 | −1.48 | 1 | 4.99 |
| Ni i | 6.13 | +0.66 | 5.48 | +0.17 | −0.65 | 11 | 6.22 |
| Cu i | 4.06 | +0.63 | ≤3.35 | ≤ +0.07 | ≤−0.71 | 1 | 4.19 |
| Zn i | 4.60 | +0.78 | 3.86 | +0.21 | −0.74 | 3 | 4.56 |
| Sr ii | … | … | 2.52 | +0.56 | … | 2 | 2.87 |
| Y ii | 1.42 | −0.04 | 0.72 | −0.58 | −0.70 | 4 | 2.21 |
| Zr ii | … | … | 1.31 | −0.36 | … | 3 | 2.58 |
| Ba ii | 1.13 | −0.22 | 1.05 | −0.22 | −0.08 | 1 | 2.18 |
| La ii | 0.83 | +0.39 | ≤0.31 | ≤ +0.12 | ≤−0.52 | 1 | 1.10 |
| Nd ii | 1.56 | +0.84 | ≤0.44 | ≤ −0.07 | ≤−1.12 | 1 | 1.42 |
| Eu ii | 0.96 | +1.23 | −0.05 | +0.34 | −1.01 | 1 | 0.52 |
Notes. K95: Klochkova (1995).
N is the number of the lines employed in our abundance determination.
The solar abundances (log ε⊙) are from Asplund et al. (2009).
Mean abundances are summarized in Table 4. Absolute uncertainties for the abundances arising from uncertainties of the atmospheric parameters Teff, log g and ξ are summarized in Table 5 for changes with respect to the model of +150 K, +0.5 cm s−2 and ±1.0 km s−1 for representative lines (i.e. the Co entries are based on the EW upper limits for the 3995 and 4121 mÅ lines). From the uncertainties listed in Table 5, we find the total absolute uncertainty to be ranging from 0.08 for C i to 0.19 for Mg ii by taking the square root of the sum of the squares of individual errors (for each species) associated with uncertainties in temperature, gravity and microturbulent velocity. In light of the line-to-line scatter of abundances, the absolute uncertainties and, more importantly, the probability that the star fails to recognize the suite of assumptions behind the model atmosphere and the analysis of the lines, specification of abundances to ±0.01 dex is surely astrophysical hubris. Thus, we cite values to 0.1 dex in discussion of the abundances.
Sensitivity of the derived abundances to the uncertainties in the model atmosphere parameters for the Teff = 6500 K, log g = 0.5 model.
| Species | Δ log ε | |||
| ΔTeff+150 (K) | Δ log g+0.5 (cgs) | Δξ+1.0 (km s−1) | Δξ−1.0 (km s−1) | |
| C i | +0.03 | +0.05 | −0.05 | +0.07 |
| N i | −0.06 | +0.14 | −0.03 | +0.04 |
| O i | −0.04 | +0.09 | −0.01 | +0.01 |
| Na i | +0.09 | −0.07 | −0.01 | +0.01 |
| Mg i | +0.10 | −0.07 | −0.02 | +0.03 |
| Mg ii | −0.04 | +0.16 | −0.11 | +0.18 |
| Si i | +0.10 | −0.06 | −0.01 | +0.03 |
| Si ii | −0.06 | +0.12 | −0.04 | +0.04 |
| S i | +0.08 | −0.01 | −0.02 | +0.02 |
| Ca i | +0.10 | −0.07 | −0.04 | +0.05 |
| Ca ii | −0.01 | +0.12 | −0.00 | +0.01 |
| Sc ii | +0.08 | +0.13 | −0.02 | +0.04 |
| Ti i | +0.15 | −0.06 | −0.01 | +0.02 |
| Ti ii | +0.08 | +0.13 | −0.03 | +0.06 |
| V ii | +0.05 | +0.11 | −0.07 | +0.06 |
| Cr i | +0.14 | −0.06 | −0.02 | +0.03 |
| Cr ii | +0.04 | +0.12 | −0.02 | +0.03 |
| Mn i | +0.14 | −0.06 | −0.01 | +0.03 |
| Fe i | +0.11 | −0.08 | −0.03 | +0.02 |
| Fe ii | +0.05 | +0.13 | −0.03 | +0.03 |
| Co i | +0.15 | −0.06 | −0.09 | +0.13 |
| Ni i | +0.12 | −0.06 | −0.02 | +0.03 |
| Cu i | +0.16 | −0.05 | −0.00 | +0.01 |
| Zn i | +0.13 | −0.05 | −0.01 | +0.03 |
| Y ii | +0.09 | +0.12 | −0.04 | +0.06 |
| Zr ii | +0.09 | +0.13 | −0.02 | +0.02 |
| Ba ii | +0.17 | +0.01 | −0.04 | +0.06 |
| La ii | +0.13 | +0.10 | −0.00 | +0.01 |
| Nd ii | +0.15 | +0.06 | −0.02 | +0.02 |
| Eu ii | +0.13 | +0.09 | −0.08 | +0.15 |
In the Introduction section, we referred to two results of the abundance analysis by Klochkova (1995), the only previously reported analysis for IRAS 18095+2704. The two results referred to are: (i) large differences between the abundances from neutral and ionized lines of several elements, and (ii) overabundances (relative to iron) of lanthanides. Before discussing the star as a representative of post-AGB stars, we comment on point (i) in light of our analysis. Point (ii) is more properly considered in discussing the star as a member of the post-AGB class. Previous results for abundance differences between neutral and ionized lines were huge in several cases: 1.6 for Ti, 1.4 for V, 1.0 for Cr and 2.2 for Y but 0.0 dex for Fe due to the fact that it was the condition imposed in determining the surface gravity. Mg i and Mg ii also gave consistent results (−0.1 dex). Our results provide much smaller values, that is, difference in abundances [X/Fe] derived from neutral and first-ionized lines of several elements are −0.1 (Ti) and 0.2 (Cr) with again 0.0 dex for Fe. We were unable to detect V i lines. For silicon, the disparity between abundances from Si i lines and the single weak line of Si ii from RMT 5 is −0.5 dex. For Ca, it is +0.1 dex. We attribute elimination of the earlier large differences between the abundance from neutral and ionized lines to application of stringent requirements for the identification of weak lines of neutral species. What about non-LTE effects? The fact that the strongest lines generally give abundances that are too large according to a consideration of astrophysical plausibility is likely due to non-LTE effects: examples include the O i 7770 Å triplet, the Si ii 6347 and 6371Å lines and the resonance lines of Sr ii and Ba ii.
6 IRAS 18095+2704: ABUNDANCE ANOMALIES AND RELATIVES
While IRAS 18095+2704 may be a representative post-AGB star, it is not a textbook example of a star in this evolutionary state, where the AGB star experienced thermal pulses that enrich the envelope in products of He-shell burning, that is, carbon directly from the 3α process and heavy elements from the s process probably powered by the 13C(α, n)16O reaction. Then, after a series of thermal pulses that provide for a C-rich star with enhancements of s-process nuclides, the star experienced severe mass-loss and became a post-AGB star with effective temperature increasing over a few thousand years. AGB stars of intermediate mass may experience H-burning at the base of the deep convective envelope (hot bottom burning), such that the C-rich envelope (with s-process enhancements) is reconverted to an O-rich but N-rich envelope before mass-loss sets it on its post-AGB course. In several ways, IRAS 18095+2704 fails to fit these scenarios.
Our assessment of the evolutionary status of IRAS 18095+2704 involves (i) identifying abundance anomalies with respect to the composition of an unevolved or much less evolved star of the same iron abundance of [Fe/H]=−0.9 as obtained from samples of halo and (thick) disc stars (see e.g. Reddy, Lambert & Allende Prieto 2006) and (ii) identifying highly evolved and likely post-AGB stars with compositions similar to those of IRAS 18095+2704.
We begin by considering those elements whose atmospheric abundance is expected to be unaffected during the course of stellar evolution. Such elements are represented in Table 3 by the run from Mg to Zn, although Mg and Al are possibly affected by internal nucleosynthesis. In the Mg to Zn sequence, the so-called α-elements are expected to be overabundant relative to Fe by comparable amounts, say, [α/Fe]≃+ 0.3, provided that the star is truly metal poor. For IRAS 18095+2704, the α-elements have [α/Fe]=+0.5 (Mg), +0.6 (Si), +0.8 (S), 0.0 (Ca) and 0.0 (Ti). At first glance, these values seem at odds with the roughly equal ratios for these elements according to studies of disc and halo stars; Mg, Si and S are more enhanced and Ca and Ti are less enhanced relative to Fe than in the reference stars with [Fe/H]≃− 0.9. One should not overinterpret this result by overlooking potential systematic errors. It may be significant that [α/Fe] is roughly correlated with the atom's ionization potential and, if this is the case, it may be a signature of systematic errors in either our analysis and/or in the analyses of the very different stars, including main-sequence stars, providing the reference [α/Fe] values. Across the Fe-group, say, Sc to Zn, the ratios [X/Fe] for IRAS 18095+2704 are normal to within the observational uncertainties, that is [X/Fe] falls within the range ±0.2 dex. Just possibly, Mn appears overabundant at [Mn/Fe]=−0.1, where a value of −0.4 is found for disc and halo stars of [Fe/H]=−0.9 (Reddy et al. 2006).
Among the suite of elements thought to be immune to internal nucleosynthesis is Al for which we find [Al/Fe] to be −0.7. This is far from the expected value of about 0.0. Perhaps, the degree of ionization of Al departs from LTE values and Al atoms are overionized relative to LTE. In some post-AGB stars, elements like Al, which condense readily into grains, are underabundant in the stellar atmosphere (see e.g. Giridhar et al. 2005), and then the elemental underabundances correlate fairly well with the condensation temperature. This is not the case for IRAS 18095+2704. For example, Zn with its 726 K condensation temperature (Lodders 2003) is underabundant by [Zn/H]≃− 0.7, but S at 680 K and Na at 958 K are barely underabundant, say, [S/H]≃[Na/H]≃− 0.1. In a few post-AGB stars, the underabundances correlate with the neutral atom's ionization potential (Rao & Reddy 2005) rather than the condensation temperature, but again IRAS 18095+2704 does not fit this pattern.
It remains to discuss light elements C, N, O and Na and the heavy elements Y, Zr, Ba, La and Nd, which are candidates for abundance adjustments by nucleosynthesis in the course of stellar evolution. Clearly, the atmosphere is O rich (C/O ≃ 0.25 by number). Yet, the C abundance suggests some C enrichment because [C/Fe] < 0 is expected following the first dredge-up but [C/Fe]=+0.4 is found here. The O enhancement ([O/Fe]=+0.8) is greater than reported for normal stars, but the excess seems to mirror that found for S, another element of higher than average ionization potential for an α-element and the ratio [O/S]≃ 0 is similar to that for normal stars. The upper limit to the N abundance is approximately consistent with that expected from the first dredge-up. In short, the C, N and O abundances suggest mild C-enrichment on the AGB, following dilution of C and enhancement of N during the first dredge-up as the star becomes a red giant following the main sequence (see e.g. Iben & Renzini 1983). Textbook enrichment of C by thermal pulses with subsequent C-destruction by hot bottom burning is ruled out by the lack of appreciable N enrichment. Sodium stands apart from this picture: [Na/Fe]=+0.8 is neither a ratio found among normal stars nor easily accounted for on nucleosynthetic grounds. The Na abundance appears to be affected by non-LTE effects. Non-LTE analysis of Na i lines by Takeda & Takada-Hidai (1994) indicates that the non-LTE corrections [ ]4 in Na i lines at 4979, 5683, 5688 and 8195 Å are −0.06, −0.15, −0.20 and −0.94 dex, respectively, at temperature 6000 K and gravity 0.5 dex.
Operation of the s-process would be expected to lead to overabundances of Y and Zr but underabundances (relative to Fe) are found. At [Fe/H]≃− 1, Y and Zr underabundances are not found among normal stars. Thus, the Y and Zr abundances for IRAS 18095+2704 present a puzzle. It is not clear if the same puzzle is provided by the heavier elements Ba, La and Nd for which the s process would provide some enrichment. Barium is nominally consistent with the Y and Zr in suggesting a slight underabundance ([Ba/Fe]=−0.2). Our search for La and Nd proved unsuccessful and the upper limits  are consistent with results for normal stars and also with the Y, Zr and Ba abundances for IRAS 18095+2704. The r-process Eu abundance is that expected for a normal star; any s-process contribution to Eu is expected to be very slight, even had the s process operated in IRAS 18095+2704 (Sneden, Cowan & Gallino 2009). In summary, Y and Zr underabundances represent a puzzle. One is struck by the fact that Y and Zr with Al have condensation temperatures among the highest of the elements in Table 4. All are underabundant relative to expectation. We noted above that the abundances do not always correlate well with the condensation temperature. However, elements with condensation temperatures hotter than 1550 K generally appear among the most underabundant – the set includes Al, Ca, Sc, Ti, Y, Zr and Ba. (La and Nd also fall in the set, but upper limits to their abundances restrict their relevance here.) At [Fe/H]≤− 0.3, the Ca and Ti abundance should be judged with respect to their overabundance relative to Fe by about 0.3 dex in normal stars, that is, add about −0.3 dex to the entries for [X/Fe] in Table 4 when judging abundance anomalies according to condensation temperature. Then, the [X/Fe] for Al, Ca, Ti, Y, Zr and Ba are quite similar for these elements of a similar condensation temperature. Scandium appears to be mildly overabundant with respect to the speculation that elements of the highest condensation temperature (TC > 1500 K) are underabundant in IRAS 18095+2704.
In spite of the above remarks about abundances and condensation temperatures, similarities with the compositions of some RV Tauri variables are present. Among RV Tauri variables and the presumably closely related W Vir variables (Maas, Giridhar & Lambert 2007), the correlation between abundance anomalies and condensation temperature runs from strong to weak. IRAS 18095+2704 definitely falls among the latter group. There is a fair correspondence between the composition of IRAS 1805+2704 and the RV Tauri variable AI Sco (Giridhar et al. 2005) (Fig. 19).5 In part, Fig. 19 may reflect the fact that systematic errors (e.g. non-LTE effects) are of similar magnitude for the two stars with similar atmospheric parameters: (Teff, log g, [Fe/H]) = (6500, +0.5, −0.9) for IRAS 18095+2704 and (5300, 0.25, −0.7) for AI Sco. Stars exhibiting a striking correlation involving the condensation temperature seem certain to be binaries with a circumbinary disc providing infall of gas, but not dust, on to the star responsible for the anomalies (Van Winckel 2003). For those stars (e.g. AI Sco) with hints of a correlation involving the condensation temperature, their binary status is unknown. Certainly, the lack of a strong radial velocity variation for IRAS 18095+2704 may suggest that it is a single star. But, perhaps, a wind off the star, as may be suggested by the strong blue asymmetry for strong lines, provides the site for dust–gas separation. In summary, we suppose that IRAS 18095+2704 may be related to an RV Tauri variable, probably one that has evolved to hotter temperatures beyond the instability strip.
![[Element/Fe] of AI Sco versus [Element/Fe] of IRAS 18095+ 2704. The arrows indicate upper limits.](https://oup.silverchair-cdn.com/oup/backfile/Content_public/Journal/mnras/410/1/10.1111_j.1365-2966.2010.17467.x/1/m_mnras0410-0612-f19.jpeg?Expires=1749890201&Signature=qlMeBSbCevBvl-Q2a4IMC9skWePM5EOLh8JLLe9D64jrRxz5~0Q9hSdFyXaWsbJCjQWmK7pto0FS3gE3d-wdQ-kg4Rkxf-9jH4B54GsMYxBjVxClm-jGqF3VdjSc74EKczLALsjbfx88UvPPnVDke-h5UOwGvOK4kTKUUb1HtVBz5UlxnsAunEiFKIKDgd2M8a2~r18rjWdTQS4XNWUYn09pAHW1QZn7kDT5WC5ESKGANp4n-eXj6bfCrKod~EP0kYBFMFZoYxSmdIFWXVk2hZKMit2PQfEQNpdnd~3d67CHP0GDBVfraWJ373mxktnoFEMi6gvN8aAIsfu1aZbyfQ__&Key-Pair-Id=APKAIE5G5CRDK6RD3PGA)
[Element/Fe] of AI Sco versus [Element/Fe] of IRAS 18095+ 2704. The arrows indicate upper limits.
7 CONCLUDING REMARKS
Abundance analysis of IRAS 18095+2704 classified as a protoplanetary nebula by Hrivnak et al. (1988) suggests that the star left the AGB before thermal pulses had the opportunity to enrich the atmosphere in the principal products from He-shell burning (C- and s-process nuclides). The star is not exceptional in this regard – see, for example, the abundance analyses of post-AGB stars reviewed by Van Winckel (2003). If the star's Fe abundance is adopted as a reference, the composition of IRAS 18095+2704 is normal except for an underabundance of Al, Y and Zr. A speculation was offered that elements including Al, Y, and Zr having a condensation temperature hotter than 1500 K are underabundant. This suggests that the atmosphere is depleted in those elements that condense most readily into dust grains. Perhaps, the wind, which is suggested by the pronounced blue asymmetry to the lines of strong lines, removes grains selectively.
Although a variety of spectroscopic indicators provide a consistent set of atmospheric parameters, the high-resolution optical spectra offer evidence that IRAS 18095+2704's atmosphere is only an approximation to the classical atmosphere and standard LTE analysis techniques used to derive the abundances. The line profiles require macroturbulent velocities that are supersonic. Strong lines suggest, by the presence of blue asymmetries, that a wind has driven off the star. Refinement of the abundance analysis may primarily depend on developing an improved understanding of the physics of these dilute extended stellar photospheres.
Standard notation is used for quantities [X], where [X] = log(X)star− log(X)⊙.
Lines that are well defined and not blended.
Δ log ε(X) = log ε(X)NLTE− log ε(X)LTE
There is little resemblance to the composition of EQ Cas and CE Vir for which abundance anomalies correlate well with the atom's ionization potential.
This research has been supported in part by the grant F-634 to DLL from the Robert A. Welch Foundation of Houston, Texas. VGK and NST acknowledge support from the Russian Foundation for Basic Research (project No. 08–02–00072 a).
REFERENCES
