


Abstract
We present Swift broad-band observations of the recently discovered black hole candidate, X-ray transient, XTE J1752−223, obtained over the period of outburst from 2009 October to 2010 June. From Swift–Ultraviolet/Optical Telescope (UVOT) data we confirm the presence of an optical counterpart which displays variability correlated, in the soft state, to the X-ray emission observed by Swift–X-ray Telescope (XRT). The optical counterpart also displays hysteretical behaviour between the states not normally observed in the optical bands, suggesting a possible contribution from a synchrotron-emitting jet to the optical emission in the rising hard state. We offer a purely phenomenological treatment of the spectra as an indication of the canonical spectral state of the source during different periods of the outburst. We find that the high-energy hardness–intensity diagrams over two separate bands follow the canonical behaviour, confirming the spectral states. Our XRT timing analysis shows that in the hard state there is significant variability below 10 Hz which is more pronounced at low energies, while during the soft state the level of variability is consistent with being minimal. These properties of XTE J1752−223 support its candidacy as a black hole in the Galactic Centre region.
1 INTRODUCTION
Low-mass X-ray binaries are for the majority of the time in a state of quiescensce with faint or non-detected X-ray emission, though optical or near-infrared (NIR) counterparts may be visible due to emission from the donor star, or possibly the jet, hotspot or outer accretion disc. They are often only discovered when they enter an active state of outburst when – powered by an increased level of accretion on to the central, compact object (black hole or neutron star) – there is a dramatic increase of the X-ray, optical/NIR and radio flux. During these outbursts the systems have been observed to go through a number of high-energy spectral states before returning to a quiescent state, usually on time-scales of weeks, months or even longer. These states are a generally low-intensity, power-law-dominated, hard state followed by a usually, higher intensity, thermal-dominant, soft state which decreases in flux, via a late hard state, over time. Additionally, the hard states are associated with aperiodic variability of the light curve not present in the soft state (see McClintock & Remillard 2006 for a fuller description of the various possible states).
XTE J1752−223, a new X-ray transient and black hole candidate (Markwardt et al. 2009a; Shaposhnikov, Markwardt & Swank 2009; Muñoz-Darias et al. 2010b) in the Galactic Centre region, was detected on 2009 October 23 at 19:55 ut (MJD 55128.33) by RXTE and on 2009 October 24 at 14:18:50 ut by the Burst Alert Telescope (BAT) instrument on board the Swift satellite (Markwardt et al. 2009b). The high-energy variable emission of the source was confirmed in the following days by Swift/X-ray Telescope (XRT) (Markwardt et al. 2009a) and RXTE (Remillard et al. 2009; Shaposhnikov et al. 2009) as well as by the Monitor of All-sky X-ray Image (MAXI)/Gas Slit Camera (GSC) Nakahira et al. (2009) and Fermi/Gamma-ray Burst Monitor (GBM) (Wilson-Hodge et al. 2009). An optical and NIR counterpart was proposed by Torres et al. (2009a,b) while a radio source coincident with the X-ray position (Markwardt et al. 2009a) was observed by the Australia Telescope Compact Array (ATCA; Brocksopp et al. 2009). The source was observed to have undergone a state transition in the mid of 2010 January (MJD ∼55210; Homan 2010), from a spectrally hard to a spectrally soft X-ray state. This was identified by a decoupling of high-energy (>rsim4 keV) and low-energy (≲4 keV) light curves (Nakahira et al. 2010) which had previously traced each other, and by the dominance of a thermal component. The source was observed to have reverted to a hard state at the end of 2010 March (MJD ∼55280; Muñoz-Darias et al. 2010a), after the low-energy light curve decreased to trace once more the high-energy light curve; the thermal component was no longer dominant. It has also been suggested that the turn-on of a compact jet has been observed in this system (Buxton et al. 2010) during this transition back to the low/hard state.
In this paper we present the Swift– BAT, XRT and Ultraviolet/Optical Telescope (UVOT) – monitoring observations of XTE J1752−223, obtained over the period of the outburst. Based on these data, we identify the periods of the various states and compare the behaviour of the major photometric, spectral and timing parameters during these states to those expected from black hole X-ray binaries. In Section 2 we introduce the observations and reduction methods, while in Section 3 we present the results of our photometric, spectral and timing analyses of the data. We summarize our findings in Section 4.
2 OBSERVATIONS AND REDUCTION
Swift (Gehrels et al. 2004) observed XTE J1752−223 with its narrow-field instruments, the UVOT (Roming et al. 2005) and the XRT (Burrows et al. 2005), on 55 epochs from 2009 October 25 to 2009 November 3 and from 2010 February 4 to 2010 June 5. These observations (under Target IDs 31532, 31640 and 31688) coincide with the period of the outburst. Observations with the narrow-field instruments were interrupted for 3 months due to the source becoming constrained by the position of the Sun. Wide-field instruments also became sun-constrained but at a later date and for a shorter period of time, depending on the satellite and instrument in question (e.g. MAXI was constrained from December 15 to 24). During the period of the outburst, as it had been on previous occasions, the field was also being observed (though constrained from December 13 to 28) by Swift's BAT (Barthelmy et al. 2005) which, in combination with XRT and UVOT, affords quasi-simultaneous observations from 0.002 to 150 keV. Reduction of Swift data was carried out using version 3.4 of the Swift software, released as part of heasoft 6.7. All uncertainties are quoted at the 1σ confidence level.
2.1 Ultraviolet/Optical Telescope
UVOT data have been pre-processed at the Swift Data Centre (see Breeveld et al. 2010) and require only minimum user processing. As the pointing of Swift is only accurate to a few arcseconds, the standard pre-process pipeline provides an astrometric correction by matching sources with the USNO-B catalogue. However, in this case the automatic matching failed because the field differs significantly between the ultraviolet and the USNO-B bandpass. To overcome this, we created our own astrometric reference catalogue by selecting blue and bright field stars in the GSC-2.3 catalogue (Lasker et al. 2008) to determine astrometric corrections for the data.
The image data of each filter, from each observation sequence, i.e. with a given observation ID, were summed using uvotimsum. All sequences were then combined in an individual fits file, using fappend, which was again summed using uvotimsum to obtain a deep image of the field in each filter. From these images, two possible optical counterparts of XTE J1752−223 are identified, consistent with the X-ray position (Markwardt et al. 2009a); source A, consistent with the counterpart proposed by Torres et al. (2009a), is within 1σ and source B is within 2σ of the X-ray position. The positions (J2000; 0.31 arcsec error) of the possible counterparts were derived from such a deep (1853 s) v band image summed between MJD 55130 and 55138 (Fig. 1), using the uvotdetect command, as
| A | 17:52:15.08 | −22:20:32.9 |
| B | 17:52:15.52 | −22:20:37.4 |
| A | 17:52:15.08 | −22:20:32.9 |
| B | 17:52:15.52 | −22:20:37.4 |
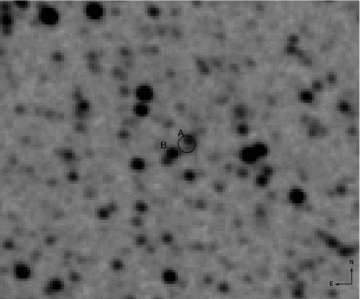
UVOT 1853 s v band 130 × 100 arcsec2 (MJD 55130–55138) image with XRT 1σ error circle marked along with optical sources A and B.
We caution, however, that given the crowded nature of this field (see finding chart of Torres et al. 2009a), it is possible that these two sources are in fact unresolved groupings. Though this does not affect our study of source variability, it has a significant impact on the spectral fitting.
Photometry of the two sources in individual sequences are derived via uvotmaghist, using an extraction region of radius 4 arcsec and xspec-compatible spectral files for source A created with the same region, using uvot2pha. Magnitudes are based on the UVOT photometric system (Poole et al. 2008). Source B shows no variation over the time of the observations, while source A shows significant variability in the v, b and u bands (Fig. 2) and is undetected in the individual UV band (uw1, um2, uw2) images, except for a few uw1 detections in late, deep images. The average magnitudes of each of these sources, from the deep, summed images between MJD 55130 and 55138, where the magnitude of source A is relatively constant, are given in Table 1. These are uncorrected for the Galactic extinction in the direction of XTE J1752−223 (Schlegel, Finkbeiner & Davis 1998) of E (B−V) = 1.554. Taking this value as an upper limit to the extinction of source A and using the effective wavelengths of the Swift filters (Poole et al. 2008) and the parametrization of Pei (1992), the extinctions of the Swift bands are Av≤ 4.7, Ab≤ 6.1, Au≤ 7.6, Auvw1≤ 10.5,Auvw2≤ 12.5, Auvm2≤ 15.0, though these should be treated with caution as estimates of the extinction so close to the Galactic plane (<5°) are unreliable.
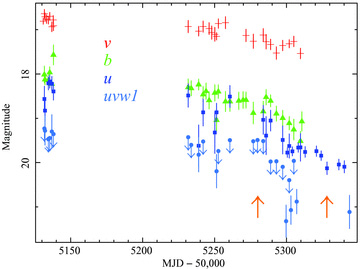
UVOT v (crosses), b (triangles), u (squares) and uw1 (circles with 3σ limits) band light curves for source A, which show variability; dimming by 1 mag or more from the start to the end of observations. The up-pointing arrows signify the dates between which the source is transitioning from the soft state to the late, hard state (MJD 55280, 55328).
UVOT magnitudes and 3σ limits of sources A and B as well as the background limit of source A, limit, from summed images taken between MJD 55130 and 55138. Uncorrected for interstellar extinction of E (B−V) ≲ 1.554.
| Band | Exp (s) | A | B | Limit |
| v | 1853 | 16.79 ± 0.03 | 16.20 ± 0.03 | 19.9 |
| b | 703 | 18.10 ± 0.07 | 17.57 ± 0.05 | 20.3 |
| u | 1042 | 18.37 ± 0.05 | 18.29 ± 0.08 | 20.3 |
| uw1 | 1098 | 19.53 ± 0.18 | 19.28 ± 0.19 | 20.5 |
| um2 | 1504 | >20.8 | >20.7 | 20.8 |
| uw2 | 2083 | 20.9 ± 0.3 | >21.0 | 21.1 |
2.2 X-ray Telescope
The XRT windowed timing mode (WT; Hill et al. 2004) event data (0.3–10 keV) were analysed using the tools presented by Evans et al. (2009). These correct for pile-up and the effect of bad CCD columns. Version v011 response matrices were used for the spectral analysis. The best XRT position of 17:52:15.14–22:20:33.8 (J2000; 3.1 arcsec error) is as previously reported (Markwardt et al. 2009a). Background-subtracted XRT count rate light curves are binned per observing sequence (Fig. 3; combined with MAXI observations). Unbinned source light curves (not background subtracted), for each sequence, were used to produce power-density spectra (PDSs) and to calculate the rms variability with the ftools, powspec and lcstats, respectively. Within each of these the binning was set to be N times the minimum bin size (1.766 ms) where N = 1 for the PDSs and N = 8 (14.128 ms) for the rms variability, giving frequency ranges of 0.02–570 and 0.02–70 Hz, respectively. The average PDSs were calculated, within powspec, from an input list of the light curves of the required sequences, using the same binning. Lags between the standard XRT low-energy (0.3–1.5 keV) and high-energy (1.5–10 keV) band unbinned light curves were calculated with crosscor and a bin size set to N = 8 (14.128 ms).
![High-energy [Swift–BAT (15–150 keV)], MAXI (4–10 keV), Swift–XRT (0.3–10 keV)] light curves during the period of outburst. Also shown are the XRT hardness ratio, HR (1.5–10 keV/0.3–1.5 keV) and percentage rms. The absence of data around MJD ∼55180 is due to the various instruments becoming sun-constrained. The arrows signify the dates between which the source is transitioning from the soft state to the late, hard state (MJD 55280, 55328).](https://oup.silverchair-cdn.com/oup/backfile/Content_public/Journal/mnras/410/1/10.1111_j.1365-2966.2010.17460.x/1/m_mnras0410-0541-f3.jpeg?Expires=1750075461&Signature=AXKy6~mXTF66cHlik4ZiHcLlFStpQIdxmmtP-Ix6AMuhLx-t~VbAaFa4vtkkgWnMcB8rDLezkJ-RIh88y0dzaFxhADtT2YunLJRqYsTYGVhkHyKk~QQDyldzSO9hX8nGK-Qqz31mBAnMDfllR1Td7DFxpdfdLaCwB-38ZdQhc~LDhA~OWsVayqKL0cRQyrw5D~~08BwUSo9Q4GCt~YotMgOxXZK09hztCURuZF7Pt6TafX~HtE6w9DiiuaU2EZaczFUvUulEppDT2B2wuDuz36G7dEUIrXERQM7AH09toLL2X44Xk7QWpntO75TLoXXZOP1U0P2Ts-tqxMK7o6Xl8Q__&Key-Pair-Id=APKAIE5G5CRDK6RD3PGA)
High-energy [Swift–BAT (15–150 keV)], MAXI (4–10 keV), Swift–XRT (0.3–10 keV)] light curves during the period of outburst. Also shown are the XRT hardness ratio, HR (1.5–10 keV/0.3–1.5 keV) and percentage rms. The absence of data around MJD ∼55180 is due to the various instruments becoming sun-constrained. The arrows signify the dates between which the source is transitioning from the soft state to the late, hard state (MJD 55280, 55328).
2.3 Burst Alert Telescope
BAT detector plane histograms (DPHs) were obtained in survey mode; these are 2D images with full spectral data and coarse time binning. Spectra and light curves were extracted from these DPHs using mask weighting (also known as ray tracing) to account for the position of the source on the coded aperture mask. The data were initially processed with the ftool, batsurvey, which applies data quality cuts and uses the tools batfftimage and batcelldetect to extract eight-channel spectra for the source. We then used custom software to format the spectra for xspec, and batdrmgen to generate the response files. The light curve was derived using a similar method. BAT, as a survey telescope, had been observing the field of XTE J1752−223 since the start of Swift operations in 2006 January, though not monitoring the source. The extracted BAT light curve (15–150 keV) of the source from 2006 January 12 through to the present displays no activity until the 2009 outburst.
3 ANALYSIS AND DISCUSSION
3.1 Energy spectra
The joint XRT–BAT spectra were fitted within xspec (12.5.1), using C-statistics and interstellar absorption modelled by tbabs; initially we fit an absorbed power law (pow) to the spectra before adding a thermal component (diskbb). We note that these are phenomenological models for the respective spectral states, not a suggestion that these are necessarily the best physical models; they should not be used to deduce physical constraints but only as an indication of the spectral state of the source.
The early data (MJD 55131–55138) are well described by the power law of average photon index, Γ = 1.46 ± 0.03 (Fig. 4) and do not require a thermal component, clearly indicating that the source is in the hard state. The absorption of a simultaneous fit of these sequences is NH = 0.513 ± 0.003 × 1022 cm−2, greater than the Galactic value of NH = 0.46 × 1022 cm−2 (Kalberla et al. 2005) but lower than the NH = 0.72+0.01−0.04× 1022 cm−2 found by Muñoz-Darias et al. (2010b). Data observed from MJD 55234–55280 additionally support a soft-state thermal component decreasing from a temperature of ∼0.7 to ∼0.5 keV over the period, as well as decreasing normalization. Due to the degeneracy between the power law and the thermal components and lack of counts from the BAT, the power-law index is poorly constrained in a manner not obvious from the nominal fit errors but causing a high level of variability in the upper panel of Fig. 4; these values are not reliable.
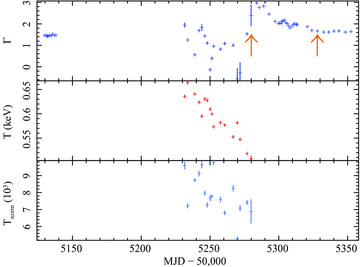
Best-fitting parameters of the joint XRT–BAT spectral fits: power-law photon index, Γ, thermal component temperature, T, and thermal component normalization, Tnorm, in units of 103. Note that the photon indices, in the period where there is a thermal component, are not reliable. The absence of data around MJD ∼55180 is due to the various instruments becoming sun-constrained. The arrows signify the dates between which the source is transitioning from the soft state to the late, hard state (MJD 55280, 55328).
From MJD 55283 the data no longer support a thermal component, though the signal-to-noise ratio at these low count rates cannot rule out a thermal component. Additionally, as can be seen from Fig. 4, the power-law indices are decreasing until MJD 55328, signalling the transitional period between the soft and hard states, in agreement with the increasing hardness ratio (Fig. 3). From MJD 55328 to the end of our observations, on MJD 55352, the spectra are described by a power law of relatively constant photon index, the average of which is Γ = 1.64 ± 0.02. The power-law indices and the hardness ratios at these late times fail to return to the original, rising hard-state values (Γ = 1.46 ± 0.03), indicating that, though the count rate is lower than it was in that rising hard state, the source has not yet returned to its original hard state or that the late hard state has marginally different spectral properties.
3.2 Optical counterpart
An optical and NIR counterpart was proposed by Torres et al. (2009a,b) based on a comparison between their images and those from the Digitized Sky Survey, Two Micron All Sky Survey (2MASS) and UKIRT Infrared Deep Sky Survey (UKIDSS). We have confirmed UVOT source A as this optical counterpart on the basis of a significant, though low amplitude variability in the v, b and u bands (Fig. 2). Furthermore, these optical magnitudes, or count rates, exhibit a power-law correlation with the X-ray count rate, as observed by XRT at times after MJD 55232 (Fig. 5), i.e. when the source is in the soft state and later, during the transition to the late hard state. The earlier hard-state data do not fit on this correlation, but display hysteretical behaviour and for the given X-ray count rate it spans a significantly higher magnitude in all bands. This is similar to the hysteretical behaviour observed in the NIR for a number of transients (Russell et al. 2007), most notably XTE J1550−564, where the additional hard-state emission is attributed to optically thin synchrotron emission from a jet (Jain et al. 2001; Homan et al. 2005; Hynes et al. 2006), which would be quenched in the soft state (e.g. Fender, Belloni & Gallo 2004), and weak at low X-ray luminosities, leading to the hysteresis. Though this hysteresis is not normally observed in the optical bands, the optical data presented here are in good agreement with the synchrotron-emitting jet making a significant contribution to the optical emission in the rising hard state. While the observed v-band brightening from MJD 55292 corresponds to the suggested turn-on, in NIR, of a compact jet between MJD 55293 and 55298 (Buxton et al. 2010), it is not corroborated by the other bands and is not statistically significant, though it may indicate the turn-on of a jet and the transition to the hard state; at such low X-ray luminosity levels, the jet contribution to the optical would be minimal.
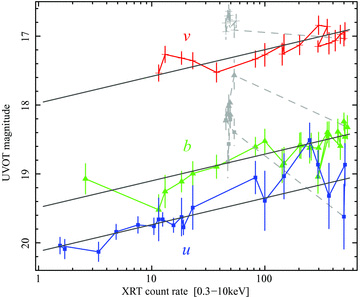
UVOT magnitude in three filters versus XRT count rate. Data points in grey indicate observations before MJD ∼55230, i.e. the rising hard state. The solid black lines represent the simultaneous power-law fit to the data after MJD 55230.
From a simultaneous fit of the v, b and u bands the correlation is found to be Rateoptical∝ Rate0.16±0.01X-ray with observed colours of u−v = 2.15 ± 0.09 and u−v = 1.43 ± 0.11 (χ2ν = 1.05), though the individual bands display indices of 0.10 ± 0.04, 0.18 ± 0.03 and 0.20 ± 0.02, respectively, hinting at possible spectral evolution. Such a correlation is more usually associated with the hard state (Russell et al. 2006) but we cannot say if the early hard-state data follow another correlation (expected to be Rateoptical∝ Rate0.6X-ray; Russell et al. 2006) due to the very limited range of magnitudes and X-ray count rates over this period. Though we find a correlation between the optical and X-ray, we cannot imply causality or say which leads without a study of the phase lag between the two bands, which is not possible given the time resolution of the optical data. Similarly a timing analysis to investigate variability of the optical data is not possible. The correlation may be due to reprocessing of the X-rays or through both originating from the accretion disc; it is also possible that optical emission in the soft state originates from a jet, the state of which traces the spectral states (Fender et al. 2004).
The quality of the UVOT spectral data does not support any spectral evolution in the optical, nor does it enable us to specify the most appropriate spectral model for the source such as a power law associated with the above-suggested jet emission. Hence, we model the data phenomenologically in xspec by a power law (Flux ∝νβ) and a dust extinction component (zdust), though we note that this is not a particularly good fit. Given that an unknown amount of Galactic extinction, E (B−V) ≤ 1.554 (Schlegel et al. 1998), affects the data we can only place limits on the spectral index of −5.3 ≲βoptical≲ 2.0, though the nominal best fit is at βoptical=− 1.6 ± 0.2 for E (B−V) = 0.76 ± 0.04. Given the uncertainties of the spectral slope and the lack of phase-lag information, we are unable to make a meaningful comparison to the predictions of the various models.
3.3 Hardness–intensity diagrams
The hardness–intensity diagrams (HID) for both the XRT data (1.5–10 keV/0.3–1.5 keV) and the quasi-simultaneous (same-day) BAT/MAXI data starting at the same time are shown in Fig. 6. Due to the fact that the BAT/MAXI data are only quasi-simultaneous, the hardness ratio (HR) of BAT (15–150 keV) with respect to MAXI (4–10 keV) at low BAT count rates (≲0.01), where the relative variability over a day is greater, are underestimated by the error bars. In general, HIDs follow a canonical trajectory (e.g. Homan et al. 2001; Homan & Belloni 2005; Belloni 2010): increasing intensity at a high HR to a maximum in the hard state, indicating the power-law shape of the spectra; decrease of HR at a high intensity through an intermediate state as the thermal component of the spectra becomes more dominant; decrease of intensity at the low HR level during the soft state; before the HR increases at low intensity, through an intermediate state, to the original value. This is consistent with both the XRT data, though a significant amount of the trajectory in the first intermediate state is missing due to the source being sun-constrained for a period of 3 months, and the BAT/MAXI data in which the final phase is obscured due to the large error bars on the HR. It is clear from the XRT HID that the hardness has yet to increase to the original value, indicating that the source has not yet returned to its original hard state, though the count rate is lower than that in the rising hard state, or that the late hard state has different properties. These tracks are common among black hole binary sources – though these are also observed in neutron star binary sources such as Aquila X-1 (e.g. Tudose et al. 2009; Miller-Jones et al. 2010) – and further confirm the spectral state of the system over the periods in question.
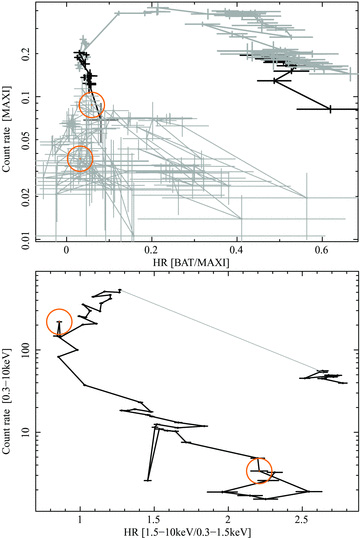
HID for both BAT/MAXI (upper) and XRT (lower). The grey lines, at high count rates in the XRT and BAT plots show the time during which the XRT was unable to observe (MJD 55139–55233), while the circles show the start and end of the transition from the soft state at MJD 55280 and 55328. Note that at low count rates (≲0.1) the BAT/MAXI HR is not reliable; the later low count rate data points are shaded for clarity of the plot.
3.4 Timing analysis
The rms variation of the light curves exhibit a similar evolution-to-hardness ratio (Fig. 3), from average  per cent in the observed period of the rising hard state (MJD 55131–55138) to ≲12 per cent during the soft-state observations and increasing to the original levels at later times. Examining the light curves in the standard XRT low-energy (0.3–1.5 keV) and high-energy (1.5–10 keV) bands we find that, during the rising hard state this variability is more pronounced in the low band with an average ratio between the two of 0.84 ± 0.02. This suggests an energy dependency of rms variation, in contrast to Muñoz-Darias et al. (2010b) who find a flat rms spectrum (Vaughan et al. 2003; Gierliński & Zdziarski 2005) from XTE data at energies in the range 2–10 keV. The lag between the two bands, calculated via a cross-correlation, is consistent with zero in all cases though is not tightly constrained.
Examining the average PDSs of the states (Fig. 7) we see that the hard state has a high level of power in low-frequency (≲10 Hz) variability, though there is no significant sign of quasi-periodic oscillations. The soft state, on the other hand, has a much lower level of power and only at frequencies ≲0.2 Hz, as is manifested by the ≲12 per cent limit of rms values during this period (MJD 55234–55289). After MJD 55321, where the XRT count rate drops below 10 count s−1, the light curves and PDSs are heavily affected by background counts (Fig. 8) and hence the rms values for these observations are unreliable and not plotted in Fig. 3.
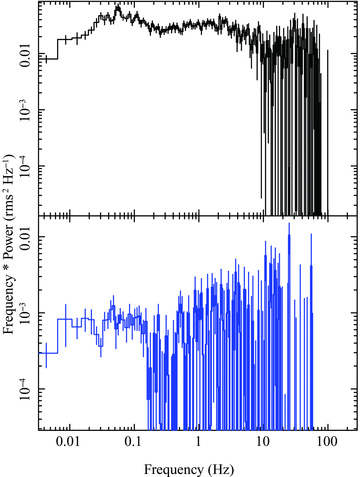
The average PDS for XRT light curve in the hard state (MJD 55130–55138; upper) exhibits the aperiodic variability of the light curve not present in the average soft state PDS (MJD 55234–55289; lower).
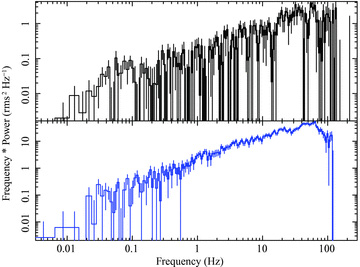
The PDSs for the XRT source light curve, at low count rates (upper; example observations on MJD 55340 where the count rate is 1.7 count s−1), is heavily affected by that of the background light curve at the same time (lower).
The excess of low-energy variability in the rising hard state is similar to the behaviour of the hard-state variability in Swift J1753.5−0127 and GX 339−4 as reported by Wilkinson & Uttley (2009). Within the framework of their model, enhanced low-energy variability (at frequencies ≲0.1 Hz) is due to a contribution from the thermal emission of the accretion disc. The excess variability is attributed to intrinsic disc variability – due to accretion rate fluctuations – as opposed to reprocessing of the spectral power-law component of the emission. Though a thermal component is not supported by the spectra of XTE J1752−223 in the rising hard state, the excess variability we observe suggests that one might contribute to the flux at low energies. More detailed spectral fits using the methods introduced in Wilkinson & Uttley (2009) are required to test this possibility. Data, over a greater energy range, which better constrains column density and photon index may also be necessary.
4 CONCLUSION
XTE J1752−223 was observed by Swift in a relatively low-intensity hard state from 2009 October 26 to 2009 November 3 (MJD 55131–55138) which was signified by hard power-law energy spectra, and high levels (∼50 per cent) of rms variability in the X-ray light curve. XTE J1752−223 then became constrained by the position of the Sun and was unobservable until 2010 February 4 (MJD 55234) by which time it had experienced a 10-fold increase in the flux observed by XRT (0.3–10.0 keV), which proceeded to decrease to the original levels over a period of 2 months. The spectra during this period clearly exhibited a strong thermal component and the variability and hardness ratios of the light curves had dropped significantly, consistent with the source being in a soft state until 2010 March 25 (MJD 55280). Observations from 2010 March 28 (MJD 55283) to 2010 May 12 (MJD 55328) do not support a thermal component but do display a decreasing photon index along with increasing hardness and rms variability. This suggests a transitional state before reverting to the hard state, with a relatively constant photon index, in which the system is observed until the end of observations on 2010 June 5 (MJD 55352). The high-energy HIDs over two separate bands follow the canonical behaviour associated with a black hole binary, further confirming the spectral states of the system during the outburst. Our timing analysis shows that in the hard state there is significant variability below 10 Hz which is more pronounced at low energies, while during the soft state the level of variability is consistent with being minimal.
We are able to confirm that the UVOT source at the position of the proposed optical and NIR counterpart is associated with XTE J1752−223 due to the observed low amplitude variability and, in the soft state and later, correlation with the X-ray emission as measured by XRT. However, we cannot state that the optical flux is causally connected to the X-ray emission via reprocessing of the X-rays or through both originating from the accretion disc; given the uncertainties of the spectral slope and the lack of phase-lag information, we are unable to make a meaningful comparison to the predictions of the various models. The optical counterpart also displays hysteretical behaviour not normally observed in the optical bands; for a given X-ray count rate, the magnitude in the rising hard state is significantly higher than that in the soft state. This is similar to the hysteretical behaviour observed in the NIR for a number of transients where the additional hard-state emission is attributed to optically thin synchrotron emission from a jet, which would be quenched in the soft state and weak at low X-ray luminosities. Though this hysteresis is not normally observed in the optical bands, it is in good agreement with the synchrotron-emitting jet making a significant contribution to the optical emission in the rising hard state.
We thank the referee for constructive comments and Paul Kuin for useful discussions on UVOT. PAC, PAE and CB acknowledge support from STFC. TJM thanks the EU FP7 for support through grant number ITN 215212 ‘Black Hole Universe’. PC acknowledges funding via a EU Marie Curie Intra-European Fellowship under contract no. 2009-237722. This research has made use of Swift data supplied by the UK Swift Science Data Centre at the University of Leicester and MAXI data provided by RIKEN, JAXA and MAXI teams.
REFERENCES
