


Abstract
We investigate several aspects of the correlations reported by the Pierre Auger Observatory between the highest energy ultra-high energy cosmic rays (UHECRs) and galaxies in the Veron-Cetty Veron (VCV) catalogue of active galactic nuclei (AGNs). First, we quantify the extent of the inhomogeneity and impurity of the VCV catalogue. Second, we determine how the correlation between the highest energy Auger UHECRs and VCV galaxies is modified when only AGNs satisfying optical spectral line ratios, i.e. a very pure sample, are used. Finally, we measure the correlation between the published Auger UHECRs and the distribution of nearby galaxies. We find that the correlation between the arrival directions of published Auger UHECRs and the VCV AGNs is much stronger than the correlation with the random sets of galaxies drawn from nearby large-scale structure. This suggests that the correlation of the UHECRs with AGNs is not solely due to AGNs tracing the large-scale distribution of matter. We also find that once we take into account the heavy oversampling of the VCV catalogue in the Virgo region, the lack of UHECRs from that region is not incompatible with UHECRs having AGN sources.
1 INTRODUCTION
The Pierre Auger Observatory has reported (The Pierre Auger Collaboration 2007, 2008) a correlation between the arrival directions of the highest energy cosmic rays (UHECRs) and the positions of galaxies in the Veron-Cetty Veron (VCV) ‘Catalog of Quasars and Active Galactic Nuclei’, 12th edn. (Véron-Cetty & Véron 2006). UHECR data above 40 EeV through 2006 May 27 and VCV galaxies out to z = 0.024, a prescription was established by scanning on UHECR energy threshold, maximum angular separation and maximum VCV object redshift. Then, independent data taken after 2006 May 27 was used to test this prescription with the same energy threshold, maximum redshift and angular separation. When satisfied in mid-summer 2007, the prescription implied an a priori probability of less than 1 per cent that UHECR sources are distributed isotropically. Altogether, in the full data set up to 2007 August 31, there are 27 UHECRs with energy above 57 EeV and 20 of them are within  of VCV galaxies with z < 0.018 (about 75 Mpc). Restricting to |b| ≥ 10°, where the VCV catalogue is more complete, there are 22 UHECRs of which 19 are correlated.
The existence of a correlation between UHECRs and VCV galaxies clarifies the nature of UHECRs by establishing that UHECRs are extragalactic in origin and that they have an energy-dependent horizon consistent with the Greisen-Zatsepin-Kuzmin (GZK) prediction. However as stressed in The Pierre Auger Collaboration (2007, 2008), the observed correlation alone is insufficient to conclude that the sources of UHECRs are active galactic nuclei (AGNs), because AGNs are clustered with galaxies and thus may only be a tracer of the true sources. We present here a method for determining when a correlation between UHECRs and some candidate source catalogue is only a reflection of the catalogue’s tracing the galaxy distribution or when the catalogue shows a stronger correlation than would be expected from a generic sampling of large-scale structure. Applied to the published Auger UHECR data, we find that the observed correlation with the VCV catalogue is too strong to be explained merely by AGNs being clustered along with other galaxies. Many authors have searched for correlations with many other sets of galaxies, such as IRAS, the hard X-ray Swift catalogue, radio galaxies. This method can also be used to test those correlations against correlations to generic large-scale structure. In this paper, we restrict ourselves to the correlation with the VCV catalogue reported by Auger.
The VCV catalogue is not complete, homogeneous or pure. We begin by quantifying these deficiencies, in Section 2, in order to understand the limitations of VCV for establishing quantitative bounds on the contribution of AGNs to the population of UHECRs. Next, using the Auger scan method, we measure in Section 3 the correlation between the published Auger UHECRs above 57 EeV and the optically identified AGNs in VCV, and compare that to the correlation with the full VCV catalogue. Finally, in Section 4 we answer the question of whether the observed degree of correlation to VCV and its optically identified AGNs can be explained just on the basis of the fact that galaxies are clustered and AGNs trace that clustering: we find that the correlation of VCV with published Auger UHECRs above 57 EeV has less than 1 per cent chance of arising simply from VCV tracing the distribution of all galaxies.
2 VCV PURITY AND COMPLETENESS
The VCV catalogue is a compilation of the AGN, BL Lac and quasar candidates reported in the literature, with heterogeneous selection criteria and different amounts of telescope time devoted to different targets. It is not complete, uniform or pure. Unfortunately, the required complete, uniform, pure and well-characterized AGN catalogue does not exist at this time, so in order to understand the significance of correlations with this catalogue, we need to quantify the impurity, incompleteness and non-uniformity of the VCV catalogue.
First, we examine the purity of the VCV catalogue. Our main diagnostic methods for identifying the presence of an AGN are based on optical spectra. Optical criteria are one of the most reliable methods for identifying AGNs and we want to use stringent and conservative criteria to assess purity. In addition, the VCV catalogue is primarily based on optical criteria, so we are not introducing large biases to the completeness of the catalogue. We examine the published spectra and optical line ratios to find either broad emission lines (e.g. Hα) which are a result of Keplerian velocities of gas orbiting the central supermassive black hole or narrow-line ratios which indicate ionization beyond the capabilities of star-forming regions. Furthermore, if we also confirm the active nature of the galactic nuclei if other unmistakable signs of AGN activity, such as radio jets, are reported in the literature. These methods are discussed in more detail and used by Zaw, Farrar & Greene (2009, hereafter ZFG) who examined the 21 VCV galaxies with z≤ 0.018 which fall within the  correlating radius of the 27 published Auger UHECRs above 57 EeV. ZFG determined that 14 of the 21 correlated galaxies are optically identifiable AGNs (and/or have radio jets) and the remaining seven showed limited or no nuclear activity based on their optical spectra. Observations are in progress with the Chandra X-Ray Observatory to determine whether these galaxies show signs of AGN activity.
We have extended the work of ZFG by examining the spectra of the VCV galaxies with z≤ 0.024, out to 6° from each UHECR. The redshift and angular ranges are motivated by our scan parameters described in Section 3. We have examined a total of 66 galaxies, a little less than 10 per cent of the total VCV catalogue within z≤ 0.024 and 100 per cent of the galaxies which can yield a correlation in our scans. The detailed results are presented in Table 1 with notation and procedures identical to that used in ZFG. Of the 66 galaxies, 52 contain AGNs identified by optical criteria. All of the 20 galaxies labelled S1 or S1.x (broad-line Seyfert) by VCV meet the AGN criteria. This is not surprising since the S1 identification is given only to galaxies with broadened optical lines which are firm indicators of the presence of an AGN. None of the four galaxies labelled as H2 (star-forming region) by VCV meet optical AGN criteria. Of the remaining 42 which are designated as narrow-line AGNs, low-ionization nuclear emission-line regions (LINERs) or unspecified AGNs by VCV, 32 are confirmed to be AGNs by optical criteria. In sum, after galaxies identified as H2 regions are removed, about 1/6 of the galaxies in VCV are not optically identifiable AGNs; however, some of these may have active nuclei which would have to be discovered in the radio or X-ray.
Auger UHECRs and correlated VCV galaxies.
| Year | Day | ECR (EeV) | RACR (J2000) | Dec.CR (J2000) | lCR (J2000) | bCR (J2000) | VCV galaxy | RAAGN (J2000) | Dec.AGN (J2000) | r (°) | z | VCV class | Real class |
| 2004 | 142 | 84 | 199.7 | −34.9 | 309.2 | +27.6 | ESO 383−G18 | 203.36 | −34.02 | 3.14 | 0.013 | S1.8 | S2 |
| MCG -06.30.015 | 203.97 | −34.30 | 3.57 | 0.008 | S1.5 | S1.2 | |||||||
| IC 4296 | 204.16 | −33.97 | 3.80 | 0.013 | S3 | LINER | |||||||
| NGC 5135 | 201.43 | −29.83 | 5.27 | 0.013 | S2 | S2 | |||||||
| NGC 4903 | 195.35 | −30.94 | 5.39 | 0.016 | S2 | S2 | |||||||
| NGC 5253 | 204.98 | −31.64 | 5.49 | 0.001 | H2 | H ii (Walsh & Roy 1989; Gonzalez-Riestra, Rego & Zamorano 1987) | |||||||
| 2004 | 282 | 66 | 208.0 | −60.3 | 310.4 | +1.7 | 4U 1344−60 | 206.90 | −60.62 | 0.63 | 0.013 | S1 | S1 |
| Circinus | 213.29 | −65.34 | 5.58 | 0.001 | S1h | S2 | |||||||
| 2004 | 339 | 83 | 268.5 | −61.0 | 332.3 | −17.0 | ESO 139−G12 | 264.41 | −59.94 | 2.27 | 0.017 | S2 | S2 |
| IC 4687 | 273.41 | −57.75 | 4.10 | 0.017 | H2 | H ii (Corbett et al. 2003) | |||||||
| NGC 6300 | 259.25 | −62.82 | 4.72 | 0.003 | S2 | S2 | |||||||
| PKS 1718−649 | 260.92 | −65.01 | 5.28 | 0.014 | S3 | LINER | |||||||
| F49 | 279.24 | −59.40 | 5.57 | 0.019 | S1h | S2 | |||||||
| 2004 | 343 | 63 | 224.5 | −44.2 | 325.6 | +13.0 | IC 4518A | 224.43 | −43.13 | 1.07 | 0.016 | S2 | S2 |
| NGC 5643 | 218.17 | −44.17 | 4.54 | 0.003 | S2 | S2 | |||||||
| ESO 328−IG36 | 228.71 | −40.34 | 4/96 | 0.024 | S1.8 | S1 | |||||||
| 2005 | 54 | 84 | 17.4 | −37.9 | 284.4 | −78.6 | NGC 424 | 17.87 | −38.08 | 0.41 | 0.011 | S1h | S1.5 |
| NGC 526A | 20.98 | −35.07 | 4.04 | 0.019 | S1.9 | S1.9 | |||||||
| IC 1657 | 18.53 | −32.65 | 5.33 | 0.012 | S2 | S2 | |||||||
| 2005 | 63 | 71 | 331.2 | −1.2 | 58.8 | −42.4 | Q2207+0122 | 332.62 | +1.62 | 3.16 | 0.013 | ⋅⋅⋅ | H ii (Schneider, Schmidt & Gunn 1994) |
| 2005 | 81 | 58 | 199.1 | −48.6 | 307.2 | +14.1 | NGC 4945 | 196.37 | −49.47 | 1.99 | 0.002 | S | S2 |
| IC 4200 | 197.39 | −51.97 | 3.54 | 0.013 | ⋅⋅⋅ | LINER | |||||||
| ESO 269−G12 | 194.17 | −46.93 | 3.71 | 0.016 | ⋅⋅⋅ | S2 | |||||||
| NGC 4785 | 193.36 | −48.75 | 3.79 | 0.012 | S2 | S2 | |||||||
| NGC 5244 | 204.68 | −45.86 | 4.67 | 0.008 | H2 | H ii (Moran, Halpern & Helfand 1996) | |||||||
| NGC 5128 (Cen A) | 201.37 | −43.02 | 5.80 | 0.001 | ? | ‘BL Lac’ (Israel 1998) | |||||||
| 2005 | 295 | 57 | 332.9 | −38.2 | 4.2 | −54.9 | IC 5169 | 332.54 | −36.09 | 2.13 | 0.010 | S2 | H ii (Kewley et al. 2001) |
| ESO 404−G032 | 332.12 | −34.11 | 4.14 | 0.015 | S2 | S2 | |||||||
| NGC 7135 | 327.44 | −34.88 | 5.50 | 0.007 | ⋅⋅⋅ | H ii (Joguet et al. 2001) | |||||||
| IC 5135 | 327.08 | −34.95 | 5.69 | 0.016 | S1.9 | S2 | |||||||
| 2005 | 306 | 59 | 315.3 | −0.3 | 48.8 | −28.7 | Zw 374.029 | 313.84 | +2.35 | 3.03 | 0.013 | S1h | NLS1 |
| UGC 11630 | 311.89 | +0.41 | 3.48 | 0.012 | S2 | S2 | |||||||
| IC 1368 | 318.55 | +2.18 | 4.09 | 0.013 | S2 | S2 | |||||||
| 1H 2044−032 | 311.80 | −3.07 | 4.46 | 0.015 | S1 | QSO | |||||||
| 2006 | 35 | 85 | 53.6 | −7.8 | 194.1 | −46.9 | SDSS J03349−0548 | 53.74 | −5.81 | 1.99 | 0.018 | S1 | S1 |
| SDSS J03302−0532 | 52.56 | −5.54 | 2.48 | 0.013 | S1 | S1 | |||||||
| NGC 1358 | 53.42 | −5.09 | 2.72 | 0.013 | S2 | S2 | |||||||
| SDSS J03457−0715 | 56.44 | −7.26 | 2.89 | 0.022 | S2 | S2 | |||||||
| MARK 612 | 52.67 | −3.14 | 4.75 | 0.020 | S2 | S2 | |||||||
| MCG -02.09.040 | 51.27 | −12.30 | 5.05 | 0.015 | S2 | S2 | |||||||
| MARK 607 | 51.20 | −3.04 | 5.32 | 0.009 | S2 | S2 | |||||||
| NGC 1241 | 47.81 | −8.92 | 5.84 | 0.013 | S2 | S2 | |||||||
| 2006 | 55 | 59 | 267.7 | −60.7 | 332.4 | −16.5 | ESO 139−G12 | 264.41 | −59.94 | 1.79 | 0.017 | S2 | S2 |
| IC 4687 | 273.41 | − 57.75 | 4.15 | 0.017 | H2 | H ii (Corbett et al. 2003) | |||||||
| NGC 6300 | 259.25 | −62.82 | 4.72 | 0.003 | S2 | S2 | |||||||
| PKS 1718−649 | 260.92 | −65.01 | 5.28 | 0.014 | S3 | LINER | |||||||
| F 49 | 279.24 | −59.40 | 5.57 | 0.019 | S1h | S2 | |||||||
| 2006 | 81 | 79 | 201.1 | −55.3 | −52.3 | +7.3 | IC 4200 | 197.39 | −51.97 | 3.54 | 0.013 | ⋅⋅⋅ | LINER |
| 2006 | 185 | 83 | 350.0 | +9.6 | 88.8 | −47.1 | NGC 7591 | 349.57 | +6.59 | 3.04 | 0.017 | S | H ii (Sturm et al. 2006; Veilleux et al. 1995) |
| NGC 7672 | 351.88 | +12.39 | 3.34 | 0.013 | S2 | S2 | |||||||
| IC 1481 | 349.86 | +5.91 | 3.70 | 0.020 | S3 | LINER | |||||||
| NGC 7469 | 345.82 | +8.87 | 4.19 | 0.017 | S1.5 | S1.2 | |||||||
| NGC 7479 | 346.24 | +12.32 | 4.59 | 0.007 | S1.9 | S2-L | |||||||
| 2006 | 296 | 69 | 52.8 | −4.5 | 189.4 | −45.7 | NGC 1358 | 53.42 | −5.09 | 0.85 | 0.013 | S2 | S2 |
| SDSS J03302−0532 | 52.56 | −5.54 | 1.07 | 0.013 | S1 | S1 | |||||||
| MARK 612 | 52.67 | −3.14 | 4.75 | 0.020 | S2 | S2 | |||||||
| SDSS J03349−0548 | 53.74 | −5.81 | 1.61 | 0.018 | S1 | S1 | |||||||
| MARK 607 | 51.20 | −3.42 | 2.16 | 0.009 | S2 | S2 | |||||||
| NGC 1266 | 49.00 | −2.43 | 4.32 | 0.007 | S? | LINER | |||||||
| SDSS J03457−0715 | 56.44 | −7.26 | 2.89 | 0.022 | S2 | NLAGN | |||||||
| 2006 | 299 | 69 | 200.9 | −45.3 | 308.8 | +17.2 | NGC 5128 (Cen A) | 201.37 | −43.02 | 2.31 | 0.001 | ? | ‘BL Lac’ (Israel 1998) |
| NGC 5244 | 204.66 | −45.86 | 2.70 | 0.008 | H2 | H ii (Moran et al. 1996) | |||||||
| ESO 269−G12 | 194.17 | −46.93 | 3.71 | 0.016 | ⋅⋅⋅ | S2 | |||||||
| NGC 4945 | 196.37 | −49.47 | 1.99 | 0.002 | S | S2 | |||||||
| ESO 323−G77 | 196.61 | −40.41 | 5.81 | 0.015 | S1.2 | S1.2 | |||||||
| 2007 | 13 | 148 | 192.7 | −21.0 | −57.2 | +41.8 | ESO 575−IG016 | 193.15 | −21.91 | 1.00 | 0.0223 | S2 | S2 |
| CTS J10.09 | 188.46 | −21.06 | 3.95 | 0.023 | S2 | S2 | |||||||
| ESO 507−G70 | 195.72 | − 23.92 | 4.04 | 0.022 | S | Ambiguous (Corbett et al. 2003) | |||||||
| NGC 4968 | 196.77 | −23.68 | 4.62 | 0.009 | S2 | S2 | |||||||
| ESO 508−G05 | 196.74 | −23.92 | 4.73 | 0.010 | S2 | No emission (Joguet et al. 2001) | |||||||
| PKS 1306−241 | 197.17 | −24.38 | 5.34 | 0.14 | S2 | S2 | |||||||
| 2007 | 51 | 58 | 331.7 | +2.9 | 63.5 | −40.2 | Q2207+0122 | 332.62 | +1.62 | 1.58 | 0.013 | ⋅⋅⋅ | H ii (Schneider et al. 1994) |
| Q2225+0216 | 337.08 | +2.53 | 5.38 | 0.022 | ⋅⋅⋅ | H ii (Brosch, Bar-Or & Malka 2006) | |||||||
| 2007 | 69 | 70 | 200.2 | −43.4 | 308.6 | +19.2 | NGC 5128 (Cen A) | 201.37 | −43.02 | 0.93 | 0.001 | ? | ‘BL Lac’ (Israel 1998) |
| ESO 323−G77 | 196.61 | −40.41 | 4.01 | 0.015 | S1.2 | S1.2 | |||||||
| NGC 5244 | 204.68 | −45.86 | 4.67 | 0.008 | H2 | H ii (Moran et al. 1996) | |||||||
| ESO 323−G32 | 193.32 | −41.63 | 5.37 | 0.016 | S1.9 | S2 | |||||||
| ESO 269−G12 | 194.17 | −46.93 | 3.71 | 0.016 | ⋅⋅⋅ | S2 | |||||||
| 2007 | 84 | 64 | 143.2 | −18.3 | 250.6 | +23.8 | NGC 2989 | 146.36 | −18.37 | 3.00 | 0.013 | H2 | H ii (Gonçalves, Véron-Cetty & Véron 1999) |
| ESO 565−G19 | 143.68 | −21.93 | 3.66 | 0.015 | S2 | S2 | |||||||
| NGC 2992 | 146.43 | −14.33 | 5.04 | 0.008 | S1i | S1.8/S1.9 | |||||||
| 2007 | 145 | 78 | 47.7 | −12.8 | 196.2 | −54.4 | NGC 1204 | 46.17 | −12.34 | 1.57 | 0.014 | S2 | H ii (Sturm et al. 2006; Veilleux et al. 1995) |
| MCG -02.09.040 | 51.27 | −12.30 | 3.52 | 0.015 | S2 | S2 | |||||||
| MCG -02.08.031 | 44.04 | −13.69 | 3.67 | 0.023 | S2 | S2 | |||||||
| NGC 1241 | 47.81 | −8.92 | 3.88 | 0.013 | S2 | S2 | |||||||
| MCG -02.08.033 | 44.46 | −10.17 | 4.13 | 0.015 | S2 | S2 | |||||||
| 2007 | 193 | 90 | 325.5 | −33.5 | 12.1 | −49.0 | IC 5135 | 327.08 | −34.95 | 1.95 | 0.016 | S1.9 | S2 |
| NGC 7135 | 327.44 | −34.88 | 2.12 | 0.007 | ⋅⋅⋅ | H ii (Joguet et al. 2001) | |||||||
| NGC 7172 | 330.51 | −31.87 | 4.52 | 0.008 | S2 | S2 | |||||||
| ESO 404−G032 | 332.12 | −34.11 | 5.53 | 0.015 | S2 | S2 | |||||||
| 2007 | 221 | 71 | 212.7 | −3.3 | 338.2 | +54.1 | NGC 5506 | 213.31 | −3.21 | 0.62 | 0.007 | S1i | S2 |
| NGC 5427 | 210.86 | −6.03 | 3.29 | 0.009 | S2 | S2 |
Note. This table lists each Auger UHECR (with E > 57 EeV) whose arrival directions are within  of a nearby (z≤ 0.024) VCV galaxy, along with the correlated VCV object. The year and the Julian day when the UHECRs were recorded are given, as well their energies and positions (equatorial and Galactic) in degrees, from The Pierre Auger Collaboration (2008). This is followed by the name of the VCV galaxy, its position in degrees, its separation from the UHECR in degrees, its redshift and the VCV classification. Note that star-forming regions are also known as H ii or H2 regions because young stars ionize the hydrogen around them (neutral hydrogen is known as H i). The last column shows the correct optical classification (taken from the literature where available and confirmed in every case; citations are given for differences from VCV). NGC 5128 (Cen A) is a well-known Fanaroff–Riley I (FRI) radio galaxy whose nuclear activity is confirmed by the large radio jets. Its optical emission suggests a BL Lac nucleus, and we list this as its optical classification.
Auger UHECRs and correlated VCV galaxies.
| Year | Day | ECR (EeV) | RACR (J2000) | Dec.CR (J2000) | lCR (J2000) | bCR (J2000) | VCV galaxy | RAAGN (J2000) | Dec.AGN (J2000) | r (°) | z | VCV class | Real class |
| 2004 | 142 | 84 | 199.7 | −34.9 | 309.2 | +27.6 | ESO 383−G18 | 203.36 | −34.02 | 3.14 | 0.013 | S1.8 | S2 |
| MCG -06.30.015 | 203.97 | −34.30 | 3.57 | 0.008 | S1.5 | S1.2 | |||||||
| IC 4296 | 204.16 | −33.97 | 3.80 | 0.013 | S3 | LINER | |||||||
| NGC 5135 | 201.43 | −29.83 | 5.27 | 0.013 | S2 | S2 | |||||||
| NGC 4903 | 195.35 | −30.94 | 5.39 | 0.016 | S2 | S2 | |||||||
| NGC 5253 | 204.98 | −31.64 | 5.49 | 0.001 | H2 | H ii (Walsh & Roy 1989; Gonzalez-Riestra, Rego & Zamorano 1987) | |||||||
| 2004 | 282 | 66 | 208.0 | −60.3 | 310.4 | +1.7 | 4U 1344−60 | 206.90 | −60.62 | 0.63 | 0.013 | S1 | S1 |
| Circinus | 213.29 | −65.34 | 5.58 | 0.001 | S1h | S2 | |||||||
| 2004 | 339 | 83 | 268.5 | −61.0 | 332.3 | −17.0 | ESO 139−G12 | 264.41 | −59.94 | 2.27 | 0.017 | S2 | S2 |
| IC 4687 | 273.41 | −57.75 | 4.10 | 0.017 | H2 | H ii (Corbett et al. 2003) | |||||||
| NGC 6300 | 259.25 | −62.82 | 4.72 | 0.003 | S2 | S2 | |||||||
| PKS 1718−649 | 260.92 | −65.01 | 5.28 | 0.014 | S3 | LINER | |||||||
| F49 | 279.24 | −59.40 | 5.57 | 0.019 | S1h | S2 | |||||||
| 2004 | 343 | 63 | 224.5 | −44.2 | 325.6 | +13.0 | IC 4518A | 224.43 | −43.13 | 1.07 | 0.016 | S2 | S2 |
| NGC 5643 | 218.17 | −44.17 | 4.54 | 0.003 | S2 | S2 | |||||||
| ESO 328−IG36 | 228.71 | −40.34 | 4/96 | 0.024 | S1.8 | S1 | |||||||
| 2005 | 54 | 84 | 17.4 | −37.9 | 284.4 | −78.6 | NGC 424 | 17.87 | −38.08 | 0.41 | 0.011 | S1h | S1.5 |
| NGC 526A | 20.98 | −35.07 | 4.04 | 0.019 | S1.9 | S1.9 | |||||||
| IC 1657 | 18.53 | −32.65 | 5.33 | 0.012 | S2 | S2 | |||||||
| 2005 | 63 | 71 | 331.2 | −1.2 | 58.8 | −42.4 | Q2207+0122 | 332.62 | +1.62 | 3.16 | 0.013 | ⋅⋅⋅ | H ii (Schneider, Schmidt & Gunn 1994) |
| 2005 | 81 | 58 | 199.1 | −48.6 | 307.2 | +14.1 | NGC 4945 | 196.37 | −49.47 | 1.99 | 0.002 | S | S2 |
| IC 4200 | 197.39 | −51.97 | 3.54 | 0.013 | ⋅⋅⋅ | LINER | |||||||
| ESO 269−G12 | 194.17 | −46.93 | 3.71 | 0.016 | ⋅⋅⋅ | S2 | |||||||
| NGC 4785 | 193.36 | −48.75 | 3.79 | 0.012 | S2 | S2 | |||||||
| NGC 5244 | 204.68 | −45.86 | 4.67 | 0.008 | H2 | H ii (Moran, Halpern & Helfand 1996) | |||||||
| NGC 5128 (Cen A) | 201.37 | −43.02 | 5.80 | 0.001 | ? | ‘BL Lac’ (Israel 1998) | |||||||
| 2005 | 295 | 57 | 332.9 | −38.2 | 4.2 | −54.9 | IC 5169 | 332.54 | −36.09 | 2.13 | 0.010 | S2 | H ii (Kewley et al. 2001) |
| ESO 404−G032 | 332.12 | −34.11 | 4.14 | 0.015 | S2 | S2 | |||||||
| NGC 7135 | 327.44 | −34.88 | 5.50 | 0.007 | ⋅⋅⋅ | H ii (Joguet et al. 2001) | |||||||
| IC 5135 | 327.08 | −34.95 | 5.69 | 0.016 | S1.9 | S2 | |||||||
| 2005 | 306 | 59 | 315.3 | −0.3 | 48.8 | −28.7 | Zw 374.029 | 313.84 | +2.35 | 3.03 | 0.013 | S1h | NLS1 |
| UGC 11630 | 311.89 | +0.41 | 3.48 | 0.012 | S2 | S2 | |||||||
| IC 1368 | 318.55 | +2.18 | 4.09 | 0.013 | S2 | S2 | |||||||
| 1H 2044−032 | 311.80 | −3.07 | 4.46 | 0.015 | S1 | QSO | |||||||
| 2006 | 35 | 85 | 53.6 | −7.8 | 194.1 | −46.9 | SDSS J03349−0548 | 53.74 | −5.81 | 1.99 | 0.018 | S1 | S1 |
| SDSS J03302−0532 | 52.56 | −5.54 | 2.48 | 0.013 | S1 | S1 | |||||||
| NGC 1358 | 53.42 | −5.09 | 2.72 | 0.013 | S2 | S2 | |||||||
| SDSS J03457−0715 | 56.44 | −7.26 | 2.89 | 0.022 | S2 | S2 | |||||||
| MARK 612 | 52.67 | −3.14 | 4.75 | 0.020 | S2 | S2 | |||||||
| MCG -02.09.040 | 51.27 | −12.30 | 5.05 | 0.015 | S2 | S2 | |||||||
| MARK 607 | 51.20 | −3.04 | 5.32 | 0.009 | S2 | S2 | |||||||
| NGC 1241 | 47.81 | −8.92 | 5.84 | 0.013 | S2 | S2 | |||||||
| 2006 | 55 | 59 | 267.7 | −60.7 | 332.4 | −16.5 | ESO 139−G12 | 264.41 | −59.94 | 1.79 | 0.017 | S2 | S2 |
| IC 4687 | 273.41 | − 57.75 | 4.15 | 0.017 | H2 | H ii (Corbett et al. 2003) | |||||||
| NGC 6300 | 259.25 | −62.82 | 4.72 | 0.003 | S2 | S2 | |||||||
| PKS 1718−649 | 260.92 | −65.01 | 5.28 | 0.014 | S3 | LINER | |||||||
| F 49 | 279.24 | −59.40 | 5.57 | 0.019 | S1h | S2 | |||||||
| 2006 | 81 | 79 | 201.1 | −55.3 | −52.3 | +7.3 | IC 4200 | 197.39 | −51.97 | 3.54 | 0.013 | ⋅⋅⋅ | LINER |
| 2006 | 185 | 83 | 350.0 | +9.6 | 88.8 | −47.1 | NGC 7591 | 349.57 | +6.59 | 3.04 | 0.017 | S | H ii (Sturm et al. 2006; Veilleux et al. 1995) |
| NGC 7672 | 351.88 | +12.39 | 3.34 | 0.013 | S2 | S2 | |||||||
| IC 1481 | 349.86 | +5.91 | 3.70 | 0.020 | S3 | LINER | |||||||
| NGC 7469 | 345.82 | +8.87 | 4.19 | 0.017 | S1.5 | S1.2 | |||||||
| NGC 7479 | 346.24 | +12.32 | 4.59 | 0.007 | S1.9 | S2-L | |||||||
| 2006 | 296 | 69 | 52.8 | −4.5 | 189.4 | −45.7 | NGC 1358 | 53.42 | −5.09 | 0.85 | 0.013 | S2 | S2 |
| SDSS J03302−0532 | 52.56 | −5.54 | 1.07 | 0.013 | S1 | S1 | |||||||
| MARK 612 | 52.67 | −3.14 | 4.75 | 0.020 | S2 | S2 | |||||||
| SDSS J03349−0548 | 53.74 | −5.81 | 1.61 | 0.018 | S1 | S1 | |||||||
| MARK 607 | 51.20 | −3.42 | 2.16 | 0.009 | S2 | S2 | |||||||
| NGC 1266 | 49.00 | −2.43 | 4.32 | 0.007 | S? | LINER | |||||||
| SDSS J03457−0715 | 56.44 | −7.26 | 2.89 | 0.022 | S2 | NLAGN | |||||||
| 2006 | 299 | 69 | 200.9 | −45.3 | 308.8 | +17.2 | NGC 5128 (Cen A) | 201.37 | −43.02 | 2.31 | 0.001 | ? | ‘BL Lac’ (Israel 1998) |
| NGC 5244 | 204.66 | −45.86 | 2.70 | 0.008 | H2 | H ii (Moran et al. 1996) | |||||||
| ESO 269−G12 | 194.17 | −46.93 | 3.71 | 0.016 | ⋅⋅⋅ | S2 | |||||||
| NGC 4945 | 196.37 | −49.47 | 1.99 | 0.002 | S | S2 | |||||||
| ESO 323−G77 | 196.61 | −40.41 | 5.81 | 0.015 | S1.2 | S1.2 | |||||||
| 2007 | 13 | 148 | 192.7 | −21.0 | −57.2 | +41.8 | ESO 575−IG016 | 193.15 | −21.91 | 1.00 | 0.0223 | S2 | S2 |
| CTS J10.09 | 188.46 | −21.06 | 3.95 | 0.023 | S2 | S2 | |||||||
| ESO 507−G70 | 195.72 | − 23.92 | 4.04 | 0.022 | S | Ambiguous (Corbett et al. 2003) | |||||||
| NGC 4968 | 196.77 | −23.68 | 4.62 | 0.009 | S2 | S2 | |||||||
| ESO 508−G05 | 196.74 | −23.92 | 4.73 | 0.010 | S2 | No emission (Joguet et al. 2001) | |||||||
| PKS 1306−241 | 197.17 | −24.38 | 5.34 | 0.14 | S2 | S2 | |||||||
| 2007 | 51 | 58 | 331.7 | +2.9 | 63.5 | −40.2 | Q2207+0122 | 332.62 | +1.62 | 1.58 | 0.013 | ⋅⋅⋅ | H ii (Schneider et al. 1994) |
| Q2225+0216 | 337.08 | +2.53 | 5.38 | 0.022 | ⋅⋅⋅ | H ii (Brosch, Bar-Or & Malka 2006) | |||||||
| 2007 | 69 | 70 | 200.2 | −43.4 | 308.6 | +19.2 | NGC 5128 (Cen A) | 201.37 | −43.02 | 0.93 | 0.001 | ? | ‘BL Lac’ (Israel 1998) |
| ESO 323−G77 | 196.61 | −40.41 | 4.01 | 0.015 | S1.2 | S1.2 | |||||||
| NGC 5244 | 204.68 | −45.86 | 4.67 | 0.008 | H2 | H ii (Moran et al. 1996) | |||||||
| ESO 323−G32 | 193.32 | −41.63 | 5.37 | 0.016 | S1.9 | S2 | |||||||
| ESO 269−G12 | 194.17 | −46.93 | 3.71 | 0.016 | ⋅⋅⋅ | S2 | |||||||
| 2007 | 84 | 64 | 143.2 | −18.3 | 250.6 | +23.8 | NGC 2989 | 146.36 | −18.37 | 3.00 | 0.013 | H2 | H ii (Gonçalves, Véron-Cetty & Véron 1999) |
| ESO 565−G19 | 143.68 | −21.93 | 3.66 | 0.015 | S2 | S2 | |||||||
| NGC 2992 | 146.43 | −14.33 | 5.04 | 0.008 | S1i | S1.8/S1.9 | |||||||
| 2007 | 145 | 78 | 47.7 | −12.8 | 196.2 | −54.4 | NGC 1204 | 46.17 | −12.34 | 1.57 | 0.014 | S2 | H ii (Sturm et al. 2006; Veilleux et al. 1995) |
| MCG -02.09.040 | 51.27 | −12.30 | 3.52 | 0.015 | S2 | S2 | |||||||
| MCG -02.08.031 | 44.04 | −13.69 | 3.67 | 0.023 | S2 | S2 | |||||||
| NGC 1241 | 47.81 | −8.92 | 3.88 | 0.013 | S2 | S2 | |||||||
| MCG -02.08.033 | 44.46 | −10.17 | 4.13 | 0.015 | S2 | S2 | |||||||
| 2007 | 193 | 90 | 325.5 | −33.5 | 12.1 | −49.0 | IC 5135 | 327.08 | −34.95 | 1.95 | 0.016 | S1.9 | S2 |
| NGC 7135 | 327.44 | −34.88 | 2.12 | 0.007 | ⋅⋅⋅ | H ii (Joguet et al. 2001) | |||||||
| NGC 7172 | 330.51 | −31.87 | 4.52 | 0.008 | S2 | S2 | |||||||
| ESO 404−G032 | 332.12 | −34.11 | 5.53 | 0.015 | S2 | S2 | |||||||
| 2007 | 221 | 71 | 212.7 | −3.3 | 338.2 | +54.1 | NGC 5506 | 213.31 | −3.21 | 0.62 | 0.007 | S1i | S2 |
| NGC 5427 | 210.86 | −6.03 | 3.29 | 0.009 | S2 | S2 |
| Year | Day | ECR (EeV) | RACR (J2000) | Dec.CR (J2000) | lCR (J2000) | bCR (J2000) | VCV galaxy | RAAGN (J2000) | Dec.AGN (J2000) | r (°) | z | VCV class | Real class |
| 2004 | 142 | 84 | 199.7 | −34.9 | 309.2 | +27.6 | ESO 383−G18 | 203.36 | −34.02 | 3.14 | 0.013 | S1.8 | S2 |
| MCG -06.30.015 | 203.97 | −34.30 | 3.57 | 0.008 | S1.5 | S1.2 | |||||||
| IC 4296 | 204.16 | −33.97 | 3.80 | 0.013 | S3 | LINER | |||||||
| NGC 5135 | 201.43 | −29.83 | 5.27 | 0.013 | S2 | S2 | |||||||
| NGC 4903 | 195.35 | −30.94 | 5.39 | 0.016 | S2 | S2 | |||||||
| NGC 5253 | 204.98 | −31.64 | 5.49 | 0.001 | H2 | H ii (Walsh & Roy 1989; Gonzalez-Riestra, Rego & Zamorano 1987) | |||||||
| 2004 | 282 | 66 | 208.0 | −60.3 | 310.4 | +1.7 | 4U 1344−60 | 206.90 | −60.62 | 0.63 | 0.013 | S1 | S1 |
| Circinus | 213.29 | −65.34 | 5.58 | 0.001 | S1h | S2 | |||||||
| 2004 | 339 | 83 | 268.5 | −61.0 | 332.3 | −17.0 | ESO 139−G12 | 264.41 | −59.94 | 2.27 | 0.017 | S2 | S2 |
| IC 4687 | 273.41 | −57.75 | 4.10 | 0.017 | H2 | H ii (Corbett et al. 2003) | |||||||
| NGC 6300 | 259.25 | −62.82 | 4.72 | 0.003 | S2 | S2 | |||||||
| PKS 1718−649 | 260.92 | −65.01 | 5.28 | 0.014 | S3 | LINER | |||||||
| F49 | 279.24 | −59.40 | 5.57 | 0.019 | S1h | S2 | |||||||
| 2004 | 343 | 63 | 224.5 | −44.2 | 325.6 | +13.0 | IC 4518A | 224.43 | −43.13 | 1.07 | 0.016 | S2 | S2 |
| NGC 5643 | 218.17 | −44.17 | 4.54 | 0.003 | S2 | S2 | |||||||
| ESO 328−IG36 | 228.71 | −40.34 | 4/96 | 0.024 | S1.8 | S1 | |||||||
| 2005 | 54 | 84 | 17.4 | −37.9 | 284.4 | −78.6 | NGC 424 | 17.87 | −38.08 | 0.41 | 0.011 | S1h | S1.5 |
| NGC 526A | 20.98 | −35.07 | 4.04 | 0.019 | S1.9 | S1.9 | |||||||
| IC 1657 | 18.53 | −32.65 | 5.33 | 0.012 | S2 | S2 | |||||||
| 2005 | 63 | 71 | 331.2 | −1.2 | 58.8 | −42.4 | Q2207+0122 | 332.62 | +1.62 | 3.16 | 0.013 | ⋅⋅⋅ | H ii (Schneider, Schmidt & Gunn 1994) |
| 2005 | 81 | 58 | 199.1 | −48.6 | 307.2 | +14.1 | NGC 4945 | 196.37 | −49.47 | 1.99 | 0.002 | S | S2 |
| IC 4200 | 197.39 | −51.97 | 3.54 | 0.013 | ⋅⋅⋅ | LINER | |||||||
| ESO 269−G12 | 194.17 | −46.93 | 3.71 | 0.016 | ⋅⋅⋅ | S2 | |||||||
| NGC 4785 | 193.36 | −48.75 | 3.79 | 0.012 | S2 | S2 | |||||||
| NGC 5244 | 204.68 | −45.86 | 4.67 | 0.008 | H2 | H ii (Moran, Halpern & Helfand 1996) | |||||||
| NGC 5128 (Cen A) | 201.37 | −43.02 | 5.80 | 0.001 | ? | ‘BL Lac’ (Israel 1998) | |||||||
| 2005 | 295 | 57 | 332.9 | −38.2 | 4.2 | −54.9 | IC 5169 | 332.54 | −36.09 | 2.13 | 0.010 | S2 | H ii (Kewley et al. 2001) |
| ESO 404−G032 | 332.12 | −34.11 | 4.14 | 0.015 | S2 | S2 | |||||||
| NGC 7135 | 327.44 | −34.88 | 5.50 | 0.007 | ⋅⋅⋅ | H ii (Joguet et al. 2001) | |||||||
| IC 5135 | 327.08 | −34.95 | 5.69 | 0.016 | S1.9 | S2 | |||||||
| 2005 | 306 | 59 | 315.3 | −0.3 | 48.8 | −28.7 | Zw 374.029 | 313.84 | +2.35 | 3.03 | 0.013 | S1h | NLS1 |
| UGC 11630 | 311.89 | +0.41 | 3.48 | 0.012 | S2 | S2 | |||||||
| IC 1368 | 318.55 | +2.18 | 4.09 | 0.013 | S2 | S2 | |||||||
| 1H 2044−032 | 311.80 | −3.07 | 4.46 | 0.015 | S1 | QSO | |||||||
| 2006 | 35 | 85 | 53.6 | −7.8 | 194.1 | −46.9 | SDSS J03349−0548 | 53.74 | −5.81 | 1.99 | 0.018 | S1 | S1 |
| SDSS J03302−0532 | 52.56 | −5.54 | 2.48 | 0.013 | S1 | S1 | |||||||
| NGC 1358 | 53.42 | −5.09 | 2.72 | 0.013 | S2 | S2 | |||||||
| SDSS J03457−0715 | 56.44 | −7.26 | 2.89 | 0.022 | S2 | S2 | |||||||
| MARK 612 | 52.67 | −3.14 | 4.75 | 0.020 | S2 | S2 | |||||||
| MCG -02.09.040 | 51.27 | −12.30 | 5.05 | 0.015 | S2 | S2 | |||||||
| MARK 607 | 51.20 | −3.04 | 5.32 | 0.009 | S2 | S2 | |||||||
| NGC 1241 | 47.81 | −8.92 | 5.84 | 0.013 | S2 | S2 | |||||||
| 2006 | 55 | 59 | 267.7 | −60.7 | 332.4 | −16.5 | ESO 139−G12 | 264.41 | −59.94 | 1.79 | 0.017 | S2 | S2 |
| IC 4687 | 273.41 | − 57.75 | 4.15 | 0.017 | H2 | H ii (Corbett et al. 2003) | |||||||
| NGC 6300 | 259.25 | −62.82 | 4.72 | 0.003 | S2 | S2 | |||||||
| PKS 1718−649 | 260.92 | −65.01 | 5.28 | 0.014 | S3 | LINER | |||||||
| F 49 | 279.24 | −59.40 | 5.57 | 0.019 | S1h | S2 | |||||||
| 2006 | 81 | 79 | 201.1 | −55.3 | −52.3 | +7.3 | IC 4200 | 197.39 | −51.97 | 3.54 | 0.013 | ⋅⋅⋅ | LINER |
| 2006 | 185 | 83 | 350.0 | +9.6 | 88.8 | −47.1 | NGC 7591 | 349.57 | +6.59 | 3.04 | 0.017 | S | H ii (Sturm et al. 2006; Veilleux et al. 1995) |
| NGC 7672 | 351.88 | +12.39 | 3.34 | 0.013 | S2 | S2 | |||||||
| IC 1481 | 349.86 | +5.91 | 3.70 | 0.020 | S3 | LINER | |||||||
| NGC 7469 | 345.82 | +8.87 | 4.19 | 0.017 | S1.5 | S1.2 | |||||||
| NGC 7479 | 346.24 | +12.32 | 4.59 | 0.007 | S1.9 | S2-L | |||||||
| 2006 | 296 | 69 | 52.8 | −4.5 | 189.4 | −45.7 | NGC 1358 | 53.42 | −5.09 | 0.85 | 0.013 | S2 | S2 |
| SDSS J03302−0532 | 52.56 | −5.54 | 1.07 | 0.013 | S1 | S1 | |||||||
| MARK 612 | 52.67 | −3.14 | 4.75 | 0.020 | S2 | S2 | |||||||
| SDSS J03349−0548 | 53.74 | −5.81 | 1.61 | 0.018 | S1 | S1 | |||||||
| MARK 607 | 51.20 | −3.42 | 2.16 | 0.009 | S2 | S2 | |||||||
| NGC 1266 | 49.00 | −2.43 | 4.32 | 0.007 | S? | LINER | |||||||
| SDSS J03457−0715 | 56.44 | −7.26 | 2.89 | 0.022 | S2 | NLAGN | |||||||
| 2006 | 299 | 69 | 200.9 | −45.3 | 308.8 | +17.2 | NGC 5128 (Cen A) | 201.37 | −43.02 | 2.31 | 0.001 | ? | ‘BL Lac’ (Israel 1998) |
| NGC 5244 | 204.66 | −45.86 | 2.70 | 0.008 | H2 | H ii (Moran et al. 1996) | |||||||
| ESO 269−G12 | 194.17 | −46.93 | 3.71 | 0.016 | ⋅⋅⋅ | S2 | |||||||
| NGC 4945 | 196.37 | −49.47 | 1.99 | 0.002 | S | S2 | |||||||
| ESO 323−G77 | 196.61 | −40.41 | 5.81 | 0.015 | S1.2 | S1.2 | |||||||
| 2007 | 13 | 148 | 192.7 | −21.0 | −57.2 | +41.8 | ESO 575−IG016 | 193.15 | −21.91 | 1.00 | 0.0223 | S2 | S2 |
| CTS J10.09 | 188.46 | −21.06 | 3.95 | 0.023 | S2 | S2 | |||||||
| ESO 507−G70 | 195.72 | − 23.92 | 4.04 | 0.022 | S | Ambiguous (Corbett et al. 2003) | |||||||
| NGC 4968 | 196.77 | −23.68 | 4.62 | 0.009 | S2 | S2 | |||||||
| ESO 508−G05 | 196.74 | −23.92 | 4.73 | 0.010 | S2 | No emission (Joguet et al. 2001) | |||||||
| PKS 1306−241 | 197.17 | −24.38 | 5.34 | 0.14 | S2 | S2 | |||||||
| 2007 | 51 | 58 | 331.7 | +2.9 | 63.5 | −40.2 | Q2207+0122 | 332.62 | +1.62 | 1.58 | 0.013 | ⋅⋅⋅ | H ii (Schneider et al. 1994) |
| Q2225+0216 | 337.08 | +2.53 | 5.38 | 0.022 | ⋅⋅⋅ | H ii (Brosch, Bar-Or & Malka 2006) | |||||||
| 2007 | 69 | 70 | 200.2 | −43.4 | 308.6 | +19.2 | NGC 5128 (Cen A) | 201.37 | −43.02 | 0.93 | 0.001 | ? | ‘BL Lac’ (Israel 1998) |
| ESO 323−G77 | 196.61 | −40.41 | 4.01 | 0.015 | S1.2 | S1.2 | |||||||
| NGC 5244 | 204.68 | −45.86 | 4.67 | 0.008 | H2 | H ii (Moran et al. 1996) | |||||||
| ESO 323−G32 | 193.32 | −41.63 | 5.37 | 0.016 | S1.9 | S2 | |||||||
| ESO 269−G12 | 194.17 | −46.93 | 3.71 | 0.016 | ⋅⋅⋅ | S2 | |||||||
| 2007 | 84 | 64 | 143.2 | −18.3 | 250.6 | +23.8 | NGC 2989 | 146.36 | −18.37 | 3.00 | 0.013 | H2 | H ii (Gonçalves, Véron-Cetty & Véron 1999) |
| ESO 565−G19 | 143.68 | −21.93 | 3.66 | 0.015 | S2 | S2 | |||||||
| NGC 2992 | 146.43 | −14.33 | 5.04 | 0.008 | S1i | S1.8/S1.9 | |||||||
| 2007 | 145 | 78 | 47.7 | −12.8 | 196.2 | −54.4 | NGC 1204 | 46.17 | −12.34 | 1.57 | 0.014 | S2 | H ii (Sturm et al. 2006; Veilleux et al. 1995) |
| MCG -02.09.040 | 51.27 | −12.30 | 3.52 | 0.015 | S2 | S2 | |||||||
| MCG -02.08.031 | 44.04 | −13.69 | 3.67 | 0.023 | S2 | S2 | |||||||
| NGC 1241 | 47.81 | −8.92 | 3.88 | 0.013 | S2 | S2 | |||||||
| MCG -02.08.033 | 44.46 | −10.17 | 4.13 | 0.015 | S2 | S2 | |||||||
| 2007 | 193 | 90 | 325.5 | −33.5 | 12.1 | −49.0 | IC 5135 | 327.08 | −34.95 | 1.95 | 0.016 | S1.9 | S2 |
| NGC 7135 | 327.44 | −34.88 | 2.12 | 0.007 | ⋅⋅⋅ | H ii (Joguet et al. 2001) | |||||||
| NGC 7172 | 330.51 | −31.87 | 4.52 | 0.008 | S2 | S2 | |||||||
| ESO 404−G032 | 332.12 | −34.11 | 5.53 | 0.015 | S2 | S2 | |||||||
| 2007 | 221 | 71 | 212.7 | −3.3 | 338.2 | +54.1 | NGC 5506 | 213.31 | −3.21 | 0.62 | 0.007 | S1i | S2 |
| NGC 5427 | 210.86 | −6.03 | 3.29 | 0.009 | S2 | S2 |
Note. This table lists each Auger UHECR (with E > 57 EeV) whose arrival directions are within of a nearby (z≤ 0.024) VCV galaxy, along with the correlated VCV object. The year and the Julian day when the UHECRs were recorded are given, as well their energies and positions (equatorial and Galactic) in degrees, from The Pierre Auger Collaboration (2008). This is followed by the name of the VCV galaxy, its position in degrees, its separation from the UHECR in degrees, its redshift and the VCV classification. Note that star-forming regions are also known as H ii or H2 regions because young stars ionize the hydrogen around them (neutral hydrogen is known as H i). The last column shows the correct optical classification (taken from the literature where available and confirmed in every case; citations are given for differences from VCV). NGC 5128 (Cen A) is a well-known Fanaroff–Riley I (FRI) radio galaxy whose nuclear activity is confirmed by the large radio jets. Its optical emission suggests a BL Lac nucleus, and we list this as its optical classification.
Having estimated the uncertainty in the purity of VCV, we next measure the uniformity of its coverage. To do this we compare the surface density of the VCV catalogue (with galaxies labelled as H2 removed) to that of a complete, volume-limited catalogue of galaxies. Two Micron All Sky Survey (2MASS; Skrutskie et al. 2006) imaged the whole sky in the near-infrared (J, H and K bands) and the 2MASS extended source catalogue contains positions and fluxes of all galaxies on the sky down to a limiting K-band magnitude of 13.5 (Jarrett et al. 2000). This waveband provides an excellent, unbiased measure of the distribution of matter in the Universe except where it is incomplete due to Galactic extinction. Recently, redshifts for the K < 11.25 brightest of these galaxies have been compiled. We use this 2MASS Redshift Survey (2MRS) catalogue (Huchra, private communication) to compare with VCV. Studies (Wake et al. 2004; Li et al. 2006) show that AGNs are clustered like galaxies. Therefore, comparing the number of VCV galaxies to the number of 2MRS galaxies over different parts of the sky will give a quantitative measure of the inhomogeneity and the relative incompleteness of the VCV catalogue.
We divide the sky into 192 equal area patches of ≈200 deg2 each, using healpix (Górski et al. 2005) (currently, http://healpix.jpl.nasa.gov) and find the number of VCV and 2MRS galaxies in each patch. The upper and middle panels of Fig. 1 show the surface densities of 2MRS galaxies and of VCV galaxies in equatorial coordinates, for z≤ 0.018 on the left and for z≤ 0.024 on the right. There are 417 (624) VCV and 5097 (6214) 2MRS galaxies in the respective samples with z≤ 0.018(≤ 0.024), for average VCV/2MRS ratios 0.08(0.10). The paucity of both 2MRS and VCV galaxies near the Galactic Centre in particular and in the Galactic plane in general is due to dust extinction in the Galaxy. The lower panels show the ratio of the number of VCV to 2MRS, or dark blue (zero) if there are no VCV galaxies in the pixel. The uncertainty in the ratio due to Poisson noise can be estimated from the number count maps provided in the upper panels.
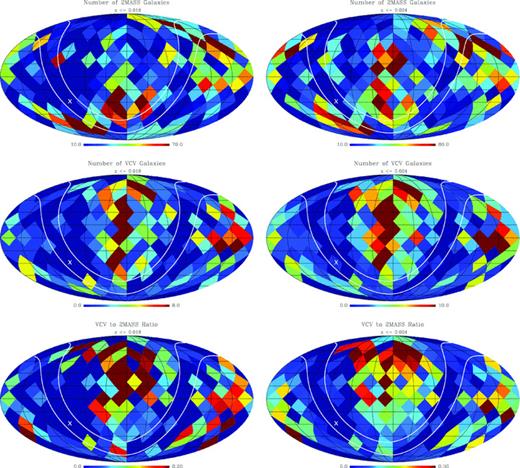
healpix maps of the surface density distribution of 2MRS galaxies (top) and VCV galaxies (middle). The white lines are at b=±10° and the cross is at the Galactic Centre. The bottom panels show the ratio of VCV to 2MRS galaxies, for z≤ 0.018 (left) and z≤ 0.024 (right), showing the large variation in completeness of VCV. The maps are in equatorial coordinates with RA = 180° at the centre of the map, using the Mollwide projection. Each map has 192 equal area pixels. The Virgo cluster is centred on RA = 187°, Dec. = 13°.
It is apparent that relatively more AGN-like galaxies have been identified in the Northern hemisphere than in the Southern hemisphere, which is not surprising in view of the Sloan Digital Sky Survey’s sky coverage and the dedicated search by Ho, Filippenko & Sargent (1997) for very low luminosity AGN in the Northern hemisphere. In addition to this large-scale difference between hemispheres, the plots in Fig. 1 show that the pixel-to-pixel variation in AGN detection is very large. The VCV/2MRS ratio ranges from between 0 and 77 per cent for z≤ 0.018 to between 0 and 91 per cent for z≤ 0.024. The VCV/2MRS ratio is ≤1 per cent in 32 per cent (22 per cent) of the pixels, with ∼90 per cent of the patches having ratios below 30 per cent for z≤ 0.018 and 20 per cent in the deeper sample. This large degree of inhomogeneity in the AGN sampling of VCV means that even if AGNs (or another type of galaxy that is concentrated in VCV) are the sources of UHECRs, the distribution of UHECR arrival directions cannot be expected to mirror the distribution of VCV galaxies. In particular, VCV is highly oversampled in the Virgo region, by a factor of ∼5 within a 10° radius of the centre of the Virgo cluster for z≤ 0.018, and by a factor of ∼3 for z≤ 0.024, so the absence of UHECR events from this region is compatible with the UHECR–VCV correlation seen in other regions, within statistical fluctuations.
For correlation studies, it is important to limit the analysis to regions in which the 2MRS galaxy catalogue is complete. As shown in Fig. 2, which plots the 2MRS galaxies with z≤ 0.018 versus b,Galactic extinction is an important effect for |b| ≲ 10°. At larger latitudes, volume-selected subsamples of this catalogue should provide a good map of the matter in the nearby Universe. Therefore, we restrict our analyses below to |b| ≥ 10° and z≤ 0.024, where the 2MRS K = 11.25 catalogue contains 11 851 galaxies. We will work with two volume-limited 2MRS catalogues, with z≤ 0.018 and ≤0.024; these catalogues have MK≤−23.2 and ≤−23.8, respectively. Altogether, there are 405 (606) VCV galaxies and 4525 (5516) 2MRS galaxies in these volume-limited subcatalogues within these redshift limits and with |b| ≥ 10°. Thus on average, there are about 0.09 (0.11) VCV galaxies for each 2MRS galaxy in the volume-limited samples, with |b| ≥ 10° and in the redshift ranges of interest.
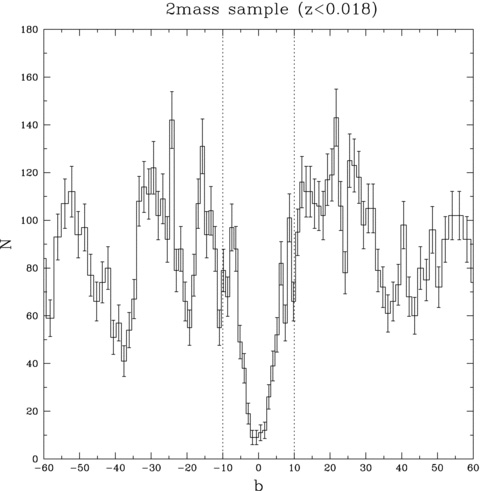
Distribution of 2MRS galaxies within z≤ 0.018, as a function of Galactic latitude.
Fig. 3 compares the density distribution of VCV galaxies (with those labelled H2 by VCV removed and |b| ≥ 10°) to volume-limited and flux-limited samples of 2MRS galaxies out to z≤ 0.024. The volume-limited sample is binned in equal volume and the flux-limited sample is binned in equal Δz, in order to have meaningful statistics in each bin. One sees that VCV is oversampled at low z in comparison to both the flux-limited or volume-limited 2MRS catalogues.
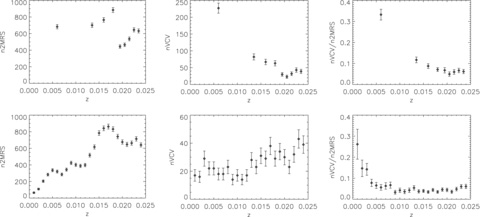
Distribution of 2MRS galaxies with |b| ≥ 10°, in a volume-limited (top left) and a flux-limited (bottom left) sample to z≤ 0.024. Equal-volume and equal-Δz bins are used, respectively, to have reasonable numbers of events in each bin. The centre column contains the same plots for VCV galaxies and the right-hand column plots show the ratio of the number of VCV galaxies to the number of volume-limited (above) and flux-limited (below) 2MRS galaxies.
3 UHECR CORRELATIONS WITH VCV
We set the stage for our studies by reviewing the Auger scan analysis using the 27 published UHECR events and scanning over the maximum angular separation, ψ, and over the maximum redshift of the galaxies, imposing a Galactic latitude cut |b| ≥ 10°. We scan on source distance and maximum angular separation, ψ, but not on energy threshold, because lower energy UHECR events are not publicly available. There are 694 galaxies in the VCV catalogue with z≤ 0.024 of which 674 have |b| ≥ 10°, and our UHECR data set consists of the 22 published Auger events above 57 EeV (The Pierre Auger Collaboration 2008) with |b| ≥ 10°. We scan in steps of  between separation angles of 1° and 6° and Δz = 0.001 between z = 0.000 and 0.024. For each combination of zmax, and ψ, we determine p, the exposure-weighted projection of discs of radius ψ around each AGN in the sample, normalized to the total Auger exposure. From the number of correlated UHECRs, kcorr, we compute the associated probability measure P, which following Auger is the cumulative binomial probability to find kcorr correlated events out of NCR cosmic rays, given the exposure-weighted fractional coverage p of AGNs. The minimum value of P in the scan analysis with VCV galaxies occurs for zmax = 0.018, and ψ=
 . For these parameter values, 19 UHECRs correlate with AGNs and the exposure-weighted fraction of sky covered by VCV galaxies is p = 0.2343. This results in a value of the probability measure of P = 7.7 × 10⁻¹⁰.
Following Auger (The Pierre Auger Collaboration 2007, 2008), the chance probability of the correlation is assessed by making many mock catalogues of UHECRs with 22 arrival directions chosen at random according to the Auger exposure, and then performing the same scan on ψ and zmax. The resultant probability of finding as low or lower value of P by chance, for an isotropic source distribution, is (7.1 ± 2.3) × 10−8. (Note that the values of various quantities quoted above are not identical to the corresponding quantities in the Auger analysis because of our restriction on |b| ≥ 10° and the absence of the scan on energy.)
We next estimate the effect on the UHECR–VCV correlation, of restricting to galaxies in VCV which are confirmed AGNs, quasars or BL Lacs. The primary, and dominant, effect of removing galaxies not confirmed to be optical AGNs from the VCV catalogue comes from correcting the classifications of VCV galaxies close to UHECRs, and thereby reducing the possible number of galaxies that can be correlated; a secondary effect is that the cleaned source catalogue is sparser, reducing p, the sky coverage fraction, which reduces the accidental correlation rate.
To create a ‘cleaned VCV’ catalogue (cVCV) we begin by removing the 14 not optically confirmed AGNs with z≤ 0.024 within 6° of the Auger UHECRs. Then, we ‘statistically clean’ the remainder of the 628 (694 − 66) VCV galaxies with z≤ 0.024 which are more than 6° from a UHECR as follows. First, we keep the 167 galaxies labelled S1.x and we remove all 66 galaxies labelled as H2. For the remaining 381 galaxies labelled S2, S3, ?, or unlabelled by VCV, we keep a fraction 33/42 at random. This fraction is derived from the fact that 33 out of the 42 closely examined galaxies which do not have the S1 or H2 labels in VCV are confirmed to be AGNs by optical criteria. This leaves us with 533 galaxies. After requiring |b| ≥ 10°, our final cVCV sample contains a total of 516 galaxies. This procedure assumes that the statistics of the classification errors in the 66 galaxies within 6° of the Auger UHECRs are representative of the ensemble. While approximate, it gives quite an accurate indication of the correlation between optically confirmed AGNs and UHECRs since it is exact for the galaxies close enough to produce a correlation and only the statistical properties of the remainder matter. This is a very conservative approach since we only allow correlations to be found with galaxies which are confirmed to be AGNs.
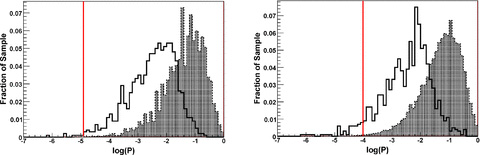
Repeating the scan with this cleaned VCV catalogue, we find that the most significant signal arises for zmax = 0.015 and ψ= , for which 18 UHECRs are correlated, p = 0.2891 and P = 4.1 × 10⁻⁷. The probability of getting a P value this small or smaller if UHECRs were isotropic is (3.8 ± 0.6) × 10−5. The shaded histograms in Fig. 4 show the distributions of P values over 106 different isotropic samples, for the VCV (left-hand panel) and cVCV (right-hand panel) cases. The values for the real VCV and cVCV correlation analyses are shown as vertical lines for purpose of comparison. Thus the correlation between UHECRs and the cleaned VCV catalogue is significantly stronger than for an isotropic source distribution, but less so than with the full VCV catalogue.
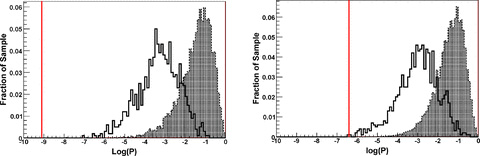
Left-hand panel: distribution of minimum P values for the 22 published Auger events with |b| ≥ 10° in ψ–zmax scans assuming an isotropic source distribution (106 trials, grey histograms), and 1000 different realizations of 2MRS-based source catalogues (open histograms). The minimum P value using the VCV catalogue is shown as a vertical line. The right-hand panel is the same but for the cleaned VCV catalogue, cVCV.
4 DO VCV GALAXIES MERELY ‘TRACE’ THE SOURCES OF UHECRs?
In this section we test whether the correlation of the highest energy UHECRs with VCV can result from VCV galaxies being ‘tracers’ of the true sources. AGNs are in first approximation a random subset of ordinary galaxies – indeed, all galaxies may undergo AGN phases as a result of mergers with another galaxy which stimulates accretion. An important question is therefore whether the  correlation scale might just reflect the galaxy clustering scale, inducing a similar correlation between UHECRs and any random sample of galaxies of the same size and redshift distribution as VCV.
The analysis we perform to answer this question is straightforward: repeat the correlation scan analyses with 2MRS galaxies and compare the results to the VCV correlation. Since 2MRS is an all-sky, uniform catalogue, galaxies drawn from 2MRS give an unbiased representation of the nearby large-scale structure. We create 1000 different subsamples of 2MRS1 with the same number of galaxies,2 674, and the same z distribution as the VCV catalogue. Specifically, we bin both the 2MRS and VCV catalogues in z, up to z = 0.024 in steps of 0.01. In each z bin, we randomly draw from the 2MRS sample, the number of galaxies that fall within that z bin in the VCV catalogue. Consequently, each subsample has 674 galaxies which, on average, follow the spatial distribution of 2MRS, i.e. the nearby large-scale structure, but have the z distribution of the VCV catalogue.3 Each subsample contains roughly 5.7 per cent of the 2MRS catalogue with z≤ 0.024. We draw 1000 such subsamples from 2MRS in order to have a good representation of the full 2MRS catalogue as well as to reduce the statistical error due to sampling. For each 2MRS subsample, we repeat the same correlation analysis as for VCV galaxies, described above, finding the value of zmax and ψ that minimizes the probability measure P for correlations with that subsample. We repeat the procedure with 1000 subsamples drawn with the same number of galaxies (and z distribution) as the cVCV catalogue, 516 galaxies. The open histograms in Fig. 4 show the resulting distributions of P values over the 1000 different 2MRS samples, for the VCV (left-hand panel) and cVCV (right-hand panel) cases. The values for the real VCV and cVCV correlation analyses are shown as vertical lines for purpose of comparison.
Fig. 4 shows that – not surprisingly – UHECRs correlate more strongly with 2MRS galaxies than they do with the isotropic samples. None the less, the correlations between UHECRs and VCV or cVCV are significantly stronger than with 2MRS galaxies: not one of our 1000 mock 2MRS samples has a P value smaller than that for VCV, and only one has a lower value than the P in the corresponding 1000 cVCV trials.
It is known that galaxy clustering depends on the mass and luminosity of the sample. Therefore, we repeated the analysis using the subsample with MK≤−23.8, which is volume-limited out to z≤ 0.024, instead of the 2MRS flux-limited sample. The results do not change significantly. The results of the mock catalogue analyses are also essentially the same whether the mock catalogues are chosen to have the same number of galaxies as VCV (cVCV) in redshift bins of Δz = 0.002, or just the same total number with z≤ 0.024.
Since the interest in the correlation of UHECRs with VCV galaxies and the choice of 57 EeV cut-off resulted from the analysis of the pre-prescription events (those taken prior to 2006 May 28), in order to assess the true unbiased significance of the correlation we must restrict to the post-prescription UHECR data set (taken between 2006 May 28 and 2007 August 31) and repeat the analysis described above with these 11 events only. The results are shown in Fig. 5. Scanning with the VCV galaxies, the lowest value of P is for zmax = 0.014 and ψmax= . For these parameters, nine UHECRs are correlated and p = 0.1908, giving P = 1.3 × 10⁻⁵. Running the scan using 106 mock isotropic catalogues and 103 2MRS realizations, the chance probability of finding as low or lower a value of P from isotropic sources is (7.0 ± 0.3) × 10−4 and from 2MRS-distributed sources is 0.7 per cent. The same analysis for cVCV gives zmax = 0.009, ψmax=
 ; eight UHECRs are correlated, p = 0.1781, P = 1.0 × 10⁻⁴, and the chance probability is (3.6 ± 0.1) × 10−3 and 5.3 per cent, for isotropic and 2MRS subsamples, respectively. The correlation is weaker for both VCV and cVCV with post-prescription UHECRs than with the full UHECR data set, but this is normal due to the smaller number of events, and the fact that the 57-EeV cut-off was chosen to maximize the correlation with pre-prescription events.
As in Fig. 4, but restricting to the 11 post-prescription UHECR events. Only 0.7 per cent of the trials with 2MRS-based catalogues have as strong or stronger correlation than with VCV (left-hand panel) but this increases to ≈5 per cent for cVCV (right-hand panel).
The analysis presented here shows that the correlation between the arrival directions of published UHECRs and VCV galaxies is much stronger than the correlation with random subsamples of nearby large-scale structure drawn from the 2MRS catalogue. This implies that the correlation found by Auger is unlikely to be due simply to AGNs clustering like large-scale structure. This result is not in contradiction with the report (Kashti & Waxman 2009) of finding no excess correlation between UHECRs and VCV galaxies compared to that arising from UHECR sources following the distribution of matter, because the method in this paper is more sensitive than the one used in Kashti & Waxman (2009).
5 CONCLUSIONS
The report from the Pierre Auger Observatory (The Pierre Auger Collaboration 2007, 2008) of a correlation between the arrival directions of the UHECRs, and the positions of galaxies in the VCV ‘Catalog of Quasars and Active Galactic Nuclei’, 12th edn. (Véron-Cetty & Véron 2006) give tantalizing clues to the sources of UHECRs. However, many questions must be answered before AGNs can be confirmed or ruled out as the sources of UHECRs. In this paper, we address some of these questions, namely, (1) quantifying the incompleteness, inhomogeneity and impurity of the VCV catalogue, (2) assessing the effect of the impurity on the correlation reported by Auger and (3) testing whether the correlation results simply from VCV galaxies clustering like nearby large-scale structure.
We measured the completeness of the VCV AGN catalogue and find that it varies strongly as a function of location on the sky and redshift. Thus the VCV catalogue cannot be used to determine the fraction of UHECRs that are produced by AGNs. Furthermore, efforts to test or refute the UHECR–AGN correlation by comparing the global distribution of UHECRs to that of VCV galaxies are not valid. A uniform and well-characterized AGN catalogue will be essential for that purpose.
We followed up on the study of Zaw et al. (2009), which found that only 2/3 of the VCV galaxies within  of a UHECR are optically identifiable AGNs, by investigating whether there is a significant correlation when the possibly not AGNs are removed from the source catalogue. We find that the correlation is reduced but remains significant. As shown in Reviglio & Helfand (2006), only about half the AGNs identified at radio and X-ray wavelengths can be established as AGNs using purely optical criteria. Thus it will be interesting to find out whether some of the optically not identified as AGN galaxies in VCV do show AGN activity in radio or X-ray, or whether another type of source is needed in addition to AGNs.
Finally and most importantly, we have introduced a simple but effective way to determine whether the correlation observed between the UHECRs and galaxies in the VCV AGN catalogue may simply result from the fact that AGNs are galaxies and galaxies are clustered. If this were the source of the UHECR–VCV correlation, then repeatedly subsampling a complete catalogue of galaxies in the same redshift range to a similar density would regularly produce a comparable degree of correlation. Instead, we find that a correlation as strong as what is observed between the post-prescription Auger UHECRs (2006 May 28–2007 August 31) with |b| ≥ 10° and energy above 57 EeV, and galaxies in the VCV catalogue, occurs in fewer than 1 per cent of randomly drawn subsamples of either volume-limited or flux-limited 2MRS galaxy catalogues. As expected, such subsamples of galaxies do typically have a stronger correlation with UHECRs than found for an isotropic source distribution, however, the increase in the correlation is too small to explain the extent of the correlation observed with VCV. While this does not prove that UHECRs are produced by and only by AGNs, it does suggest that the correlation cannot be explained merely by the fact that the AGN in VCV is clustered along with nearby large-scale structure.
We have removed the VCV galaxies from the 2MRS sample to avoid a correlation induced by the VCV content; this makes only an imperceptible difference in the scan results.
The scan method is sensitive to the number of galaxies in the catalogue, so it is important to have the same number of galaxies in the 2MRS subsamples as in VCV.
We have also done the sampling straight from 2MRS, without matching the VCV z distribution, and find that the difference in the results is not statistically significant.
We acknowledge the essential role of the Pierre Auger Collaboration in this work, which is based on data obtained and published by the Pierre Auger Observatory. Furthermore, GRF and IZ acknowledge their membership in the Pierre Auger Collaboration and thank their colleagues for their participation and contribution to this research. We especially thank J. Huchra and members of the 2MRS team for pre-release use of the 2MASS Redshift Survey K = 11.25 catalogue. Some of the results in this paper have been derived using the healpix (Górski et al. 2005) package. This research has been supported in part by NSF-PHY-0701451.
REFERENCES
