


Abstract
We have searched for star-forming galaxies at z≈ 7–10 by applying the Lyman-break technique to newly released Y-, J- and H-band images (1.1, 1.25 and 1.6 μm) from Wide Field Camera 3 (WFC3) on the Hubble Space Telescope. By comparing these images of the Hubble Ultra Deep Field with the Advanced Camera for Surveys (ACS) z′-band (0.85 μm) images, we identify objects with red colours, (z′−Y)AB > 1.3, consistent with the Lyman α forest absorption at z≈ 6.7–8.8. We identify 12 of these z′-drops down to a limiting magnitude YAB < 28.5 (equivalent to a star formation rate of 1.3 M⊙ yr−1 at z= 7.1), all of which are undetected in the other ACS filters. We use the WFC3 J-band image to eliminate contaminant low-mass Galactic stars, which typically have redder colours than z≈ 7 galaxies. One of our z′-drops is probably a T-dwarf star. The z≈ 7 z′-drops appear to have much bluer spectral slopes than Lyman-break galaxies at lower redshift. Our brightest z′-drop is not present in the NICMOS J-band image of the same field taken 5 years before, and is a possible transient object. From the 10 remaining z≈ 7 candidates we determine a lower limit on the star formation rate density of 0.0017 M⊙ yr−1 Mpc−3 for a Salpeter initial mass function, which rises to 0.0025–0.004 M⊙ yr−1 Mpc−3 after correction for luminosity bias. The star formation rate density is a factor of ≈10 less than that of Lyman-break galaxies at z= 3–4, and is about half the value at z≈ 6. We also present the discovery of seven Y-drop objects with (Y−J)AB > 1.0 and JAB < 28.5 which are candidate star-forming galaxies at higher redshifts (z≈ 8–9). We find no robust J-drop candidates at z≈ 10. While based on a single deep field, our results suggest that this star formation rate density would produce insufficient Lyman continuum photons to reionize the Universe unless the escape fraction of these photons is extremely high (fesc > 0.5), and the clumping factor of the Universe is low. Even then, we need to invoke a large contribution from galaxies below our detection limit (a steep faint-end slope). The apparent shortfall in ionizing photons might be alleviated if stellar populations at high redshift are of low metallicity or have a top-heavy initial mass function.
1 INTRODUCTION
In the past decade, the quest to observe the most distant galaxies in the Universe has rapidly expanded to the point where the discovery of z≃ 6 star-forming galaxies has now become routine. Deep imaging surveys with the Hubble Space Telescope (HST) and large ground-based telescopes have revealed hundreds of galaxies at z≃ 6 (Bunker et al. 2004; Yan & Windhorst 2004; Bouwens et al. 2006, 2007; Oesch et al. 2007; Yoshida et al. 2006; McLure et al. 2009). These searches typically rely on the Lyman-break galaxy (LBG) technique pioneered by Steidel and collaborators to identify star-forming galaxies at z≈ 3–4 (Steidel et al. 1996, 1999). Narrow-band searches have also proved successful in isolating the Lyman α emission line in redshift slices between z= and 7 (e.g. Rhoads et al. 2003; Smith & Jarvis 2007; Ota et al. 2008; Ouchi et al. 2008), although such searches at z > 7 are yet to yield plausible candidates (e.g. Willis et al. 2008). Rapid follow-up of Gamma Ray Bursts has also detected objects at z∼ 6, and most recently one at z= 8.2 (Salvaterra et al. 2009; Tanvir et al. 2009).
Parallel to these developments in identifying high-redshift objects has been the discovery of the onset of the Gunn & Peterson (1965) effect. This is the near-total absorption of the continuum flux shortwards of Lyman α in sources at z > 6.3 due to the intergalactic medium (IGM) having a much larger neutral fraction at high redshift. The Gunn–Peterson trough was first discovered in the spectra of Sloan Digital Sky Survey (SDSS) quasars (Becker et al. 2001; Fan et al. 2001, 2006). This defines the end of the reionization epoch, when the Universe transitioned from a neutral IGM. Latest results from Wilkinson Microwave Anisotropy probe (WMAP) indicate the mid-point of reionization may have occurred at z≈ 11 (Dunkley et al. 2009). The source of necessary ionizing photons remains an open question: the number density of high-redshift quasars is insufficient at z > 6 to achieve this (Fan et al. 2001; Dijkstra, Haiman & Loeb 2004). Star-forming galaxies at high redshift are another potential driver of reionization, but we must first determine their rest-frame UV luminosity density to assess whether they are plausible sources; the escape fraction of ionizing photons from these galaxies, along with the slope of their UV spectra, are other important and poorly constrained factors in determining whether star formation is responsible for the ionization of the IGM at high redshift.
Early results on the star formation rate (SFR) density at z≈ 6 were conflicting, with some groups claiming little to no evolution to z∼ 3 (Bouwens et al. 2003; Giavalisco et al. 2004) while other work suggested that the SFR density at z≈ 6 was significantly lower than in the well-studied LBGs at z= 3–4 (Stanway, Bunker & McMahon 2003). The consensus which has now emerged from later studies is that the abundance of luminous galaxies is substantially less at z≈ 6 than at z≈ 3 (Stanway et al. 2003; Bunker et al. 2004; Bouwens et al. 2006; Yoshida et al. 2006; McLure et al. 2009). If this trend continues to fainter systems and higher redshifts, then it may prove challenging for star-forming galaxies to provide the UV flux needed to fulfil reionization of the IGM (e.g. Bunker et al. 2004). Importantly, the analysis of the faint end of the luminosity function at high redshift has revealed that feeble galaxies contribute an increased fraction of the total UV luminosity (Bouwens et al. 2006, 2007; Oesch et al. 2009; McLure et al. 2009), suggesting that the bulk of star formation (and hence reionizing photons) likely comes from lower luminosity galaxies not yet adequately probed even in deep surveys.
Extending this work to the z≈ 7 universe has been stunted by small survey areas (from space) and low sensitivity (from the ground), limiting current z≈ 7 Lyman-break samples to ∼10 objects (e.g. Bouwens et al. 2008; Oesch et al. 2009; Ouchi et al. 2009), none of which has been spectroscopically confirmed.1 There is evidence of old stellar populations in z∼ 4–6 galaxies from measurements of the Balmer break in Spitzer/IRAC (InfraRed Array Camera) imaging (Eyles et al. 2005, 2007; Stark et al. 2007, 2009), which must have formed at higher redshift. However, the age-dating and mass determination of these stellar populations have many uncertainties, so searching directly for star formation at redshifts z≥ 7 is critical to measure the evolution of the SFR density, and address the role of galaxies in reionizing the universe.
The large field of view and enhanced sensitivity of the recently installed Wide Field Camera 3 (WFC3) on HST have the potential to make great progress in identifying larger samples of z > 6 LBGs, as it covers an area 6.5 times that of the previous-generation Near-Infrared Camera Multi Object Spectrograph (NICMOS) NIC3 camera, and has better spatial sampling, better sensitivity and a filter set better tuned to identifying high-redshift candidates through their colours. In this paper, we present an analysis of the recently obtained WFC3 near-infrared images of the Hubble Ultra Deep Field (UDF). We have previously used the i′- and z′-band Advanced Camera for Surveys (ACS) images to identify LBGs at z≈ 6 through their large i′−z′ colours (the i′-drops; Bunker et al. 2004). In this paper we use this ACS z′-band image in conjunction with the new WFC3 Y band to search for galaxies at z≈ 7, with a spectral break between these two filters (the z′-drops). We also analyse the new J- and H-band WFC3 images to eliminate low-redshift contaminants of the z′-drop selection through their near-infrared colours, and also to look for LBGs at higher redshifts (the Y- and J-drops at z≈ 8 and ≈10).
The structure of the paper is as follows. In Section 2 we describe the imaging data, the construction of our catalogues and our z′-drop selection (Fig. 1). In Section 3 we discuss the luminosity function of star-forming sources, likely contamination by lower-redshift interlopers, and estimate the evolution of the UV luminosity function at z≈ 7. Our conclusions are presented in Section 4. Throughout we adopt the standard ‘concordance’ cosmology of ΩM= 0.3, ΩΛ= 0.7, and use h70=H0/70 km s−1 Mpc−1. All magnitudes are on the AB system (Oke & Gunn 1983).
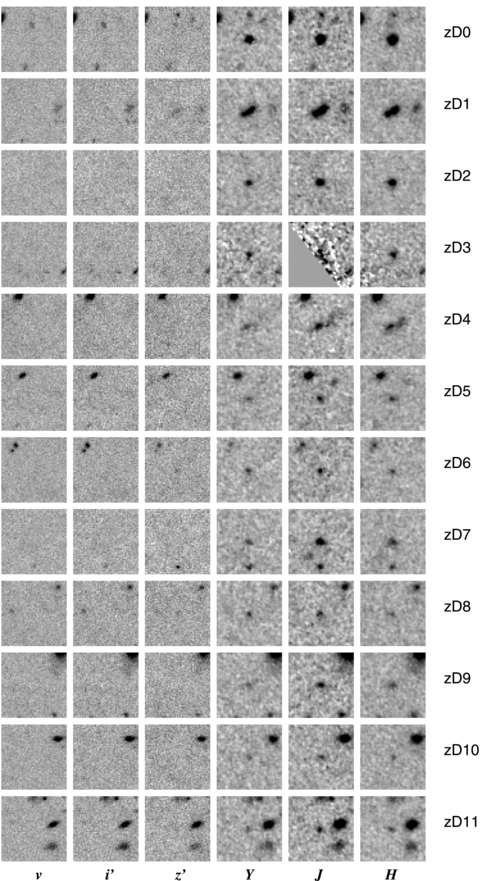
Postage stamp images of the z′-drops in the Hubble UDF. The ACS v, i′ and z′ images are shown alongside the WFC3 Y- and J-band image for each of our z′-drops satisfying (z′−Y)AB > 1.3, YAB < 28.5 and with no detection in the v band. Each image is 3 arcsec across, with north up and east to the left.
2 HST/WFC3 OBSERVATIONS
The near-infrared images of the Hubble UDF were taken with WFC3 on HST over the period 2009 August 26 to September 6. The infrared channel of WFC3 was used, which is a Teledyne 1014 × 1014 pixel HgCdTe detector, with a field of view of 123 × 136 (a 10-pixel strip on the edge is not illuminated by sky and is used for pedestal estimation). The data form part of the HST Treasury programme GO-11563 (PI: G. Illingworth). This 192-orbit programme will eventually obtain F105W (Y), F125W (J) and F160W (H) imaging of the UDF and two deep parallel fields, with the UDF observations comprising half of the total orbits. The UDF field lies within the Chandra Deep Field-South (CDF-S) with the centre of the WFC3 image located at coordinates  (J2000), and this field is within GOODS-South area (Giavalisco et al. 2004), surveyed using ACS with the same filters as the ACS UDF (b, v, i′, z′). The WFC3 field observed falls entirely within the 11 arcmin2 of the ACS UDF images. In this paper, we focus primarily on the Y-band WFC3 imaging of the UDF obtained over 2009 August 26–29 ut. This spanned 18 orbits, split into two-orbit ‘visits’ with two pointings within each orbit. There were small offsets (∼ <1 arcsec) between the four exposures taken in each visit, to allow for sub-pixel stepping and to prevent bad pixels repeating. Between visits there were larger offsets of up to 10 arcsec. The data were taken in ‘MULTIACCUM’ mode using sparsample100, which non-destructively reads the array every 100 s. These repeated non-destructive reads of the infrared array allow gradient fitting to obtain the count rate (‘sampling up the ramp’) and the flagging and rejection of cosmic ray strikes. Each MULTIACCUM exposure comprised 16 reads for a total duration of 1403 s per exposure.
To guard against the possible contamination of the high-redshift z′-drop sample by lower-redshift sources, we also analyse the new WFC3 J-band images, as lower-redshift galaxies and Galactic stars will have different Y−J colours to high-redshift galaxies even if their z′−Y colours are similar. The J-band imaging was taken over 2009 August 28–30 ut over 16 orbits, with each orbit again comprising two 1403 s sparsample100 observations and a similar dithering strategy. We also measured the (J−H) colours of the z′-drops to determine the UV spectral slopes; the WFC3 H-band imaging was taken from 2009 September 01 to 05 ut over 28 orbits and 56 sparsample100 exposures.
2.1 Data reduction
The data became public on 2009 September 9, and both the raw data and the output of the data reduction pipeline for individual frames were made available, but not the reduced final combined images. This pipeline (stsdas.calwfc3 in iraf) bias and dark subtracts the images, converts to units of electrons by multiplication by the gain and fits the count rate to the non-destructive reads of the MULTIACCUM sequence (flagging and rejecting cosmic ray strikes in the process). The single output frame from the MULTIACCUM sequence is flat-fielded, and we chose to work directly with these pipeline outputs. Of the nine visits in the Y-band observations, two were compromised by image persistence – perhaps due to observing a bright target shortly before the UDF. These eight frames were excluded from our combined image in case they introduced spurious sources. The remaining 28 frames, each of 1403 s duration, had residual background removed (which might be due to scattered light, variable dark current or small errors in the flat-fielding). This was accomplished using the xdimsum package (M. Dickinson et al.) within iraf, which makes an average background from the disregistered (dithered) images, with bright objects masked out so as not to bias the background measurement. This average background was then subtracted from all the frames, and the shifts between the images determined from the centroids of several compact objects in the field (the header World Coordinate System was found to be insufficiently accurate to satisfactorily register the images). All the frames had the same position angle (ORIENT of  ) so this shift-and-add was sufficient with no rotation required. The WFC3 point spread function (PSF) at short wavelengths is undersampled by the 0.13 arcsec pixels, so we magnified each pixel on to a 3 × 3 pixel grid so that we could shift the frames to achieve alignment at the sub-pixel level. We combined the background-subtracted, rebinned frames with imcombine in iraf, ignoring pixels flagged in a bad pixel mask and rejecting 4σ outliers. We survey 4.18 arcmin2 in all exposures (39300 s), and a further 0.67 arcmin2 is surveyed with about half of that exposure time. To make comparison with predicted number counts more straightforward, we restrict our analysis to the deepest 4.18 arcmin2 where the noise is approximately uniform. The J- and H-band data were reduced in an identical manner, except no frames were excluded from the combination, as the image persistence effects experienced in 22 per cent of the Y-band data were not observed in J and H bands. Hence the total J band integration was 32 exposures (44900 s), and in H it was 56 exposures (78600 s).
Usually undersampled imaging data from HST would be combined through geometric distortion correction and sub-pixel registration with the multidrizzle software (Koekemoer et al. 2002). However, at the time of writing, the necessary distortion files were unavailable for the new WFC3 instrument. Hence, we determined the mapping between x, y pixel space in the WFC3 images, and the celestial coordinates, by determining the centroids of several hundred objects in common between the WFC3 bands and the ACS z′-band image of Beckwith et al. (2006), which had been accurately astrometrically calibrated. We use the irafgeomap and geotran tasks to fit the distortions with a third-order polynomial surface, producing residuals of less than 0.05 arcsec. In correcting the geometric distortions in the WFC3 images, we mapped all the WFC3 Y, J, H images and ACS b, v, i′, z′ images to the same area, and an output pixelscale of 0.06 arcsec, equivalent to 2 × 2 binning of the original drizzled ACS pixels (0.03 arcsec).
The final frames had units of electrons per second, and we take the standard ACS zero-points for the UDF images. For the WFC3 F105W Y band, synphot reports an AB magnitude zero-point of 26.16 (such that a source of this brightness would have a count rate of 1 electron per second). The colour–magnitude diagram shows reasonable agreement between the z′- and Y-band photometry, with perhaps a median colour of 0.1–0.2 mag (which might be due to the average galaxy colour being red, although potentially the zero-point might also be uncertain at the ∼10 per cent level). The F125W J-band zero-point is 26.10, and for the F160W H band it is 25.81.2 We have checked the WFC3 H-band photometry against the NICMOS image of the same field (Thompson et al. 2005) taken with a very similar F160W filter, and we see good agreement. The NICMOS wide J filter (F110W) has a significantly different transmission curve to the WFC3 F125W J band, so to check the new J-band photometry we used instead the European Southern Observatory VLT ISAAC images of GOODS-South (Vanzella et al. in preparation).
In our final combined Y-band image, we measure a full width at half-maximum (FWHM) of 0.15 arcsec for point sources in the field. As most high-redshift galaxies are likely to be barely resolved (e.g. Bunker et al. 2004; Ferguson et al. 2004) we perform photometry using fixed apertures of 0.6 arcsec diameter, and introduce an aperture correction to account for the flux falling outside of the aperture. This correction was determined to be 0.2 mag in the Y band and 0.25 mag in J and H bands from photometry with larger apertures on bright but unsaturated point sources. We note that the H-band images display significant airy diffraction rings around point sources. For the ACS images, the better resolution and finer pixel sampling require a smaller aperture correction of ≈0.1 mag. All the magnitudes reported in this paper have been corrected to approximate total magnitudes (valid for compact sources), and we have also corrected for the small amount of foreground Galactic extinction towards the CDF-S using the COBE/DIRBE and IRAS/ISSA dust maps of Schlegel, Finkbeiner & Davis (1998). The optical reddening is E(B−V) = 0.009, equivalent to extinctions of AF850LP= 0.012, AF105W= 0.010, A125W= 0.008 and A160W= 0.005.
The geometric transformation and image re-gridding produce an output where the noise is highly correlated. Hence measuring the standard deviation in blank areas of the final registered image will underestimate the noise, so to determine the accurate noise properties we consider an individual frame of 1400 s (after flat-fielding, background-subtraction and conversion to electrons per second) where we measure a standard deviation of ≈0.02e s−1 in each of the combined Y, J and H images. For the final combined image, a point source of total magnitude YAB= 28.0 should be detected at 10σ in our 0.6-arcsec diameter aperture (with the aperture correction applied). We confirmed this was the case by measuring the noise in a combined version of the data using integer pixel shifts (to avoid smoothing the data through interpolation). The faintest sources in our catalogue (YAB= 28.5) should be detected at 6σ. The J- and H-band limits are nearly the same (JAB= 28.0 and HAB= 27.9 at 10σ; and JAB= 28.5 and HAB= 28.4 at 6σ for point sources measured in a 0.6-arcsec-diameter aperture and with an aperture correction to total magnitude applied). At YAB= 28.5, a non-detection in the HST z′ band (which has a 2σ sensitivity of z′AB= 30.0) would imply a lower limit on the colour of (z′−Y)AB > 1.5 (2σ). We assess the recoverability and completeness as a function of magnitude by adding in fake sources to our images, and determine the fraction recovered by SExtractor with 3 pixels (0.18 arcsec) of the input source, and with a flux within 0.5 mag. We did this by scaling down a bright but unsaturated point source and adding this at different locations on the image – most of the high-redshift LBGs show extremely compact morphologies well approximated by point sources. About 5 per cent of the 4.18 arcmin2 region considered was contaminated by foreground galaxies or stars and z′-drop candidates in these noisier regions were discounted, and our survey volume was corrected for this effect. After removing confused regions, the recoverability at our 6σ limit (AB≈ 28.5 mag) was 92 per cent, rising to 98 per cent at our 10σ limit (AB≈ 28.0 mag). Hence the completeness corrections are negligible given our sample size and flux limit.
2.2 Construction of catalogues
Candidate selection for all objects in the field was performed using version 2.5.0 of the SExtractor photometry package (Bertin & Arnouts 1996). For the z′-drops, as we are searching specifically for objects which are only securely detected in the WFC3 Y band, with minimal flux in the ACS images, fixed circular apertures 0.6 arcsec in diameter were ‘trained’ in the Y image and the identified apertures used to measure the flux at the same spatial location in the z′-band image by running SExtractor in dual-image mode. For each waveband we used a weight image derived from the exposure map. This procedure was repeated for all other ACS and WFC3 filters. For object identification, we adopted a limit of at least 5 contiguous pixels above a threshold of 2σ per pixel (on the data drizzled to a scale of 0.06 arcsec pixel−1). (This cut enabled us to detect all significant sources and a number of spurious detections close to the noise limit, or due to diffraction spikes of stars or edge effects. Our catalogue contains 5000 sources in all, 4000 in the region where more than half the frames overlap; many sources are non-unique, split into multiple components due to software deblending). As high-redshift galaxies in the rest-UV are known to be compact (e.g. Ferguson et al. 2004; Bremer et al. 2004; Bunker et al. 2004), we corrected the aperture magnitudes to approximate total magnitudes with the aperture correction appropriate for that filter.
2.3 z≈ 7 candidate selection
In order to select z≈ 7 galaxies, we use the Lyman-break technique pioneered at z∼ 3 using ground-based telescopes by Steidel and co-workers and using HST by Madau et al. (1996). At z∼ 3–4 the technique involves the use of three filters: one below the Lyman limit (λrest= 912 Å), one in the Lyman forest region and a third longward of the Lyman α line (λrest= 1216 Å). We have shown that by z≈ 6, we can efficiently use only two filters (i′ and z′ band for the z∼ 6 work), since the integrated optical depth of the Lyman α forest is ≫1 rendering the shortest-wavelength filter below the Lyman limit redundant (e.g. Bunker et al. 2004). The key issue is to work at a sufficiently high signal-to-noise ratio that drop-outs can be safely identified through detection in a single redder band. Here, we extend this work to longer wavelength, and higher redshift by using the Y-band filter on WFC3 to image above the Lyman α break, and the ACS images to find the drop-out objects. In particular, the sharp sides of Y-band filter (and the SDSS-type filters on ACS), coupled with the proximity in wavelength of the Y and z′ bands, assist in the clean selection of objects with a sharp spectral discontinuity using this photometric redshift technique. In Fig. 2, we illustrate how a colour cut of (z′−Y)AB > 1.3 can be effective in selecting sources with z > 6.6. The main caveat is that at (z′−Y)AB < 2.0 we may be affected by contaminants, principally evolved galaxies at z≈ 2.5 (where we pick up the Balmer/4000 Å break), and low-mass cool stars in our own galaxy. These L and T dwarfs have colours of 0.8 < (z′−Y)AB < 1.8, but we may guard against these interlopers in our survey by considering the (Y−J) colours which are typically much redder than z≈ 7 galaxies with similar (z′−Y)AB colours (Fig. 3). We emphasize the importance in having additional ultra-deep optical imaging from ACS (b, v and i′) in the HUDF; any object detected at these shorter wavelengths is strongly excluded from being a high-redshift source.
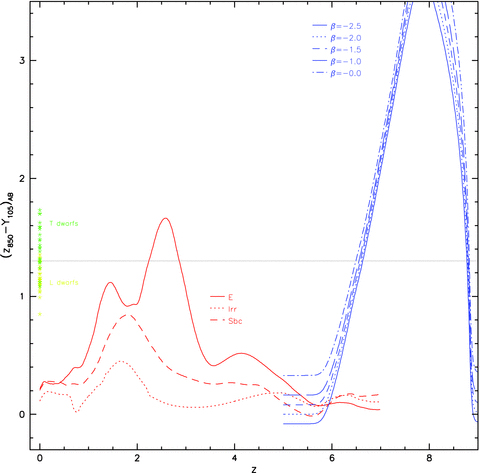
The redshift evolution of the (z′−Y) colour of starbursting galaxies, the extrapolated colours of low-redshift galaxies and low-mass L- and T-dwarf stars. The solid, dotted, dashed and dot–dashed blue lines show the redshift evolution of the colours of starburst galaxies with UV continuum spectral slopes β∈{−2.5, −2.0, −1.5, −1.0, 0.0} (i.e. fλ=λβ, ranging from no dust reddening to A1600 Å= 4.4 according to the empirical relation of Meurer et al. 1999). The solid, dotted and dashed red lines show the colour of non-evolving low-redshift galaxies (Coleman, Wu & Weedman 1980) as a function of redshift, as three examples of foreground objects in our fields (of which elliptical galaxies at z≈ 2.5 would be a contaminant in the z′-drop selection). More discussion of contamination by Balmer/4000 Å break galaxies is given in Wilkins et al. (2010). The yellow and green stars denote the positions of L- and T-dwarf stars, respectively (Golimowski et al. 2004; Knapp et al. 2004; Chiu et al. 2006).
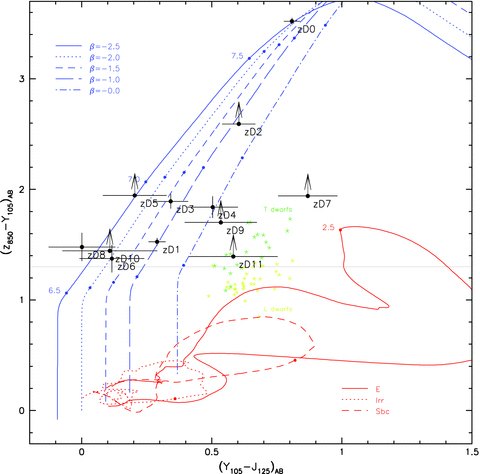
(z′−Y) versus (Y−J) colour–colour diagram illustrating the differentiation of high-redshift star-forming galaxies, low-mass stars and lower redshift galaxies. The black circles show the colours of z-dropouts in our selection and their 1σ errors (or lower limits). The solid, dotted, dashed and dot–dashed blue lines show the evolution of the colours of starburst galaxies with UV continuum spectral slopes β∈{−2.5, −2.0, −1.5, −1.0, 0.0} (i.e. fλ=λβ with redshift). The solid, dotted and dashed red lines show the colours of low-redshift galaxies (Coleman et al. 1980) as a function of redshift, as three examples of foreground objects in our fields (of which elliptical galaxies at z≈ 2.5 would be a contaminant in the z′-drop selection). More discussion of contamination by Balmer/4000 Å break galaxies is given in Wilkins et al. (2010). The yellow and green stars denote the positions of L- and T-dwarf stars, respectively (Golimowski et al. 2004; Knapp et al. 2004; Chiu et al. 2006). Note that the J-band photometry of zD3 is suspect, as it falls close to the edge of the frame.
Our goal is to select objects with colours redder than (z′−Y)AB > 1.3[and preferably redder than (z′−Y)AB= 1.5, consistent with an LBG at z≥ 7.0]. However, in order to ensure we did not exclude galaxies with colours marginally below this (but consistent with the colour cut within the magnitude uncertainties), we initially drew up a selection with a more liberal colour cut of (z′−Y)AB > 1.0. Imposing our selection criteria of (z′−Y)AB > 1.0 and YAB < 28.5 on the catalogue resulted in 110 objects, 24 of which were clearly spurious (mainly diffraction spikes from stars). A further 40 had intermediate colours of 1.0 < (z′−Y)AB < 1.3, and only two of these were within 1σ of (z′−Y)AB= 1.5– so this sub-sample is probably of low redshift. We note that five objects in our intermediate colour sample, 1.0 < (z′−Y)AB < 1.3, are undetected in the b, v, i′ ACS images (with bAB < 30.3, vAB < 30.7 and i′AB < 30.6 at 2σ) and may well be i′-drop galaxies at the high-redshift end of this selection z∼ 6.3–6.5, where the break occurs in the z′ band (leading to red i′−z′ and z′−Y colours); indeed, two of these sources appear in the Yan & Windhorst (2004) catalogue of faint i′-drops in the UDF (their source numbers 75 and 85, which also appear in the catalogue of Bouwens et al. 2006). The other three sources with intermediate (z′−Y) colours and non-detections in the b, v, i′ have coordinates 03:32:41.83−27:46:11.3, 03:32:37.44−27:46:51.3 and 03:32:39.58−27:46:56.5, and magnitudes YAB= 28.32 ± 0.09, 27.75 ± 0.06 and 27.87 ± 0.06. We exclude these intermediate-colour objects from our z > 6.5 selection. The remaining 46 objects with (z′−Y)AB > 1.3 were then analysed further. We demanded that these sources be undetected in the ACS optical images, as the v band falls below the Lyman limit at the redshifts of interest. 20 galaxies were detected at >2σ in v and i′ bands (with vAB < 30.7 and i′AB < 30.6) and were eliminated as low-redshift sources. A further three were detected in i′ but not in v and are probably not z≈ 7 galaxies. Of the remaining 23 objects, detailed examination eliminated 11 as probably spurious (due to fainter diffraction spikes, noisy areas of the image or extended outer regions of clearly low-redshift galaxies which had been identified by SExtractor as drop-outs due to the different PSFs between WFC3 and ACS). This left our core sample of 12 z′-drops (Fig. 4 and Table 1). We consider whether any of these 12 might still be low-redshift objects in Section 3.1.
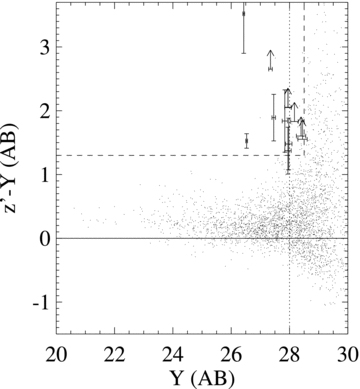
The (z′−Y)AB colours of all objects in our catalogue (dots), as a function of Y-band magnitude. The vertical dotted line indicates a 10σ detection (YAB= 28.0). Our primary z′-drop selection region where (z′−Y)AB > 1.3 and YAB < 28.5 is marked by the dashed lines – candidates lie in the upper left, and those z′-drops which are undetected at short wavelengths (absent from the ACS v band) are marked as crosses, or arrows denoting 2σ lower limits on their colours if they are undetected in z′ band.
z-band drop-out candidates meeting our selection criteria with Y < 28.5 AB mag.
| ID | RA & Dec. J2000 | YAB | z′AB | JAB | HAB | (z′−Y)AB | (Y−J)AB | SFRfUV |
| zD0a | 03:32:34.53 −27:47:36.0 | 26.43 ± 0.03 | 29.95 ± 0.62 | 25.62 ± 0.01 | 25.77 ± 0.02 | 3.52 ± 0.62 | 0.81 ± 0.03 | [8.82] |
| zD1b | 03:32:42.56 −27:46:56.6 | 26.53 ± 0.03 | 28.05 ± 0.11 | 26.23 ± 0.02 | 26.26 ± 0.02 | 1.53 ± 0.11 | 0.29 ± 0.04 | 8.05 |
| zD2b | 03:32:38.81 −27:47:07.2 | 27.35 ± 0.06 | >30.0 (2σ) | 26.74 ± 0.03 | 26.66 ± 0.03 | >2.65 (2σ) | 0.60 ± 0.07 | 3.79 |
| zD3b | 03:32:42.57 −27:47:31.5 | 27.46 ± 0.06 | 29.35 ± 0.36 | 27.12e | 27.19 ± 0.05 | 1.89 ± 0.36 | 0.34 ± 0.07 | 3.42 |
| zD4 | 03:32:39.55 −27:47:17.5 | 27.84 ± 0.09 | 29.68 ± 0.48 | 27.34 ± 0.05 | 27.15 ± 0.05 | 1.84 ± 0.49 | 0.50 ± 0.10 | 2.41 |
| zD5 | 03:32:43.14 −27:46:28.5 | 27.95 ± 0.11 | >30.0 (2σ) | 27.74 ± 0.07 | 27.65 ± 0.08 | >2.05 (2σ) | 0.20 ± 0.13 | 2.19 |
| zD6 | 03:32:36.38 −27:47:16.2 | 27.95 ± 0.11 | 29.32 ± 0.35 | 27.83 ± 0.08 | 28.11 ± 0.12 | 1.37 ± 0.37 | 0.12 ± 0.14 | 2.18 |
| zD7 | 03:32:44.70 −27:46:44.3 | 27.95 ± 0.11 | >30.0 (2σ) | 27.08 ± 0.04 | 27.32 ± 0.06 | >2.05 (2σ) | 0.87 ± 0.12 | 2.18 |
| zD8 | 03:32:40.57 −27:46:43.6 | 27.98 ± 0.11 | 29.45 ± 0.39 | 27.97 ± 0.09 | 28.33 ± 0.15 | 1.48 ± 0.41 | 0.01 ± 0.14 | 2.13 |
| zD9c | 03:32:37.21 −27:48:06.2 | 28.17 ± 0.13 | >30.0 (2σ) | 27.63 ± 0.07 | 27.70 ± 0.08 | >1.83 (2σ) | 0.53 ± 0.15 | 1.78 |
| zD10 | 03:32:39.73 −27:46:21.3 | 28.40 ± 0.16 | >30.0 (2σ) | 28.29 ± 0.12 | 28.53 ± 0.18 | >1.6 (2σ) | 0.11 ± 0.20 | 1.44 |
| zD11d | 03:32:38.36 −27:46:11.9 | 28.45 ± 0.16 | >30.0 (2σ) | 27.86 ± 0.08 | 28.33 ± 0.15 | >1.55 (2σ) | 0.58 ± 0.18 | [1.38] |
a Likely a SN. bIdentified as z-band drop-outs in previous studies. cPossibly a star based on their Y105−J125 colour. dLikely to be a star based on their Y105−J125 colour. eThe J-band photometry of this source (zD3) is compromised as it falls on the edge of the frame. fThe SFR is in units of M⊙ yr−1 based on a relation between the rest-UV continuum density of L1500 Å= 8 × 1027 erg s−1 SFR−1, where we assume that the objects are at the predicted average redshift of the z′-drops ( ). Where the SFR is in brackets, these objects are unlikely to be at z≈ 7, but the equivalent SFR for their Y-band magnitudes is listed but not used in our calculation of the SFR density.
z-band drop-out candidates meeting our selection criteria with Y < 28.5 AB mag.
| ID | RA & Dec. J2000 | YAB | z′AB | JAB | HAB | (z′−Y)AB | (Y−J)AB | SFRfUV |
| zD0a | 03:32:34.53 −27:47:36.0 | 26.43 ± 0.03 | 29.95 ± 0.62 | 25.62 ± 0.01 | 25.77 ± 0.02 | 3.52 ± 0.62 | 0.81 ± 0.03 | [8.82] |
| zD1b | 03:32:42.56 −27:46:56.6 | 26.53 ± 0.03 | 28.05 ± 0.11 | 26.23 ± 0.02 | 26.26 ± 0.02 | 1.53 ± 0.11 | 0.29 ± 0.04 | 8.05 |
| zD2b | 03:32:38.81 −27:47:07.2 | 27.35 ± 0.06 | >30.0 (2σ) | 26.74 ± 0.03 | 26.66 ± 0.03 | >2.65 (2σ) | 0.60 ± 0.07 | 3.79 |
| zD3b | 03:32:42.57 −27:47:31.5 | 27.46 ± 0.06 | 29.35 ± 0.36 | 27.12e | 27.19 ± 0.05 | 1.89 ± 0.36 | 0.34 ± 0.07 | 3.42 |
| zD4 | 03:32:39.55 −27:47:17.5 | 27.84 ± 0.09 | 29.68 ± 0.48 | 27.34 ± 0.05 | 27.15 ± 0.05 | 1.84 ± 0.49 | 0.50 ± 0.10 | 2.41 |
| zD5 | 03:32:43.14 −27:46:28.5 | 27.95 ± 0.11 | >30.0 (2σ) | 27.74 ± 0.07 | 27.65 ± 0.08 | >2.05 (2σ) | 0.20 ± 0.13 | 2.19 |
| zD6 | 03:32:36.38 −27:47:16.2 | 27.95 ± 0.11 | 29.32 ± 0.35 | 27.83 ± 0.08 | 28.11 ± 0.12 | 1.37 ± 0.37 | 0.12 ± 0.14 | 2.18 |
| zD7 | 03:32:44.70 −27:46:44.3 | 27.95 ± 0.11 | >30.0 (2σ) | 27.08 ± 0.04 | 27.32 ± 0.06 | >2.05 (2σ) | 0.87 ± 0.12 | 2.18 |
| zD8 | 03:32:40.57 −27:46:43.6 | 27.98 ± 0.11 | 29.45 ± 0.39 | 27.97 ± 0.09 | 28.33 ± 0.15 | 1.48 ± 0.41 | 0.01 ± 0.14 | 2.13 |
| zD9c | 03:32:37.21 −27:48:06.2 | 28.17 ± 0.13 | >30.0 (2σ) | 27.63 ± 0.07 | 27.70 ± 0.08 | >1.83 (2σ) | 0.53 ± 0.15 | 1.78 |
| zD10 | 03:32:39.73 −27:46:21.3 | 28.40 ± 0.16 | >30.0 (2σ) | 28.29 ± 0.12 | 28.53 ± 0.18 | >1.6 (2σ) | 0.11 ± 0.20 | 1.44 |
| zD11d | 03:32:38.36 −27:46:11.9 | 28.45 ± 0.16 | >30.0 (2σ) | 27.86 ± 0.08 | 28.33 ± 0.15 | >1.55 (2σ) | 0.58 ± 0.18 | [1.38] |
| ID | RA & Dec. J2000 | YAB | z′AB | JAB | HAB | (z′−Y)AB | (Y−J)AB | SFRfUV |
| zD0a | 03:32:34.53 −27:47:36.0 | 26.43 ± 0.03 | 29.95 ± 0.62 | 25.62 ± 0.01 | 25.77 ± 0.02 | 3.52 ± 0.62 | 0.81 ± 0.03 | [8.82] |
| zD1b | 03:32:42.56 −27:46:56.6 | 26.53 ± 0.03 | 28.05 ± 0.11 | 26.23 ± 0.02 | 26.26 ± 0.02 | 1.53 ± 0.11 | 0.29 ± 0.04 | 8.05 |
| zD2b | 03:32:38.81 −27:47:07.2 | 27.35 ± 0.06 | >30.0 (2σ) | 26.74 ± 0.03 | 26.66 ± 0.03 | >2.65 (2σ) | 0.60 ± 0.07 | 3.79 |
| zD3b | 03:32:42.57 −27:47:31.5 | 27.46 ± 0.06 | 29.35 ± 0.36 | 27.12e | 27.19 ± 0.05 | 1.89 ± 0.36 | 0.34 ± 0.07 | 3.42 |
| zD4 | 03:32:39.55 −27:47:17.5 | 27.84 ± 0.09 | 29.68 ± 0.48 | 27.34 ± 0.05 | 27.15 ± 0.05 | 1.84 ± 0.49 | 0.50 ± 0.10 | 2.41 |
| zD5 | 03:32:43.14 −27:46:28.5 | 27.95 ± 0.11 | >30.0 (2σ) | 27.74 ± 0.07 | 27.65 ± 0.08 | >2.05 (2σ) | 0.20 ± 0.13 | 2.19 |
| zD6 | 03:32:36.38 −27:47:16.2 | 27.95 ± 0.11 | 29.32 ± 0.35 | 27.83 ± 0.08 | 28.11 ± 0.12 | 1.37 ± 0.37 | 0.12 ± 0.14 | 2.18 |
| zD7 | 03:32:44.70 −27:46:44.3 | 27.95 ± 0.11 | >30.0 (2σ) | 27.08 ± 0.04 | 27.32 ± 0.06 | >2.05 (2σ) | 0.87 ± 0.12 | 2.18 |
| zD8 | 03:32:40.57 −27:46:43.6 | 27.98 ± 0.11 | 29.45 ± 0.39 | 27.97 ± 0.09 | 28.33 ± 0.15 | 1.48 ± 0.41 | 0.01 ± 0.14 | 2.13 |
| zD9c | 03:32:37.21 −27:48:06.2 | 28.17 ± 0.13 | >30.0 (2σ) | 27.63 ± 0.07 | 27.70 ± 0.08 | >1.83 (2σ) | 0.53 ± 0.15 | 1.78 |
| zD10 | 03:32:39.73 −27:46:21.3 | 28.40 ± 0.16 | >30.0 (2σ) | 28.29 ± 0.12 | 28.53 ± 0.18 | >1.6 (2σ) | 0.11 ± 0.20 | 1.44 |
| zD11d | 03:32:38.36 −27:46:11.9 | 28.45 ± 0.16 | >30.0 (2σ) | 27.86 ± 0.08 | 28.33 ± 0.15 | >1.55 (2σ) | 0.58 ± 0.18 | [1.38] |
a Likely a SN. bIdentified as z-band drop-outs in previous studies. cPossibly a star based on their Y105−J125 colour. dLikely to be a star based on their Y105−J125 colour. eThe J-band photometry of this source (zD3) is compromised as it falls on the edge of the frame. fThe SFR is in units of M⊙ yr−1 based on a relation between the rest-UV continuum density of L1500 Å= 8 × 1027 erg s−1 SFR−1, where we assume that the objects are at the predicted average redshift of the z′-drops (). Where the SFR is in brackets, these objects are unlikely to be at z≈ 7, but the equivalent SFR for their Y-band magnitudes is listed but not used in our calculation of the SFR density.
3 ANALYSIS
3.1 Discussion of candidate z≈ 7 galaxies
We have 12 candidates meeting our selection criteria of (z′−Y)AB > 1.3 and YAB < 28.5, after removing clearly spurious sources and those detected at shorter wavelengths in the ACS bands. We now consider whether any of these 12 z′-drops are plausibly L- or T-dwarf Galactic stars. Since the resolution of WFC3 is less good than ACS, and these objects are typically undetected by ACS, morphological cuts (i.e. eliminating apparently unresolved point sources) are not appropriate as they would also remove compact galaxies. Hence we use the z′YJ colours to differentiate potential stars from the high-redshift galaxy tracks in colour:colour space (Fig. 3). Of our 12 candidates, object zD11 has colours consistent with being a T dwarf, although we stress that it is undetected in the z′ band and the (z′−Y)AB > 1.5 limit means it could still lie at high redshift. However, to be conservative, we regard this object as a probable contaminant. We note that, as our faintest z′-drop, if we were instead to retain it in our analysis it would have negligible impact (raising the integrated counts to YAB= 28.5 by 10 per cent, and increasing the integrated SFR density by 5 per cent). All the other candidates have photometry distinct from that expected from low-mass stars, with the possible exception of zD9 which lies >2σ away in colour space from the most extreme stellar colours. Both zD9 and zD11 are compact, but sufficiently faint in the near-infrared that star–galaxy separation is inaccurate; zD9 appears to have a slight east–west elongation, which would rule out the stellar interpretation.
Three of our candidates appear in previous studies (zD1, zD2 and zD3); each of these were identified previously as z′-band drop outs in Bouwens et al. (2004) (UDF-640-1417, UDF-983-964, UDF-387-1125), based on the shallower NICMOS imaging in F110W (J-wide) and F160W (H), along with the same UDF ACS z′ band as used here. The NICMOS photometry from Bouwens et al. (2004) is broadly consistent with our WFC3 measurements in Y F105W, J F125W and H, although we note the filter bandpass shape of NICMOS F110W J-wide is very different from the WFC3 filters. Source zD2 is also presented in Oesch et al. (2009), and source zD1 is red object no. 3 in Yan & Windhorst (2004). We have also inspected the old NICMOS images of the UDF (Thompson et al. 2005), and note that the majority of our candidates, except those brighter sources previously identified by Bouwens et al. (2004, 2008), are undetected in the NICMOS image (which does not go as deep as the new WFC3 image). However, our brightest z′-drop candidate (zD0) should have easily been detected, but it is not present in either the NICMOS J or H images (which reach JAB= 26.7 and HAB= 26.2 at 5σ), despite falling within the field of view and having JAB(F125W) = 25.6. This compact source is well-detected in all of the Y-, J- and H-band WFC3 images, so is clearly a real object rather than an artefact. It appears possible that this may be a transient object, perhaps a supernova. We note that the Yan & Windhorst (2004)i′-band drop-out objects 56a and b are the closest well-detected z′-band objects (1.2 arcsec away), but it is unclear if there is a physical connection between these z≈ 6 sources and the transient observed with WFC3.
3.2 UV luminosity function at z≈ 7
We use the observed surface density of our z′-drops in the UDF (using a catalogue cleaned of spurious sources, and correcting the area surveyed for that masked by foreground objects; ≈5 per cent) to compare with previous estimates of the rest-UV luminosity function at high redshift. Our final z∼ 7 candidate list comprised 10 objects, with the likely star (zD11) and probable transient (zD0) removed.3 We used the Schechter luminosity function with different values of faint-end slope (α), characteristic number density (ϕ*) and luminosity (L*) to predict the observed number of sources as a function of magnitude (Fig. 5), which would obey our (z′−Y) colour cut. We assume a simple model spectrum for these high-redshift star-forming galaxies, with a 99 per cent flux decrement below Lyman α (i.e. DA= 0.99) due to the Lyman α forest during the Gunn–Peterson era. We adopt a power law at longer wavelengths, with fλ∝λβ. Measurements of the spectral slopes of i′-drops at z∼ 6 indicate rather blue colours compared to lower redshift LBGs (Stanway, McMahon & Bunker 2005), with β∼−2 →−2.2 (i.e. approximately flat in fν) and indeed the z′-drops at z∼ 7 also seem to exhibit very blue spectral slopes (Fig. 6). Such blue colours might indicate little or no dust extinction for a constant SFR, according to the empirical relation a1600 Å= 4.43 + 1.99β (Meurer, Heckman & Calzetti 1999), but could also be produced through a top-heavy IMF or low metallicity. For a given limiting magnitude, our code considers redshift slices over which LBGs would satisfy the colour cut, and computes the equivalent limiting luminosity (in terms of L*) and comoving volume probed. These are then integrated over all redshifts to produce predicted number counts for comparison with our observations.
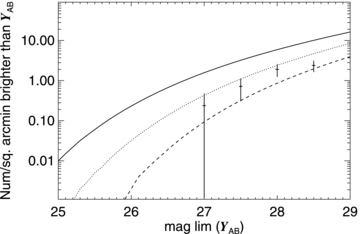
The observed cumulative surface density of (z′−Y)AB > 1.3 objects as a function of limiting magnitude in Y band. Overplotted are three rest-UV luminosity functions for high-redshift LBG populations – the solid curve is for the U-band drop-outs at z∼ 3 (Steidel et al. 1996, 1999), and the dotted curve is for the i′-drops at z∼ 6 (Bouwens et al. 2006). The dashed curve represents a prediction at z= 7 in a scenario where M* fades linearly with (1+z) (Bouwens et al. 2009).
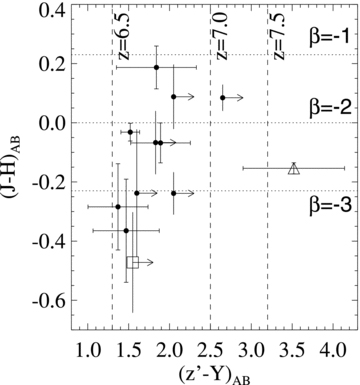
The near-infrared colours of the z′-drops in the Hubble UDF. Many have very blue (J−H) colours. The dotted horizontal lines show the (J−H) colours produced by spectral slopes of β=−1, −2, −3, and the dashed vertical lines show the redshifts which would produce the (z′−Y) colours, assuming no emission line contamination from Lyman α and a spectral slope of β=−2.0. The triangle is the probably transient source (zD0) and the square is the likely T-dwarf star (zD11).
We consider three luminosity functions. The well-studied U-band drop-out LBGs at z∼ 3 have a rest-frame UV luminosity function with M*1500 Å=−21.1 (equivalent to SFR*z=3= 15 M⊙ yr−1), ϕ*z=3= 0.001 38 Mpc−3 and a faint-end slope of α=−1.6 (Steidel et al. 1996, 1999). Our z′-drops exhibit spectral slopes close to β=−2.0 (i.e. flat in fν) meaning that the k-correction to our observed rest-frame wavelength of ≈1350 Å is negligible. We model the predicted number counts in the instance of no evolution in the properties of the star-forming population from z∼ 7 to ∼3. We also consider the luminosity function derived from a survey of 506 i′-drops at z∼ 6 by Bouwens et al. (2006), who conclude that the faint-end slope is steeper (α=−1.73), with strong evolution in the luminosity (M*z=6=−20.25; a factor of 2 fainter than M*z=3) and little evolution in the characteristic number density (ϕ*z=6= 0.002 02 Mpc−3). Finally, we consider the effects of the suggested trend of fainter M* at higher redshifts, adopting the parametrization of M*UV=−21.0 + 0.36 (z− 3.8) suggested by Bouwens et al. (2009) on the basis of the paucity of z′-drops in HST imaging with NICMOS (more shallow than the WFC3 data analysed here), for a predicted value of M*z=7=−19.8 (with ϕ*z=7= 0.0011 Mpc−3 and α=−1.73).
In Fig. 5, we compare the number counts of galaxies with colours (z′−Y)AB > 1.3 to the predictions based on the model luminosity functions at z= 3, 6, 7. As can be seen, our observed cumulative surface density is 1.9 ± 0.7 arcmin−2 brighter than YAB= 28.0 (our 10 σ limit). This is well below that predicted assuming the z= 3 UV luminosity function describes galaxies at z≈ 7 (it would predict 6.9 arcmin−2).4 However, our observed surface density is comparable to the luminosity function estimates assuming the z= 6 and 7 models (3.7 arcmin−2 and 1.0 arcmin−2, respectively). Pushing to fainter magnitudes (where our completeness decreases), our surface density of z′-drops with YAB < 28.5 is 2.4 ± 0.7 arcmin−2, which is significantly below both the z= 3 and 6 predictions of 11.5 and 7.3 arcmin−2, and consistent with the z= 7 model prediction of 2.2 arcmin−2. The volume we probe is relatively small (∼104 Mpc3 comoving), and given the observed source counts, we estimate a cosmic variance of 35 per cent assuming a pencil beam survey geometry with area 4.18 arcmin2 and a mean redshift of 7.0 with Δz= 1.0 (Trenti & Stiavelli 2008). This uncertainty due to Cosmic Variance is comparable to the shot noise on the small number of galaxies in our sample ( ).
).
Hence, we strongly rule out the simple scenario of no evolution over the range z= 7–3 as the observed counts are three to five times too low, as we also established at z∼ 6 with the i′-drops (Stanway et al. 2003; Bunker et al. 2004). At the bright end, this interpretation agrees with the low surface density of z′-band drop-outs found in the HAWK-I imaging of GOODS-South presented in Hickey et al. (2010) of ≈0.01–0.02 arcmin−2 at YAB < 26.0. We also find evidence that the z∼ 6 luminosity function of Bouwens et al. (2006) overpredicts the number of z′-drops at z= 7 by a factor of 2–3, suggesting evolution in the star-forming population from z= 7 to 6.
3.3 The SFR density at z≈ 7 and implications for reionization
We can use the observed Y-band magnitudes of objects in the z′-drop sample to estimate their SFR from the rest-frame UV luminosity density. In the absence of dust obscuration, the relation between the flux density in the rest-UV around ≈1500 Å and the SFR (in M⊙ yr−1) is given by LUV= 8 × 1027 SFR erg s−1 Hz−1 from Madau, Pozzetti & Dickinson (1998) for a Salpeter (1955) stellar initial mass function (IMF) with 0.1 < M* < 125 M⊙. This is comparable to the relation derived from the models of Leitherer & Heckman (1995) and Kennicutt (1998). However, if a Scalo (1986) IMF is used, the inferred SFRs will be a factor of ≈2.5 higher for a similar mass range. In the absence of a spectroscopic redshift, we assume that these lie at the predicted average redshift for galaxies obeying our colour cuts and with YAB < 28.5. For the luminosity functions considered, the predicted mean redshift is around  for a spectral slope β≈−2.0. At the limit of our catalogue (YAB= 28.5), the inferred SFR for a galaxy at z= 7.1 is 1.3 M⊙ yr−1, equivalent to 0.1 L* for M*UV=−21.1 (as at z= 3) or 0.2 L* for M*UV=−20.24 (for the z= 6 luminosity function of Bouwens et al. 2007). The total SFR in our 10 candidate z≈ 7 galaxies is 29.6 M⊙ yr−1 assuming they are at the predicted mean redshift. The colour selection of (z′−Y) is effective over the redshift range 6.7 < z < 8.8 (Fig. 2), and so the 4.2 arcmin2 surveyed in the deepest region of the WFC3 Y-image should colour-select z′-drop galaxies within a comoving volume of 177 00 Mpc3. So we calculate the SFR density from the z′-drops in our sample to be 0.0017 M⊙ yr−1 Mpc−3. However, this should be regarded as a conservative lower limit on the SFR density, because the redshift range is not surveyed with uniform sensitivity to UV luminosity (and hence SFR). We have a strong luminosity bias towards the lower end of the redshift range, due to the effects of increasing luminosity distance with redshift and also the Lyman α break obscuring an increasing fraction of the filter bandwidth. Using an ‘effective volume' approach (e.g. Steidel et al. 1999) accounts for this luminosity bias, and increases the inferred total SFR density to 0.0034 M⊙ yr−1 Mpc−3, integrating down to 0.2 L*UV of the L* value at z= 3 (i.e. MUV=−19.35) and assuming a UV spectral slope of β=−2.0. If instead we integrate down to 0.1 L*z=3 (0.2 L*z=6) then the total SFR density is 0.004 M⊙ yr−1 Mpc−3. These SFR densities are a factor of ∼10 lower than at z∼ 3–4, and even a factor of 1.5–3 below that at z≈ 6 (Bunker et al. 2004; Bouwens et al. 2006).
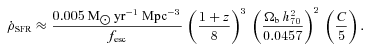
C is the clumping factor of neutral hydrogen, C=〈ρ2H i〉〈ρH i〉−2. Early simulations suggested C≈ 30 (Gnedin & Ostriker 1997), but more recent work including the effects of reheating implies a lower concentration factor of C≈ 5 (Pawlik, Schaye & van Scherpenzeel 2009). The escape fraction of ionizing photons (fesc) for high-redshift galaxies is highly uncertain (e.g. Steidel, Pettini & Adelberger 2001; Shapley et al. 2006), but even if we take fesc= 1 (no absorption by H i) and a very low clumping factor, this estimate of the star formation density required is a factor of 1.5–2 higher than our measured star formation density at z≈ 7 from z′-drop galaxies in the UDF. For faint-end slopes of α− 1.8 →−1.6 galaxies with L > 0.2 L* account for 24–44 per cent of the total luminosity (if there is no low-luminosity cut-off for the Schechter function), so even with a steep faint-end slope at z≈ 7 we still fall short of the required density of Lyman continuum photons required to reionize the Universe, unless the escape fraction is implausibly high (fesc > 0.5) and/or the faint-end slope is α < −1.9 (much steeper than observed at z= 0–6). However, the assumption of a solar metallicity Salpeter IMF may be flawed: the colours of z∼ 6 i′-band drop-outs are very blue (Stanway et al. 2005), with β < −2, and the new WFC3 J- and H-band images show that the z≈ 7 z′-drops also have blue colours on average (Fig. 6). A slope of β < −2 is bluer than for continuous star formation with a Salpeter IMF, even if there is no dust reddening. Such blue slopes could be explained through low metallicity, or a top-heavy IMF, which can produce between three and 10 times as many ionizing photons for the same 1500 Å UV luminosity (Schaerer 2003– see also Stiavelli, Fall & Panagia 2004). Alternatively, we may be seeing galaxies at the onset of star formation, or with a rising SFR (Verma et al. 2007), which would also lead us to underestimate the true SFR from the rest-UV luminosity. We explore the implications of the blue UV spectral slopes in z≥ 6 galaxies in a forthcoming MNRAS paper (Wilkins et al., in preparation).
3.4 Star-forming galaxies at z≈ 8 and beyond
The availability of deep longer-wavelength WFC3 images in addition to the Y band enables us to push the Lyman-break technique to higher redshifts still, searching for z≈ 8 objects where the Lyman α decrement falls below the J band (‘Y-drops’), and z≈ 10 sources where the break falls between the J- and H-filters (‘J-drops’). Again using SExtractor, but training in the J-images as our detection band, we uncover seven objects with (Y−J)AB > 1.0, JAB < 28.5 and no ACS detection (Fig. 7 and Table 2). These Y-drops are potential z≈ 8 star-forming galaxies, and a discussion of the selection and properties of these z≈ 8 candidates and the possible contamination fraction will appear in a forthcoming paper (Lorenzoni et al. in preparation).5 Using H as our detection band, we find no robust (J−HAB) > 1.0 objects down to HAB < 28.5 which are undetected by ACS. The absence of robust J-drops hints at further evolution of the UV luminosity function at z≫ 7.

Postage stamp images of the Y-drops in the Hubble UDF. The ACS v, i′ and z′ images are shown alongside the WFC3 Y, J and H bands for each object satisfying (Y−J)AB > 1.0, JAB < 28.5 and with no detection in the ACS images. Each image is 3 arcsec across, with north up and east to the left.
Coordinates and magnitudes of the Y-band drop-out candidates meeting our selection criteria with (Y−J)AB > 1.0, J < 28.5 AB mag and no detection at >2σ in the ACS images. We also present the measured half-light radius (for an unresolved source, rhl= 0.08 arcsec).
| ID | RA and Dec. J2000 | JAB | YAB | HAB | (Y−J)AB | (J−H)AB | rhl arcsec−1 |
| YD1 | 03:32:42.88 −27:46:34.5 | 27.70 ± 0.08 | 28.89 ± 0.24 | 27.98 ± 0.10 | 1.19 ± 0.25 | −0.28 ± 0.13 | 0.38 |
| YD2 | 03:32:37.80 −27:46:00.1 | 27.88 ± 0.10 | 30.12 ± 0.73 | 28.07 ± 0.11 | 2.24 ± 0.73 | −0.19 ± 0.14 | 0.14 |
| YD3 | 03:32:38.14 −27:45:54.0 | 28.07 ± 0.11 | 29.77 ± 0.53 | 28.07 ± 0.11 | 1.70 ± 0.54 | 0.00 ± 0.15 | 0.16 |
| YD4 | 03:32:33.13 −27:46:54.4 | 28.11 ± 0.11 | 29.74 ± 0.66 | 28.9 ± 0.23 | 1.63 ± 0.67 | −0.79 ± 0.26 | 0.11 |
| YD5 | 03:32:35.85 −27:47:17.1 | 28.38 ± 0.14 | 29.44 ± 0.39 | 27.98 ± 0.10 | 1.06 ± 0.42 | 0.41 ± 0.17 | 0.10 |
| YD6 | 03:32:40.40 −27:47:18.8 | 28.40 ± 0.16 | 29.99 ± 0.67 | 28.07 ± 0.19 | 1.59 ± 0.69 | −0.31 ± 0.25 | 0.11 |
| YD7 | 03:32:37.63 −27:46:01.5 | 28.44 ± 0.16 | 29.57 ± 0.43 | 28.61 ± 017 | 1.13 ± 0.46 | −0.17 ± 0.24 | 0.10 |
4 CONCLUSIONS
We have searched for star-forming galaxies at z≈ 7 by applying the Lyman-break technique to newly released 1.1 μm Y-band images from WFC3 on the HST. By comparing these images of the Hubble UDF with the ACS z′-band (0.85 μm) images, we select objects with red colours, (z′−Y)AB > 1.3, consistent with the Lyman α forest absorption at z≈ 6.7–8.8. We identify 12 of these z′-drops down to a limiting magnitude YAB < 28.5 (equivalent to a SFR of 1.3 M⊙ yr−1 at z= 7.1), all of which are undetected in the other ACS filters, consistent with the Lyman limit break at z≈ 7. We also analyse the new 1.25 μm J-band and 1.6 μm H-band WFC3 images to measure the near-infrared colours of our z′-drops, and eliminate low-mass Galactic stars which typically have redder colours than z≈ 7 galaxies. One of our z′-drops is a probably T-dwarf star. Our brightest z′-drop is not present in the NICMOS J-band image of the same field taken 5 years before, despite being well above the flux limit of this less sensitive image. This is a possible transient object, and we exclude this and the probable Galactic star.
From the 10 remaining z≈ 7 candidates we determine a lower limit on the SFR density of 0.0017 M⊙ yr−1 Mpc−3 for a Salpeter IMF, which rises to 0.0025–0.0034 M⊙ yr−1 Mpc−3 after correction for luminosity bias. The SFR density is a factor of ≈10 less than that of LBGs at z= 3–4, and is about half the value at z≈ 6. This SFR density would produce insufficient Lyman continuum photons to reionize the Universe unless the escape fraction of these photons is extremely high (fesc > 0.5) and the clumping factor of the Universe is low. Even then, we need to invoke a large contribution from galaxies below our detection limit (i.e. a steep faint-end slope). The apparent shortfall in ionizing photons might be alleviated if stellar populations at high redshift are of low metallicity or have a top-heavy IMF.
We have also inspected the YJH images for the presence of LBGs at higher redshifts. We identify seven objects with (Y−J)AB > 1.0 down to JAB < 28.5; these Y-drops are candidate z≈ 8 star-forming galaxies. A similar selection based on the H-band did not find any J-drops with (J−H)AB > 1.0 and HAB < 28.5– all such objects were detected in the ACS images (below the Lyman limit at z∼ 10), and ruling out a high-redshift interpretation.
One galaxy with a spectroscopic redshift of z= 6.96 was first identified through narrow-band imaging for Lyman α (Iye et al. 2006), but has subsequently also been identified in a survey for LBGs (Ouchi et al. 2009).
At the time of writing (2009 December), these were still the current zero-points in use by the Multimission Archive at STScI (MAST) pipeline reduction at the Space Telescope Science Institute, using the latest calibration files. A web page associated with the WFC 3 instrument (http://www.stsci.edu/hst/wfc3/phot_zp_lbn) presents slightly different AB zero-points of 26.27, 26.25 and 25.96 for F105W, F125W and F160W, which differ by 0.1–0.15 mag from the current calibration files used in the pipeline. Adopting these does not greatly affect the selection of LBGs, and alters individual SFRs by ≈10 per cent, comparable to the magnitude uncertainty and less than the uncertainty on the conversion of UV flux to SFR.
Note added at refereeing stage: An independent study of the HUDF-WFC 3 images was posted to the preprint server as we were submitting this paper (Oesch et al. 2010), which uses slightly bluer colour cuts and goes to lower signal-to-noise ratio. All 10 of the z′-drops presented here also appear in the Oesch et al. sample, along with another four which are too blue for our selection [at 0.8 < (z′−Y)AB < 1.0, and presumably lie at slightly lower redshift than our sub-sample] and another two which are fainter than our YAB < 28.5 cut.
Recently, Reddy & Steidel (2009) have re-fit a steeper luminosity function to the z≈ 3 Lyman-break population, with α=−1.73, ϕ*= 0.001 71 Mpc−3 and M*=−20.97. We have recomputed the expected surface density of objects obeying our colour cuts for this luminosity function at z≈ 7, and the change is small: the 17 per cent more at YAB < 28 and 25 per cent higher at YAB < 28.5.
An independent analysis of Y-drops in the WFC 3-HUDF appeared on the preprint server as this paper was being submitted (Bouwens et al. 2010); our sample contains all but one of the Y-drops presented in Bouwens et al., with UDFy-43086276 being fainter than our JAB < 28.5 cut.
We thank the anonymous referee for a careful reading of this manuscript and many helpful suggestions. We are indebted to Elizabeth Stanway for her very significant input in developing several of the tools used in this analysis. We thank Richard McMahon, Jim Dunlop, Ross McLure, Masami Ouchi, Bahram Mobasher and Michele Cirasuolo for many useful discussions about LBGs at high redshift. This work is based on observations made with the NASA/ESA HST, obtained from the Data Archive at the Space Telescope Science Institute, which is operated by the Association of Universities for Research in Astronomy, Inc., under NASA contract NAS 5-26555. These observations are associated with programme no. GO-11563, GO/DD-9978 and GO-9803. SW and DS acknowledge funding from the UK Science and Technology Facilities Council. SH acknowledges a University of Hertfordshire studentship, and MJJ acknowledges a Research Councils UK Fellowship. SL is supported by the Marie Curie Initial Training Network ELIXIR of the European Commission under contract PITN-GA-2008-214227.
REFERENCES
