


Abstract
In a recent paper, we presented the first semi-analytic model of galaxy formation in which the thermally pulsing asymptotic giant branch (TP-AGB) phase of stellar evolution has been fully implemented. Here, we address the comparison with observations, and show how the TP-AGB recipe affects the performance of the model in reproducing the colours and near-infrared luminosities of high-redshift galaxies. We find that the semi-analytic model with the TP-AGB better matches the colour–magnitude and colour–colour relations at z∼ 2, both for nearly passive and for star-forming galaxies. The model with TP-AGB produces star-forming galaxies with red V−K colours, thus revising the unique interpretation of high-redshift red objects as ‘red and dead’. We also show that without the TP-AGB the semi-analytic model fails at reproducing the observed colours, a situation that cannot be corrected by dust reddening. We also explore the effect of nebular emission on the predicted colour–magnitude relation of star-forming galaxies, to conclude that it does not play a significant role in reddening their colours, at least in the range of star-formation rates covered by the model. Finally, the rest-frame K-band luminosity function at z∼ 2.5 is more luminous by almost 1 mag. This indicates that the active galactic nuclei feedback recipe that is adopted to regulate the high-mass end of the luminosity function should be sophisticated to take the effect of the stellar populations into account at high redshifts.
1 INTRODUCTION
Hierarchical clustering is the favoured scenario to describe the formation and evolution of matter structures in the Universe (White & Rees 1978), and semi-analytic models of galaxy formation proved themselves to be a powerful tool of investigation since the first formulation (White & Frenk 1991). Over the years, many such models have been developed (see for instance Kauffmann, White & Guiderdoni 1993; Cole et al. 2000; Balland, Devriendt & Silk 2003; Hatton et al. 2003; De Lucia, Kauffmann & White 2004; Baugh et al. 2005; Bower et al. 2006; Menci et al. 2006; Monaco, Fontanot & Taffoni 2007; Cattaneo et al. 2008; Somerville et al. 2008). The successes and failures of these models are strictly linked to those of the hierarchical scenario itself, ultimately depending on the mechanisms of mass accretion of objects as a function of time. The large-scale structure and the integrated properties of the galaxy population (such as the total stellar mass density for instance) are well reproduced. The detailed evolution of galaxies however presents several puzzling aspects, such as e.g. the size of the discs of spirals (Burkert 2009) or the α-enhancement and the ages of the stellar populations in massive ellipticals (Thomas 1999; Thomas, Greggio & Bender 1999; Cimatti et al. 2004; Nagashima et al. 2005; Thomas et al. 2005; Kormendy et al. 2009; Pipino et al. 2009). Moreover, global properties of the galaxy population such as the evolution of the stellar mass function (Cole et al. 2001; Bell et al. 2003; Bundy et al. 2006; Colless et al. 2007; Bundy et al. 2009; Pozzetti et al. 2009) are still not reproduced in the models (Kodama & Bower 2003; Bundy, Treu & Ellis 2007; Kajisawa et al. 2009; Marchesini et al. 2009), although there is controversy on this point (Drory et al. 2004; Benson et al. 2007). It is debated if any of these problems can possibly be resolved with enhanced resolution in the simulations and more sophisticated recipes in the models.
One of the most problematic issues for the models is to reproduce the abundance of high-redshift luminous galaxies (e.g. Cimatti et al. 2004; van Dokkum et al. 2004, Dokkum 2006; Conselice et al. 2007). This difficulty is partly due to a misinterpretation of the nature of these objects.
The high-luminosity end of the galaxy population up to redshift z∼ 2.5 consists in fact of objects that look like the early-type galaxies in the local Universe, i.e. they are characterized by very red colours in the optical and near-infrared (NIR), and high NIR luminosities (Cimatti et al. 2004; McCarthy et al. 2004; Daddi et al. 2005; Saracco et al. 2005; Kriek et al. 2006; Mancini et al. 2009). Local ellipticals showing the same photometry are old (with stellar populations older than ∼1 Gyr), passively evolving, and with stellar masses Mstar > 1011 M⊙. Moreover, newer observations are building the case for the presence of extremely red and IR-luminous objects at even higher redshifts (Rodighiero et al. 2007; Fontana et al. 2009; Mancini et al. 2009).
The problem posed by the presence of these high-redshift (z > 2) red and luminous galaxies stems from the consensus that they are massive objects evolving passively, the so-called ‘red and dead’ galaxies. With the stellar population models currently used in the semi-analytic models in the literature (for the most part Bruzual & Charlot 2003, hereafter BC03), the only way to explain the high NIR luminosities of high-redshift galaxies is to advocate very high galaxy masses and very old ages of the stellar populations. But these are not achieved in the actual model realizations (except at low redshifts) because the hierarchical mass assembly has an intrinsic difficulty in putting together massive and old objects at early epochs. In fact, the hierarchical scenario predicts a steady decline of the abundance of massive galaxies with increasing redshift (van Dokkum et al. 2004).
In Tonini et al. (2009), we showed that the predictions of colours and luminosities of galaxies at high redshift in a semi-analytic model are greatly affected by the recipes in use for the stellar populations, especially the inclusion of the thermally pulsing asymptotic giant branch (TP-AGB). As shown in Maraston (2005, hereafter M05), in stellar populations of intermediate age (≤0.2–2 Gyr) the TP-AGB phase dominates the NIR luminosity, with a contribution up to 80 per cent in the rest-frame K band, and contributes to up to 40 per cent of the bolometric luminosity (M05). High-redshift galaxies, in which the mean age of the stellar populations is in that range, are expected to be dominated by the TP-AGB emission in the NIR. This has been recently confirmed by Spectral Energy Distribution (SED)-fitting of observations made with the Spitzer Space Telescope (Maraston et al. 2006; Cimatti et al. 2008). In Tonini et al. (2009), we included a complete treatment of the TP-AGB phase in the semi-analytic model GalICS (Hatton et al. 2003), by implementing the M05 stellar population models into the code, and showed that the rest-frame V−K colours at high redshift get redder by more than 1 mag. Relatedly, the K-band mass-to-light ratio is shifted towards luminosities 1 mag higher for a given galaxy mass. Notably, actively evolving, star-forming high-redshift galaxies are predicted to have V−K colours and NIR luminosities similar to those of local, passively evolving massive systems (Tonini et al. 2009).
Once the stellar emission is correctly modelled with an exhaustive treatment of all the significant phases of stellar evolution, a more accurate comparison between the semi-analytic model predictions and the data is possible. In particular, the performance of the semi-analytic model in reproducing the observed colours and luminosities in the NIR becomes meaningful to test the hierarchical mass assembly at different redshifts.
In the literature the comparison between galaxy formation models and data is typically done by obtaining physical properties for the real objects through application of stellar population models to data. However, this approach carries several degeneracies, including the adopted population synthesis model, the recipe for star formation history, the choice of metallicity, etc. When a realistic errorbar including all these variables is attached to the observationally derived quantity, such as in Marchesini et al. (2009) (and see also Conroy, White & Gunn 2010 for a discussion), the results of such comparisons may not be clear-cut.
In this paper, we adopt a different philosophy for the comparison between model and data. Instead of using processed data in the rest-frame system, we consider raw, unprocessed, apparent magnitudes straight out of the catalogues. We then produce mock catalogues out of the simulation, so that the output spectra of the model galaxies are redshifted in the observer's frame. The model apparent magnitudes and colours can then be directly compared with the observational data. This comparison yields direct information about the physical quantities in the model in use.
This procedure is straightforward and does not add substantial degeneracy that can jeopardize the comparison. A degeneracy that clearly remains is how dust reddening affects the intrinsic stellar emission, as recently pointed out by Guo & White (2009) and Conroy et al. (2010). However, we will show that considering the intrinsic star formation rates in the model and using data mapping the rest-frame NIR, such an uncertainty plays actually a minor role.
The structure of the paper is as follows. In Section 2, we briefly introduce the new semi-analytic model GalICS with the TP-AGB implementation through the M05 models (as from Tonini et al. 2009). In Section 3, we describe the data samples used for our analysis. In Section 4, we compare the colour–magnitude and colour–colour relations predicted by the model against samples of z∼ 2 galaxies. In Section 4, we compare the model rest-frame K-band luminosity function in the M05 and Projet d'Étude des Galaxies par Synthèse Évolutive (PEGASE) cases with the predictions by other semi-analytic models. In Section 5, we discuss our results.
2 THE SEMI-ANALYTIC MODEL OF GALAXY FORMATION
We produce the model galaxies through the hybrid semi-analytic model GalICS (Hatton et al. 2003), and we defer the reader to its original paper for details on the dark matter N-body simulation and the implementation of the baryonic physics. In brief, the model builds up the galaxies hierarchically, and evolves the metallicity consistently with the cooling and star formation history (with the new implementation by Pipino et al. 2009). Feedback recipes for supernovae-driven winds and active galactic nuclei (AGN) activity are implemented in the code (the latest with the improved version of Cattaneo et al. 2006). Merger-driven morphology evolution and satellite stripping and disruption are taken into account.
The semi-analytic model was originally supplied with two different sets of input stellar population models, namely the PEGASE (Fioc & Rocca-Volmerange 1997) and the Stardust (Hatton et al. 2003; Cattaneo et al. 2008). The Stardust model is too rudimentary for the scope of this work, so we discarded it. In Tonini et al. (2009), for the first time, the M05 models were implemented into GalICS, and the predictions of the models were compared with those obtained with PEGASE. The same sets of single stellar population (SSP) models are utilized in the present paper. For the purpose of this work, the most significative difference between PEGASE and M05 is that the M05 includes higher energetics for the TP-AGB phase. The PEGASE models in this respect produce results comparable to the more commonly used BC03 models (see M05), with a TP-AGB recipe with much lower energetics than the M05 (see M05, fig. 18). For both sets of SSPs, the adopted initial mass function is Salpeter, and the metallicity range is 0.001 < Z < 0.04 (where Z⊙= 0.02).
In the current implementation, dust extinction is taken into account. The model spectra are reddened according to the ongoing star formation. We adopt a Calzetti extinction curve and a colour-excess E(B−V) proportional to the star formation rate for each single galaxy, parametrized as E(B−V) = 0.33 ×[Log(SFR) − 2]+ 1/3. This choice is supported by data analysis in the literature, in general for samples of star-forming galaxies at redshifts around z∼ 2 (Daddi et al. 2007; Maraston et al., in preparation), and in particular it agrees with the SED fitting of the galaxies in the data samples used in this paper, which are introduced in the next section. We do not randomize the inclination of disc galaxies (which reduces the dust effect in face-on objects), but we redden the spectrum by the total amount of extinction calculated for each galaxy, therefore considering the maximal reddening for each object. As it will be clear in the next Sections, this choice proves to be instructive in the comparison between GalICS runs with M05 and PEGASE input SSPs. This reddening recipe is more sophisticated than simple screen-models used so far, and follows the spirit of important developments in the field (see for example Ferrara et al. 1999; Guo & White 2009). The results presented here have been tested against different extinction curves [Large Magellanic Cloud (LMC), Milky Way and Small Magellanic Cloud (SMC) types], with the conclusion that the main factor affecting the dust contribution is E(B−V).
The comparison with data performed in this work requires the distinction between actively star-forming galaxies and nearly passive galaxies (passively evolving or with small residual star formation). For this purpose, we split our model galaxies according to their instantaneous star formation rate, with the criterium that objects with SFR ≤ 3 M⊙ yr−1 are considered nearly passive, and galaxies with SFR > 10 M⊙ yr−1 are actively star-forming. This value was chosen according to the star-forming objects selected in Daddi et al. (2007) and in Maraston et al. (in preparation), where SFR > 10 M⊙ yr−1 are robustly determined from far-IR and the ultraviolet-slope method.
We build mock catalogues from the simulation, by redshifting the rest-frame spectra at each time-step, to produce observer frame luminosities and colours, to compare directly with the data. We set the model magnitudes to mimic the data catalogues in use, by filtering the spectra with the same broadband filters used in the observations. The broadband magnitudes thus obtained are further scattered with Gaussian errors comparable to the observational errors of our data samples (on average σ= 0.1 mag at z∼ 2).
3 DATA SELECTION
We want to compare the predicted colours and NIR luminosity of our semi-analytic model against data of high-redshift galaxies, to test whether our improved stellar populations implementation allows to better match the properties of the red galaxy population. Given the nature and origin of the TP-AGB light, we focus our analysis on data sets for which the IR photometry is available. In fact, the optical to NIR rest-frame emission will get redshifted into the IRAC bands for redshifts z≥ 2. We explicitly looked for samples of excellent photometry quality, in order to minimize any source of uncertainty.
The first sample is from Maraston et al. (2006). It consists of seven galaxies selected in the optical by Daddi et al. (2005), with photometry extended to cover the rest-frame NIR. These galaxies were selected from the Hubble Ultra Deep Field through the BzK technique introduced by Daddi et al. (2004), and have spectroscopic redshifts between 1.4 ≤z≤ 2.7 (see Maraston et al. 2006 for details). They show early-type morphology, and SED fitting (Maraston et al. 2006) indicates an average age between 0.2 < τ < 2 Gyr and masses ∼1011 M⊙, a modest dust attenuation and a negligible amount of OB stars, so that these objects qualify as nearly passive. In Daddi et al. (2005), they were interpreted as progenitors of present-time massive ellipticals. The second sample is taken from the Great Observatories Origins Deep Survey-South (GOODS-S) catalogue from Daddi et al. (2007), and consists of 95 galaxies with high-quality photometry and spectroscopic redshifts between 1.7 ≤z≤ 2.3. The BzK method identifies them as star-forming, which has been confirmed by SED fitting (Maraston et al., in preparation).
4 COLOUR–MAGNITUDE AND COLOUR–COLOUR RELATIONS AT z ∼ 2
In this section, we compare the observed broadband magnitudes and colours of the data samples with the predictions of the model. We translate the model results in the observer frame at each redshift, so that all magnitudes presented here are apparent. The magnitudes are calculated in the AB system.
4.1 Nearly passive galaxies
Interesting candidates for studying the effects of the TP-AGB in the semi-analytic model are galaxies dominated by intermediate-age stellar populations. In such objects, most of the stellar component is active in the TP-AGB phase, thus maximizing its effect, while star formation is subdominant, which reduces the complication of dust. In Fig. 1, we compare the model observed-frame colour–magnitude relation Irac3 versus H−Irac3, corresponding to rest-frame K versus V−K, for the nearly passive galaxies, with data of the 7 galaxies at redshifts z= 1.5, 2 and 2.5 singled out by Maraston et al. (2006). The model galaxies are plotted as red filled dots for the TP-AGB run (M05) and yellow empty dots for the PEGASE run, while the data are represented by black triangles with errorbars.
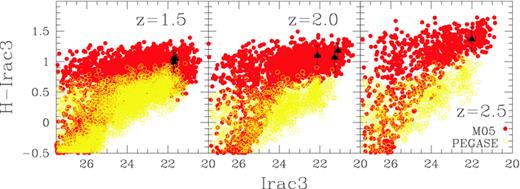
The observed-frame colour–magnitude relation Irac3 versus H−Irac3 corresponding to rest-frame K versus V−K at redshifts z= 1.5, 2 and 2.5 (from left- to right-hand panel), for nearly passive galaxies in the M05 runs (red filled dots) and the PEGASE runs (yellow empty dots), compared with data of nearly passively evolving galaxies from Maraston et al. (2006) (black triangles with errorbars). The dust reddening adopted in the models is a LMC-type law with colour-excess E(B−V) = 0.2 at z= 1.5, and a Calzetti law with E(B−V) ∝ SFR at z= 2, 2.5.
The comparison between model and observations show that the M05 run with the TP-AGB perfectly matches the data, in the whole redshift range. With PEGASE on the other hand, the model galaxies feature much bluer colours, with an offset of about 0.5 mag on average between the two runs. In the central panel (z= 2), it is also evident that the PEGASE run fails to reproduce the Irac3 (rest-frame K) luminosity of these objects, while the M05 run produces luminosities up to 1 mag higher and easily accommodates the observed ones.
These galaxies show early-type morphology and lack any significant emission from young stars. However, as expected at these high redshifts, their star formation is not strictly zero,1 hence the label ‘nearly passive’. Therefore, although dust reddening in these objects is modest in general, it is not negligible. The degree of residual star formation in our sample is variable, and in particular the galaxies at z= 1.5 show a little bit more activity. In fact, they are SED-fitted with a colour-excess due to dust reddening even slightly higher than predicted by our dust model, so for the plot at z= 1.5 we adopted a dust-screen LMC-type law with E(B−V) = 0.2 (from Maraston et al. 2006). Even with a higher reddening however, the PEGASE run is not able to match these data.
The observed galaxies lie among the most luminous galaxies in the model, as expected. The slight luminosity overshooting of the simulated galaxies probably stems from the fact that the simulated volume is much bigger than the survey (at z= 2 the ratio of the areas is a factor of ∼107). Moreover, the observed galaxies were selected in observed-frame K band, which maps the ∼R at z= 2, while we are plotting the Irac3 luminosity (rest-frame NIR). The stellar masses at z∼ 2 are estimated to be between 1010 and 1011 M⊙, and are in the range of masses produced by the semi-analytic model at the same redshift. This match insures a fair comparison between the model stellar luminosities and the data, by nailing down the mass-to-light ratios and thus leaving no room for degeneracies in this sense (see Conroy et al. 2010). We note that these galaxies lie close to the top-mass end of the model distribution; for instance, at z= 2.5 the observed galaxy lies among the 7 per cent most massive galaxies in the simulation (this amounts to ∼500 objects in the simulated volume). This shows that the semi-analytic model is performing well in terms of galaxy masses at these redshifts, but that there is no margin for reaching the observed colours without the TP-AGB. We conclude that the TP-AGB appears to be a necessary ingredient of the model in order to reproduce the colours and NIR luminosity of these nearly passive galaxies.
4.2 Star-forming galaxies
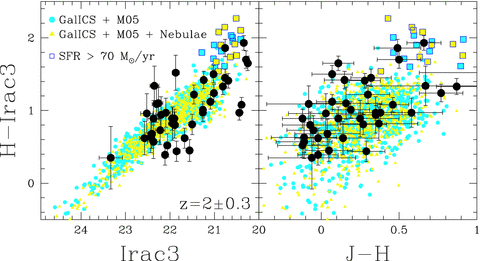
Fig. 2 shows the same plot as Fig. 1 for the model star-forming galaxies, compared with the sample of star-forming galaxies from GOODS, selected in the range 1.7 ≤z≤ 2.3. The M05 run portrayed in the left-hand panel, where cyan dots represent the prediction of the semi-analytic model with dust reddening, and the blue dots represent the case without reddening. The right-hand panel shows the PEGASE run, with magenta dots for the case with dust reddening, and green dots for the case without reddening.
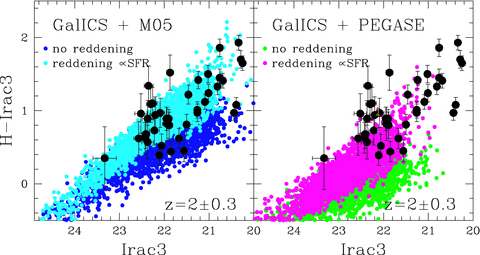
The theoretical colour–magnitude relation Irac3 versus H−Irac3 at z= 2, corresponding to the rest-frame K versus V−K, for the star-forming galaxies in the M05 run (left-hand panel) and the PEGASE run (right-hand panel), compared with data. The black dots with errorbars are data points from the GOODS-S catalogue (Daddi et al. 2007). In both panels, the results are shown for runs with reddening (a Calzetti-type extinction with colour-excess proportional to the SFR; cyan and magenta dots) and without reddening (blue and green dots).
As expected, the galaxies in the M05 run are much redder than in the PEGASE run (Tonini et al. 2009). They are in excellent agreement with the data. The M05 run reproduces both the observed amplitude of the H−Irac3 colour and the slope of the colour–magnitude relation, indicating that the star-formation rate (SFR) across the observed mass range is well represented in the model. In fact, the model SFRs easily cover the range of the ones derived from this sample of observed galaxies.
The PEGASE run on the other hand is completely off the data, producing much bluer colours. Moreover, while the Irac3 luminosity range is correctly reproduced by the M05, in the PEGASE run the model galaxies are much fainter, and the run misses half of the sample in luminosity. This happens because the TP-AGB increases the emission in Irac3 (rest-frame K) by 1 mag on average. About ∼53.5 per cent of the galaxies in the GOODS sample have magnitudes Irac3 ≤ 22, and these objects can be reproduced only with the M05 run, while the run with the PEGASE recipe is far off the mark. On the other hand, only about the most luminous ∼10 per cent of objects is not reproduced by the M05.
It is also clear that a higher dust reddening cannot be advocated to make up for the absence of the TP-AGB emission and match the observations. First of all, dust reddening tilts the colour–magnitude relation upwards at the high-mass end, but does not increase the Irac3 (rest-frame K) luminosity. Secondly, the magnitude of its effect on the H−Irac3 colour is well below the shift introduced by the TP-AGB. Our reddening recipe is physically associated with the intrinsic SFR of the model galaxies (a choice sustained by observations), which at z∼ 2 spans a range of values up to a few 102 M⊙ yr−1, corresponding to E(B−V) ∼ 0.3–0.4 (e.g. Daddi et al. 2007), and yielding values of E(B−V) ∼ 0.1–0.2 for typical SFR produced by GalICS. Either due to the limited mass resolution of the N-body simulation and/or the recipes currently employed in GalICS, the hybrid model is not able to produce very massive starbursts, so that the maximum model SFR might be on the low side. The investigation of this issue is beyond the scope of this paper, and we will pursue it further in future work.
Fig. 3 shows the colour–colour relation J−H versus H−Irac3 at z= 2 (corresponding to rest-frame B−V versus V−K), and compares again the M05 run (left-hand panel) and the PEGASE run (right-hand panel) with the same set of data. In the panels, red/yellow dots represent nearly passive galaxies (SFR < 3 M⊙ yr−1) and cyan/magenta dots represent the star-forming galaxies (SFR > 10 M⊙ yr−1).
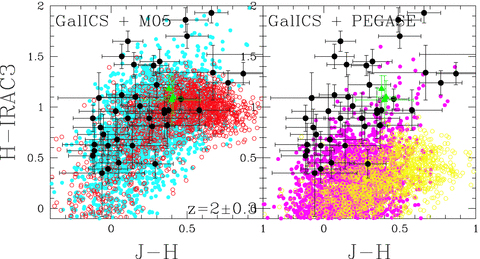
The colour–colour relation J−H versus H−Irac3 at z= 2, corresponding to the rest frame B−V versus V−K, for the M05 run (left-hand panel) and the PEGASE run (right-hand panel). The black dots with errorbars are data points from the GOODS catalogue (Daddi et al. 2007). The green triangles with errorbars are data from Maraston et al. (2006) of nearly passively evolving galaxies. For the M05 run, the red dots represent nearly passive galaxies (SFR < 3 M⊙ yr−1) and cyan dots represent the star-forming galaxies (SFR > 10 M⊙ yr−1); in the PEGASE run, the same holds for yellow/magenta dots, respectively.
The striking feature highlighted by this plot is that, with the M05 stellar populations, the semi-analytic model is now able to produce star-forming galaxies that are very blue in the optical and very red in the NIR, and reproduces the data very well. The run with the PEGASE recipe on the other hand, while covering the correct range in J−H, is clearly off the data in the NIR. Given that the optical colours are correctly reproduced, we conclude that a higher amount of reddening would be unrealistic.
This plot highlights the ability of GalICS to reproduce the mix of stellar populations of different ages in these galaxies, by matching the optical blue colours. At the same time, the GalICS + M05 run can also match the NIR colours thanks to the contribution of the TP-AGB. Finally, the dust extinction adopted in this implementation lies in a sensible range of values. Our model reproduces the properties of the observed galaxies at z∼ 2 without invoking unrealistic SFRs or dust reddening.
Note the three nearly passive galaxies of Maraston et al. (2006) in the plot (green triangles). As expected, they are near the reddest in optical colours. Most of the sample of star-forming galaxies is bluer than these objects, but the NIR colours are comparable. Correspondingly in the model, the nearly passive galaxies are among the reddest both in the NIR and optical colours, but they are not distinguishable from active galaxies on the basis of colours alone. As already pointed out in Tonini et al. (2009), star formation does not dilute the TP-AGB emission in the NIR, so that the NIR colours alone do not discriminate between star-forming and passive. In fact, star-forming galaxies can be redder than passive ones in the NIR. This proves that the so-called ‘red and dead’ galaxies may not, in fact, be dead at all. The same NIR colours can be achieved in star-forming galaxies because the TP-AGB emission is not offset by the light produced by young stars.
4.2.1 Effects of removing the TP-AGB from M05 models
Obviously, the M05 and the PEGASE models differ also for other recipes than the TP-AGB implementation. For instance, in M05 young stellar populations are modelled with the Geneva stellar evolutionary tracks, while the Padova tracks are used in PEGASE. In order to rule out that the significant difference in the predictions of colour and luminosity shown in Fig. 2 is due to any effect other than the TP-AGB, we performed a test run of GalICS with Maraston (2005) models without the TP-AGB, and with the rest of the recipe unchanged. This quantifies the actual contribution of the TP-AGB in the predictions of the M05 run. The result is shown in Fig. 4, where this new run (represented by cyan empty dots, left-hand panel) is compared with the PEGASE run (magenta dots, right-hand panel), and the same sets of data. The predicted luminosity and colour in the run with Maraston models without TP-AGB is strikingly similar to those of the PEGASE run. This shows that the TP-AGB emission is the main driver of the success of the model in correctly predicting luminosities and colours of the observed galaxies.
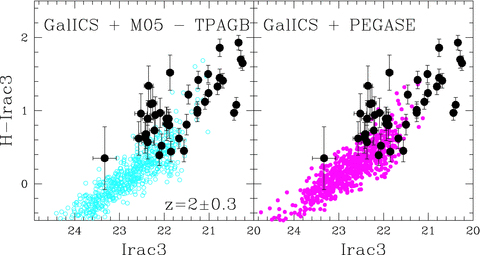
Same plot as in Fig. 2, but with the comparison between the PEGASE run (right-hand panel) and a run with Maraston models without the TP-AGB phase (left-hand panel), and the rest of the recipe unchanged. In both cases, we adopt the reddening described previously. The (black dots) represent the same set of data of Fig. 2.
4.2.2 Effects of nebular emission
It has been pointed out (Leitherer et al. 1999; Zackrisson, Bergvall & Leitet 2008; Molla', Garca-Vargas & Bressan 2009) that, among the factors that can affect the colours of star-forming galaxies, nebular emission can play a significant role. This kind of emission is produced by ionizing photons emitted from massive young stars when scattering with the gas surrounding star-forming regions, originating a series of emission lines and a continuum flux. The nebular emission is important in the presence of strong starbursts, when stellar populations of ages τ≤ 5–10 Myr contribute significantly to the total emission.
For the first time, we implemented this contribution into a semi-analytic code of galaxy formation, using the publicly available models of Molla' et al. (2009). For each age and metallicity in our grid of input M05 models, we included the nebular emission on top of the stellar emission, following the indications of Molla' et al. (2009). Note that this is not strictly physically sensible, in that the ionizing photons are not subtracted from the stellar ultraviolet spectrum, so that energy is not conserved for a given stellar population. This however has the advantage of setting the maximum limit of the possible contribution of the nebular emission to the total galaxy spectra.
The result is presented in Fig. 5. The (left-hand panel) shows the colour–magnitude relation Irac3 versus H−Irac3 and the right-hand panel) shows the colour–colour relation J−H versus H−Irac3 at z= 2 (observed frame). The M05 run is represented by cyan dots, and the M05 run with nebular emission is represented by yellow triangles. As before, the model predictions are compared with the GOODS-S catalogue. Note that the nebular emission leaves the colours and luminosities of galaxies virtually unchanged in these runs, except at the very high-luminosity red end. The highlighted squares in the plot represent galaxies with an instantaneous SFR of SFR > 70 M⊙ yr−1. For some of these objects, the nebular emission increases the H−Irac3 (rest-frame V−K) colour by about 0.2–0.4 mag, while it is not so clear for the J−H (rest-frame B−V).
The Irac3 versus H−Irac3 colour–magnitude relation (left-hand panel) and the J−H versus H−Irac3 colour–colour relation (right-hand panel) at z= 2 for the run with the M05 models (cyan dots) and for the run with M05 models + nebular emission (as in Molla' et al. 2009; yellow triangles), compared with the GOODS-S catalogue (Daddi et al. 2007). The highlighted squares represent galaxies with SFR > 70 M⊙ yr−1 in both runs. We are only plotting the model galaxies with reddening, for clarity.
The reason why the nebular emission contribution is not more impressive is that the semi-analytic model cannot produce very violent starbursts. The high-SFR tail of the galaxy population at z= 2 is around 100–200 M⊙ yr−1, but these galaxies are relatively rare in the simulation. As stated in Leitherer et al. (1999), Zackrisson et al. (2008), Molla' et al. (2009), the nebular emission is a main factor in determining the colours of starburst galaxies, where very young (τ < 5–10 Myr) stellar populations represent a significant fraction of the stellar mass. Hence, we conclude that the inclusion of nebular emission does not affect our results.
5 REST-FRAME K-BAND LUMINOSITY FUNCTIONS
In the previous sections, we presented a qualitative comparison between the spectral energy distributions of model and real galaxies, and showed that the introduction of the TP-AGB in the semi-analytic model substantially improves the model performance in reproducing the observed galaxies at z∼ 2.
A more quantitative approach is to compute the luminosity function for the model galaxy population. After the correct stellar population models are implemented in the semi-analytic model and the TP-AGB is included, the luminosity function in the NIR is a good proxy for the galaxy stellar mass function, therefore representing a meaningful test of the mass assembly in the hierarchical model. With one caveat, the role played by AGN feedback.
The AGN feedback was introduced in the galaxy formation models to turn down the efficiency of star formation at the high-mass end of the galaxy population, a fundamental recipe in order to obtain the correct shape of the luminosity function (see Benson et al. 2003; Binney 2004; Granato et al. 2004; Silk 2005; Bower et al. 2006; Croton et al. 2006). In fact, if stars were to follow the dark matter halo mass function (which is essentially scale-invariant), the models would produce a severe overabundance of massive systems. A mechanism is needed in the models to suppress star formation in more massive systems, at specific points in each galaxy history. The most popular solution adopted in the models, a mechanism that can act on a galactic scale and heat up the gas, thus preventing star formation, is the energy emission from the central black hole following gas accretion, the so-called AGN feedback. It has the advantage that it is preferentially active in massive objects and at high redshifts (z > 1–2, see for instance Madau et al. 1996; Shaver et al. 1996). However, the coupling between the AGN energy release and the gas in galaxies is still poorly understood, so that this source of feedback is implemented a posteriori to fine-tune the models, given some set of observational constraints.
The most widely used calibration data set for semi-analytic models is the luminosity function at z= 0, for various photometric bands. Different stellar population models in the semi-analytic code affect the galaxy spectral energy distribution and mass-to-light ratio (M05; Tonini et al. 2009), so before investigating the predictions at high redshift, a fundamental step is to verify that the model is still well calibrated at z= 0.
Fig. 6 shows the z= 0 K-band rest-frame luminosity function for GalICS as in the original paper (Hatton et al. 2003; green line), compared to data from Cole et al. (2001; pentagons), Jones et al. (2006; triangles), Bell et al. (2003; squares) and a combination of these three samples (thick black circles). In this magnitude range, the errorbars on each luminosity function are at most as large as the spread between the different functions. The red line is the luminosity function obtained with the M05 run, and the thick, cyan line line represents the PEGASE run. The difference between the luminosity function in the GalICS + PEGASE run and the original version of Hatton et al. (2003) is partly due to the difference between the PEGASE and Stardust models (used in the original version of the code), and the fact that the current version of GalICS includes the improved recipe for AGN feedback introduced by Cattaneo et al. (2006) and the new chemical evolution model implemented by Pipino et al. (2009). In general, the original version and our two new runs agree reasonably well with the data, and in particular the TP-AGB allows the model to perform better at the high-mass end.
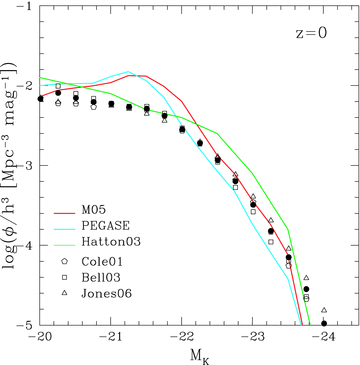
The original GalICS rest-frame K-band luminosity function at z= 0 (Hatton et al. 2003; green line) compared with data from Cole et al. (2001), Jones et al. (2006), Bell et al. (2003) and a combination of these three samples (thick black circles). The thick red line represents again the M05 run, and the thick, cyan line represents the PEGASE run.
The luminosity function in the current version of GalICS overpredicts the number of galaxies at intermediate luminosities, regardless of the stellar population models in use. This tension with the data is not critically relevant for the work presented here, in that it regards the implementation of physics beyond the SSP models, and it does not affect the comparison between the M05 and PEGASE runs.
Note that, at z= 0, the K-band luminosity function is mildly dependent on the input model SSPs. In particular, there is a small difference between the M05 run and the run with the Stardust models. This may originate from the different temperatures of the RGB phase in the two models and also from residual TP-AGB dominated populations in the simulations at low redshift. In fact, the amount of intermediate-age population at low redshift is much lower than at high look-back times; hence at z= 0 the K band mostly traces the red giant branch in galaxies. The offset between the M05 and the PEGASE runs is ∼0.2 mag and is due to galaxies that recently had – or are having – star formation. Since for the majority of the galaxies the bulk of the stellar populations are old and the TP-AGB phase is subdominant (M05).
This however does not remain true at all redshifts, as shown in the previous sections and in Tonini et al. (2009). The TP-AGB becomes the dominant contributor to the NIR luminosity at z > 1, so that the mass-to-light ratio in the K band and in the nearing bands is significantly offset between the M05 and the PEGASE runs. To illustrate this point, Fig. 7 shows the difference between the predicted K-band magnitudes in the M05 and PEGASE runs, defined as ΔMK=MK(M05) −MK(PEGASE), for the same galaxy masses, in 4 redshifts bins from z= 0 to 3. At z= 0 the M05 run produces galaxies on average brighter by 0.3 mag than the run with the PEGASE recipe, but at z > 1 the M05 run gets brighter by more than 1 mag, and the offset between the two runs shows a mild dependence on galactic mass. This difference is going to be mirrored by the luminosity function at high redshift.
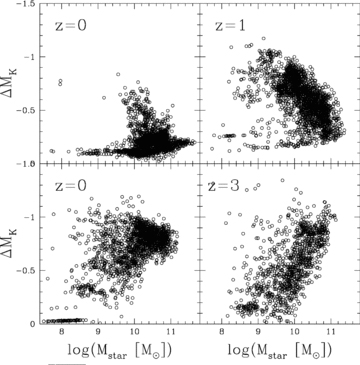
The difference between the rest-frame K-band broadband magnitudes predicted in the M05 and PEGASE runs, ΔMK=MK(M05) −MK(PEGASE), as a function of stellar mass, in four redshifts bins from z= 0 to 3.
Fig. 8 shows the z= 2.5 luminosity functions in the rest-frame K band for the M05 and PEGASE runs (thick red and thick cyan lines, respectively). As expected, there is an offset of roughly 1 mag between the functions (with the PEGASE run underpredicting the number of bright galaxies), more pronounced at the high-mass end due to the steeper slope of the function and to the mild dependence of the offset with galaxy mass. The difference between the two functions is exclusively due to different stellar population models implemented into the GalICS code. The two functions are also compared with the predictions of other semi-analytic models in the literature (see the caption for the line coding), all of which make use of either the BC03 models or the Graphite and Silicate (GRASIL) SSPs of Silva et al. (1998) (which implement the TP-AGB, but produce NIR spectra very similar to BC03; P. Monaco, private communication), but differ for the various implementations of the baryonic physics. In particular, the main factor shaping the bright end of the NIR luminosity function is the recipe for AGN feedback.
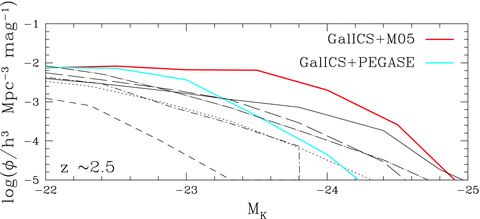
The rest-frame K-band luminosity function of the M05 (thick red line) and PEGASE (thick cyan line) runs, compared with published luminosity functions in the literature: Bower et al. 2006 (solid), Cole et al. 2000 (short-dashed), Baugh et al. 2005 (dotted), Menci et al. 2006 (long dot–dashed), Monaco et al. 2007 (short dot–dashed) and De Lucia & Blaizot (2007) (long dashed).
Two considerations are important here. The first is that, regardless of the fact that all these models are set to match the z= 0 luminosity function, their predictions at high redshift diverge dramatically. This is in part due to the different recipes for the baryonic physics adopted in each model. However, semi-analytic models cannot match the z= 0 luminosity function without AGN feedback, which in each case is implemented ad hoc to fine-tune the model at z= 0, based on energy arguments at best. The lack of physics in the AGN recipe makes it degenerate with other model parameters, especially at high redshift. In fact, AGN activity supposedly peaks around 1 < z < 3, at epochs when the stellar emission is dominated by the TP-AGB in the NIR, so that these two factors compete in shaping the high-redshift luminosity function.
The second consideration is even more striking. The shift in the luminosity function caused by the introduction of the TP-AGB emission in the model is comparable in magnitude to the difference introduced by different AGN-feedback recipes. In fact, the M05 and PEGASE runs actually bracket most of the other semi-analytic models at the high-mass end. Given that the stellar emission is much better understood and constrained, the importance of producing realistic and complete stellar population models before fine-tuning the AGN-feedback recipe is evident.
6 SUMMARY AND DISCUSSION
In a recent work (Tonini et al. 2009), we introduced the complete treatment of the TP-AGB phase of stellar evolution into a semi-analytic model of galaxy formation, by inserting the Maraston (2005) SSP models into the code GalICS. In the work presented here, we compared the predictions on the NIR luminosities and colours of high-redshift galaxies with data samples of nearly passive and star-forming galaxies around z∼ 2. Our main results are:
the TP-AGB is fundamental to allow the semi-analytic model to reproduce the observed optical and NIR colours of both nearly passive and star-forming galaxies at z∼ 2; the inclusion of the TP-AGB increases the Irac3 luminosity (rest-frame K) and shifts the H−Irac3 (rest-frame V−K) colours by more than 1 mag;
without the TP-AGB, it is not possible to match the observed galaxy colours and luminosities by a modification of the dust reddening recipe alone;
the TP-AGB emission does not alter the optical luminosity and colours of star-forming galaxies. On the other hand, star formation does not dilute the TP-AGB emission in the NIR. Even star-forming galaxies, very blue in the optical, can be very red in the NIR. Therefore, the labelling of red galaxies as ‘red and dead’ is misleading;
the nebular emission, produced by young stellar populations, does not add a significant contribution to the colours of star-forming galaxies, in the range of SFRs covered by the model; for SFR > 70 M⊙ yr−1 the rest-frame V−K colour is reddened by 0.2–0.4 mag;
the predicted mass–luminosity relation is affected by the inclusion of the TP-AGB; for a given galaxy mass, the rest-frame K-band luminosity is higher by more than 1 mag at z > 1. As a consequence, the K-band luminosity function predicted by the model with the TP-AGB shifts redwards, especially at the high-mass end, for z > 1 (by ∼0.7 mag at z∼ 2.5). The spread in the luminosity function between runs with and without the TP-AGB is comparable to the scatter caused by different AGN-feedback recipes in the literature.
Note that the high-mass end of the luminosity function in the NIR is dominated by spheroids, or the progenitors of today's spheroids. If the use of the TP-AGB in the semi-analytic model shifts the luminosity function by ∼1 mag at the high-mass end, it means that the mass-to-light ratio is lower by a factor of ∼2.5 for a given luminosity. When galaxy masses are inferred from observations by the use of these models, they are lower by the same factor (as shown in M05). This may rise the question of whether there is enough mass in spheroids at high redshift to account for the ∼50 per cent of stellar mass in ellipticals measured in the local Universe. However, the model correctly predicts the stellar mass density at all redshifts, meaning that only the distribution of galaxy masses is at tension with observations, if the TP-AGB is not taken into account. In fact, hierarchical models in general predict a faster evolution of the high-mass end of the stellar mass function than currently inferred from observations (see for instance Conselice et al. 2007). A more accurate derivation of galaxy masses through complete stellar population models with the TP-AGB, coupled with more accurate predictions from hierarchical models with the right input SSP, surely contribute to alleviate the discrepancy.
The inclusion of the TP-AGB allows the semi-analytic model to reproduce the very red end of the galaxy population at z∼ 2, both for nearly passive and for star-forming objects. It allows the model to do so with a comfortable range of galaxy masses and dust reddening. Most importantly, it contributes to a realistic and comprehensive treatment of the galaxy light emission in galaxy formation models, making them a much more precise tool to test our understanding of galaxy assembly.
The implementation of the TP-AGB allows the model to produce, at a given stellar mass, redder and more luminous galaxies in the NIR, especially at high redshift where the ages of the stellar populations peak around the epoch of maximal emission from this stellar phase. In case of nearly passively evolving galaxies, the model can reproduce the red colours and high K-band magnitudes without invoking too large stellar masses or too old ages, which would be problematic in the hierarchical context. In the case of star-forming galaxies, the TP-AGB still increases the NIR luminosity and makes the galaxies redder, without offsetting the blue optical colours. Thus, observed red colours in the NIR do not necessarily imply old ages and passive evolution, a fact that again would be problematic for the hierarchical picture at high redshift. In general, the introduction of the TP-AGB in the models is a step forward in reconciling the hierarchical assembly mechanism with the observations of the high-redshift Universe.
This actually suits the semi-analytic model, since the hierarchical nature of the simulation causes satellites to continually infall into bigger objects, triggering spurious star formation. Residual star formation is also caused by the cooling of hot halo gas on to the central objects, but while at these high redshifts this is acceptable, it becomes a problem of the model at lower redshifts (the so-called cooling catastrophe).
This project is supported by the Marie Curie Excellence Team Grant MEXT-CT-2006-042754 of the Training and Mobility of Researchers programme financed by the European Community. We wish to acknowledge Danilo Marchesini, Alvio Renzini, Emanuele Daddi and Bruno Henriquez for the interesting and useful discussions. We also want to thank Mark Dickinson and Emanuele Daddi for letting us use the GOODS-S data sample of star-forming galaxies. Finally, we wish to thank the Referee for his comments and suggestions, which helped to improve this work.
REFERENCES
