


Abstract
We present the results of a photometric survey of rotation rates in the Coma Berenices (Melotte 111) open cluster, using data obtained as part of the SuperWASP exoplanetary transit-search programme. The goal of the Coma survey was to measure precise rotation periods for main-sequence F, G and K dwarfs in this intermediate-age (∼600 Myr) cluster, and to determine the extent to which magnetic braking has caused the stellar spin periods to converge. We find a tight, almost linear relationship between rotation period and J−K colour with an rms scatter of only 2 per cent. The relation is similar to that seen among F, G and K stars in the Hyades. Such strong convergence can only be explained if angular momentum is not at present being transferred from a reservoir in the deep stellar interiors to the surface layers. We conclude that the coupling time-scale for angular momentum transport from a rapidly spinning radiative core to the outer convective zone must be substantially shorter than the cluster age, and that from the age of Coma onwards stars rotate effectively as solid bodies. The existence of a tight relationship between stellar mass and rotation period at a given age supports the use of stellar rotation period as an age indicator in F, G and K stars of Hyades age and older. We demonstrate that individual stellar ages can be determined within the Coma population with an internal precision of the order of 9 per cent (rms), using a standard magnetic braking law in which rotation period increases with the square root of stellar age. We find that a slight modification to the magnetic-braking power law, P∝t0.56, yields rotational and asteroseismological ages in good agreement for the Sun and other stars of solar age for which p-mode studies and photometric rotation periods have been published.
1 INTRODUCTION
In their pioneering study of stellar rotation among main-sequence stars in the Hyades open cluster, Radick et al. (1987) found a surprisingly narrow correlation between the B−V colours and the rotation periods of F, G and K stars. This discovery has several far-reaching implications. First, it confirms the theoretical prediction that the spin rates of an ensemble of stars of the same age and mass, but different initial rotation periods rates, should converge. This comes about because the rate at which angular momentum is lost through magnetic braking via a thermally driven, magnetically channelled wind, increases strongly as a function of stellar rotation rate (e.g. Mestel & Spruit 1987). Radick et al. showed that this convergence is essentially complete at the ∼600 Myr age of the Hyades. Secondly, for convergence to occur at such a comparatively early age, the time-scale for coupling the star's radiative interior to its outer convective zone must be short. Models that allow a star's outer convective zone to be spun down rapidly by wind losses at the 50–100 Myr ages of clusters such as the Pleiades, retaining a hidden reservoir of angular momentum in a rapidly spinning radiative interior, do not show this convergence (Li & Collier Cameron 1993; Krishnamurthi et al. 1997; Allain 1998).
For the core and envelope to be decoupled at the age of the Pleiades but to be rotating synchronously by the age of the Sun, the coupling time-scale must be no less than ∼10 Myr and no more than 1 Gyr (Soderblom, Jones & Fischer 2001). Rotational evolutionary tracks with coupling time-scales of order 100 Myr do not converge, because the ‘buried’ angular momentum re-emerges at ages of a few hundred Myr. The wide range of spin rates seen in the very youngest clusters then re-asserts itself, inducing a large scatter in the predicted rotation rates and delaying convergence well beyond the age of Coma and the Hyades.
The Hyades study by Radick et al. (1987) remained unparalleled for nearly two decades after its publication. The advent of wide-field synoptic surveys for exoplanetary transits in open clusters using 1-m class telescopes, and in nearby field stars using even smaller instruments, has led to a recent resurgence of interest in the rotation distributions of open clusters with ages of ∼150 Myr and older. Several recent photometric studies show the convergence of spin rates in nearby open clusters of intermediate age, notably M35 (150 Myr; Meibom, Mathieu & Stassun 2009), M34 (250 Myr: Irwin et al. 2006) and M37 (550 Myr: Messina et al. 2008; Hartman et al. 2009). These studies have gained new significance because the rotation-age-colour relations in these clusters provide important calibration points for stellar rotational evolution. An empirical calibration of stellar spin rates as a function of age and colour was published recently by Barnes (2007), who coined the term gyrochronology to describe the inverse process of inferring a star's age from its rotation period and colour. If magnetic braking causes stellar spin rates to converge by the age of the Hyades (or perhaps sooner) and subsequently to spin-down as some unique and measurable function of time, gyrochronology becomes very attractive as a clock for measuring the ages of individual field stars, stellar and planetary systems.
While this convergence of spin rates seems to be essentially complete among F and G stars by the age of M35 (Meibom et al. 2009), and in K stars by the age of the Hyades, it takes even longer for stars of still lower mass. Although many stars with B−V > 1.3 have converged to the main period–colour relation by the 550 Myr age of M37, Hartman et al. (2009) identified a substantial clump of stars redder than this limit having periods of 2.5 days or less. In their preliminary investigation of the still older Praesepe (650 Myr), Scholz & Eislöffel (2007) find convergence to be completed down to the late K types, but rapid rotation persisting among low-mass stars of spectral type M0 and later.
Here, we present the results of a wide-field photometric monitoring survey of stars brighter than V= 14 in the region around the Coma Berenices open cluster, using the SuperWASP camera array on La Palma. This cluster, also known as Melotte 111, is centred at RA = 12h23m, Dec. =+ 26°00 (J2000.0). It is the second closest open cluster to the Sun, lying at a distance of 89.9 ± 2.1 pc (van Leeuwen 1999), further only than the Hyades (46.3 pc: Perryman et al. 1997). The foreground reddening is E(B−V) ≃ 0.006 ± 0.013 (Nicolet 1981). Trumpler (1938) used proper-motion, radial velocity and colour–magnitude (CM) selection criteria to identify 37 probable members with photographic magnitudes mpg < 10.5 within  of the cluster centre. Fainter candidates with mpg < 15.0 were identified within the same region in a proper motion survey by Artiukhina (1955), but only two of these were confirmed by Argue & Kenworthy (1969), who identified another two faint objects that were later confirmed as members. Odenkirchen, Soubiran & Colin (1998) performed a thorough kinematic and photometric survey down to V≃ 10.5 using the Hipparcos and the combined Astrographic Catalogue and TYCHO (ACT; Urban, Corbin & Wycoff 1998) reference catalogues. This study yielded around 50 probable kinematic members in a region of 1200 deg2 about the cluster centre, effectively superseding the kinematic and photometric aspects of Trumpler's original survey. Casewell, Jameson & Dobbie (2006) compiled a list of previously known members (according to proper-motion, photometric and in some cases radial velocity criteria) within 4° of the cluster centre. They found a further 60 candidate cluster members using the United States Naval Observatory (USNO) B1.0 (Monet et al. 2003) and Two-Micron All-Sky Survey (2MASS) point-source catalogues to carry out proper motion and photometric surveys, respectively, more than doubling the number of probable Melotte 111 cluster members to about 110 according to photometric and kinematic criteria. Among these, about 40 are secure in the sense that they also satisfy radial velocity membership criteria, at least at the level of precision achieved by Trumpler (1938).
Previous photometric studies by Radick, Skiff & Lockwood (1990) of four early-G dwarfs and by Marilli, Catalano & Frasca (1997) of three late-G dwarfs in the Coma Berenices cluster suggest a Hyades-like convergence in spin rates. Like the Hyades, however, Coma Berenices is a difficult target for high-precision photometric rotation studies, because of its age and its wide angular extent. As in the Hyades, the stellar spin periods are expected to range from 6 days among late-F dwarfs to 14 days among mid-K dwarfs, with more rapid rotation persisting at later spectral types. Although stellar dynamos still produce strong magnetic activity signatures at such rotation rates, the starspot coverage is substantially lower than in the ultrafast rotators found in younger open clusters. The comparatively low starspot coverage on stars in the Hyades and Coma yields amplitudes of rotational modulation of at most 1 or 2 per cent. This combination of long periods, low amplitudes and large angular separation between cluster members presents a challenge to observers seeking precise measurements of their optical modulation periods.
In Sections 2 and 3, we describe the observations and data reduction methodology. In Section 4, we describe the generalized Lomb–Scargle period-search method we used to identify candidate rotational variable stars in the Coma Berenices region, while in Section 5 we describe the additional photometric and astrometric criteria used to assess their cluster membership probabilities. In Sections 6 and 7, we discuss the period–colour relation for Coma Berenices cluster members, and the implications for stellar spin-down and gyrochronological age determination.
2 OBSERVATIONS
The SuperWASP camera array, located at the Observatorio del Roque de los Muchachos on La Palma, Canary Islands, carried out its inaugural season of observations during 2004. The camera array is mounted on a robotic equatorial mount. In 2004, it comprised five 200-mm f/1.8 Canon lenses each with an Andor CCD array of 20482 13.5 μm pixels, giving a field of view 7.8 deg2 for each camera (Pollacco et al. 2006). Four individual camera, fields covering the region around the Coma Cluster were observed on 51 nights of good photometric quality between 2004 May 2 and 2004 July 18; further two fields at an adjacent pointing position were observed on 86 nights between 2004 May 02 and 2004 August 12.
The Coma Berenices region was re-observed throughout the first half of 2007. By this time, a further three cameras had been installed on the mount. Again, six individual camera fields provided full coverage of the region around the cluster: two on 72 nights from 2006 December 12 to 2007 May 15 and four from 2007 January 14 to May 30.
The survey region was accessible for between 4 and 8 h each night. The average interval between visits to the field was 6 min. Each exposure was of 30 s duration, and was taken without filters in 2004, and with an infrared blocking filter in 2007.
The field centres and dates of observation are summarized in Table 1.
Journal of SuperWASP observations for the Coma Berenices rotation survey.
| Field centre hhmm+ddmm | No of images | Usable nights | Start date | Baseline (nights) |
| 1143+3126 | 1200 | 51 | 2/5/04 | 78 |
| 1144+2427 | 1203 | 52 | 2/5/04 | 78 |
| 1216+3126 | 1111 | 51 | 2/5/04 | 78 |
| 1217+2326 | 1200 | 51 | 2/5/04 | 78 |
| 1243+3126 | 2378 | 86 | 2/5/04 | 103 |
| 1244+2427 | 2383 | 86 | 2/5/04 | 103 |
| 1217+2350 | 4876 | 71 | 30/12/06 | 137 |
| 1222+3000 | 4926 | 72 | 30/12/06 | 137 |
| 1238+3135 | 5815 | 78 | 14/1/07 | 137 |
| 1241+3924 | 5796 | 77 | 14/1/07 | 137 |
| 1242+2418 | 5667 | 76 | 14/1/07 | 137 |
| 1252+1735 | 5707 | 77 | 14/1/07 | 137 |
3 DATA REDUCTION AND CALIBRATION
The data were reduced using the SuperWASP data reduction pipeline, whose operation is described in detail by (Pollacco et al. 2006). Science frames are bias-subtracted and flat-fielded. An automated field recognition algorithm identifies the objects on the frame with their counterparts in the TYCHO-2 catalogue and establishes an astrometric solution with an rms precision of 0.1–0.2 pixel. The pipeline then performs aperture photometry at the positions on each CCD image of all objects in the USNO-B1.0 catalogue (Monet et al. 2003) with magnitudes in the R2 band brighter than 14.5, equivalent to V≃ 15 over the colour range 0 < B−V < 1. The pipeline computes the formal variance of the flux of each star in the image from the photon counts in the stellar aperture and the surrounding sky annulus. This magnitude limit is dictated by the detection threshold for the SuperWASP exoplanetary transit-search project; stars with R2 ≃ 14.5 yield light curves with rms scatter between 0.02 and 0.03 mag.


We extracted the light curves of all stars observed in the six fields nearest to the centre of the Coma cluster in each of the 2004 and 2007 observing seasons from the archive. We stored them in a two-dimensional array whose columns held the light curves of individual stars, and whose rows held data derived from individual CCD frames. Patterns of correlated systematic error were identified and removed using the sysrem algorithm of Tamuz, Mazeh & Zucker (2005), as implemented by Collier Cameron et al. (2006). At this stage, the photometric variances are augmented by an additional systematic variance that accounts for the actual scatter in the measured fluxes about the final decorrelated solution for each frame. The maximum-likelihood algorithm for computing this additional variance is described by Collier Cameron et al. (2006). The long-term rms scatter of the decorrelated SuperWASP light curve of a non-variable star is 0.004 mag at V= 9.5, degrading to 0.01 mag at V= 12.0 as shown in fig. 3 of Collier Cameron et al. (2006).
4 LIGHT CURVE ANALYSIS
4.1 Frequency analysis
We searched for evidence of quasi-sinusoidal light curve modulation in all stars in the field, using the generalized Lomb–Scargle periodogram formulation of Zechmeister & Kürster (2009) to fit an inverse variance-weighted floating mean sinusoid to the light curve over a full observing season.


The FAP is sensitive to the number N of independent observations. As Collier Cameron et al. (2006) found, some forms of correlated error repeat at intervals of 1 day, and are not adequately removed by the sysrem algorithm. A small misalignment of SuperWASP's polar axis causes every stellar image to drift across the frame by a few tens of pixels during each night. The vignetting pattern of the camera lenses produces discontinuities in the focal-plane illumination gradient near the edge of the frame, which change slightly from night to night and even during the course of a single night. The resulting correlated errors serve to reduce the number of independent observations from N to a lower value Neff.
In Fig. 1, we plot the best-fitting modulation amplitude against FAP for all stars in the field SW1216+3126 observed in the 2004 season. We select for further study all those light curves showing evidence of periodic modulation with FAPs less than 10−2. These stars exhibit light curve amplitudes in the range 0.01–0.1 mag, which is typical of rotational variables with periods of the order of a few days.

Amplitude of best-fitting sinusoidal model as a function of FAP for stars in the field SW1216+3126 in the 2004 season. Stars to the right of the selection threshold set at FAP = 10−2 are considered to be candidate rotational variables.
5 CANDIDATE SELECTION
Having identified a large number (Ntot= 1613) of rotational variables in the vicinity of the cluster, the next step is to determine which among them are likely to be cluster members. We followed the method of Girard et al. (1989), defining probability density functions for the proper motions of Nc cluster members and Nf=Ntot−Nc field stars.

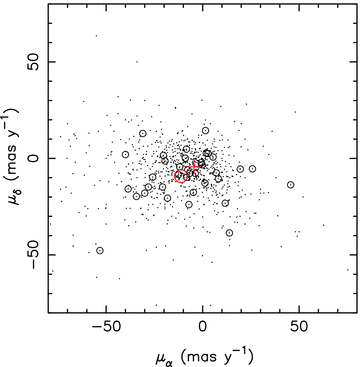
Proper-motion diagram of stars with significant (FAP < 10−2) quasi-sinusoidal variability and periods between 1.1 and 20 days, in the WASP fields surveyed in 2004 and 2007. The red cross denotes the centroid of the field distribution for stars with total proper motions less than 25 mas yr−1, while the red circle marks the mean proper motion of the cluster members. The 30 stars with combined kinematic and photometric membership probabilities greater than 0.5 (see also Table 2) are encircled.


We generalized this approach to take into account the magnitude distribution of field stars and proximity to the cluster main sequence in a CM diagram constructed from the 2MASS K magnitudes and J−K colour index (Fig. 3). To select likely cluster members using their locations in this CM diagram, we adopted the 520 Myr isochrone from Baraffe's (1998),nextgen stellar evolution models, for low-mass stars of solar metallicity. The theoretical absolute K magnitudes were converted to apparent magnitudes using the Hipparcos distance of 89.9 ± 2.1 pc to the cluster (van Leeuwen 1999). The Baraffe J−K colour and K magnitude were converted from the Caltech (CIT) system for which they were computed to their 2MASS equivalents using the transformation of Carpenter (2001). We allow an intrinsic scatter ΣcK= 0.15 mag about the theoretical main sequence, assuming the depth of the cluster to be of the order of the 5–6 pc tidal radius estimated by Odenkirchen et al. (1998). The probability density function is assumed to be gaussian.

2MASS (K, J−K) CM diagram of stars with significant (FAP < 10−2) quasi-sinusoidal variability and periods between 1.1 and 20 days, in the WASP fields surveyed in 2004 and 2007. Previously known cluster members detected as rotational variables and satisfying our cluster membership criteria are encircled. The solid curve is the 520 Myr isochrone of Baraffe et al. (1998) for stars of solar metallicity at the distance of the Coma Berenices cluster.


In Fig. 4, we plot the cluster membership probabilities of the 50 rotational variables that are the most likely cluster members, in descending order of rank. The properties of the 30 stars with membership probabilities greater than 0.5 are listed in Table 2, together with cross-identifications with previous catalogues of cluster members.
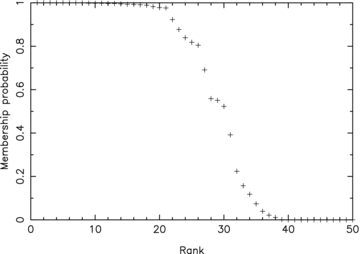
Ranked cluster membership probabilities of the top 50 stars (+) whose light curves recorded by one or more WASP cameras in 2004 or 2007 showed significant (FAP < 10−2) quasi-sinusoidal variability and periods between 1.1 and 20 days. The membership probability is determined from the proper motions and K magnitude distributions for cluster and field stars, as described in the text. 30 stars have cluster membership probabilities greater than 0.5.
Cross-identifications, 2MASS photometry and proper motions of candidate rotational variables with membership probabilities greater than 0.5.
| 1SWASP | USNO B-1.0 | Cl Melotte 111 | Spectral type | J−K | Ks | θ (°) | μα (mas yr−1) | μδ (mas yr−1) | Membership probability |
| J114837.70+281630.5 | 1182-0217523 | New member | G8 | 0.430 | 8.585 | 7.976 | −10.6 ± 0.7 | −7.6 ± 0.7 | 0.976 465 |
| J115533.35+294341.7 | 1197-0194906 | New member | K3 | 0.635 | 9.057 | 7.117 | −7.9 ± 0.9 | −8.2 ± 1.1 | 0.993 480 |
| J120052.24+271923.9 | 1173-0240221 | New member | K4 | 0.678 | 8.996 | 5.118 | −11.9 ± 0.7 | −4.4 ± 0.7 | 0.997 313 |
| J120222.86+225458.7 | 1129-0233236 | New member | K4 | 0.787 | 9.603 | 5.614 | −4.3 ± 1.3 | 2.9 ± 1.1 | 0.818 328 |
| J120757.72+253511.3 | 1155-0190903 | AV 189 | K3 | 0.628 | 8.906 | 3.410 | −11.5 ± 1.2 | −7.7 ± 0.9 | 0.998 392 |
| J120836.10+310609.9 | 1211-0194040 | New member | K7 | 0.765 | 9.402 | 6.002 | −16.8 ± 1.6 | −4.1 ± 2.0 | 0.977 817 |
| J121135.15+292244.5 | 1193-0195921 | New member | K4 | 0.596 | 8.979 | 4.219 | −12.5 ± 0.8 | −9.9 ± 0.9 | 0.997 246 |
| J121253.23+261501.3 | 1162-0201218 | AV 523 | K2 | 0.587 | 8.990 | 2.284 | −11.0 ± 1.1 | −9.0 ± 0.7 | 0.991 622 |
| J122115.62+260914.0 | 1161-0200668 | AV 1183 | K4 | 0.642 | 8.972 | 0.420 | −13.1 ± 1.4 | −9.2 ± 1.0 | 0.998 253 |
| J122347.22+231444.3 | 1132-0216856 | AV 1404 | K4 | 0.659 | 9.018 | 2.760 | −12.5 ± 0.6 | −8.4 ± 0.6 | 0.999 326 |
| J122601.31+342108.4 | 1243-0197448 | New member | K5 | 0.702 | 9.143 | 8.378 | −2.1 ± 1.8 | −5.4 ± 2.2 | 0.922 972 |
| J122651.03+261601.8 | 1162-0204591 | AV 1660 | K4 | 0.699 | 9.156 | 0.905 | −13.3 ± 1.3 | −4.4 ± 1.1 | 0.992 839 |
| J122720.68+231947.4 | 1133-0208375 | AV 1693 | G8 | 0.461 | 8.451 | 2.847 | −11.5 ± 0.7 | −8.8 ± 0.6 | 0.999 931 |
| J122748.29+281139.8 | 1181-0230534 | AV 1737, T141 | G8 | 0.386 | 8.050 | 2.441 | −13.1 ± 0.6 | −8.7 ± 0.6 | 0.999 997 |
| J122856.43+263257.4 | 1165-0203085 | AV 1826, T220 | K1 | 0.547 | 8.661 | 1.441 | −12.6 ± 0.7 | −9.2 ± 0.8 | 0.999 831 |
| J123231.07+351952.2 | 1253-0200298 | New member | G0 | 0.321 | 8.086 | 9.552 | −12.2 ± 1.4 | −10.7 ± 1.0 | 0.999 935 |
| J123320.01+222423.3 | 1124-0241610 | New member | G8 | 0.453 | 8.402 | 4.297 | −12.6 ± 0.7 | −8.5 ± 0.7 | 0.999 955 |
| J123342.12+255634.0 | 1159-0194918 | AV 2177 | K0 | 0.447 | 8.584 | 2.406 | −10.7 ± 0.7 | −7.7 ± 0.7 | 0.995 428 |
| J123454.29+272720.2 | 1174-0253286 | AV 2257 | G0 | 0.387 | 7.510 | 3.031 | −9.8 ± 1.2 | −8.9 ± 0.6 | 0.550 545 |
| J123811.47+233322.2 | 1135-0193392 | New member | M0 | 0.813 | 9.963 | 4.226 | −12.0 ± 5.8 | −8.6 ± 5.8 | 0.522 927 |
| J123941.99+213458.0 | 1115-0215169 | New member | K5 | 0.689 | 8.799 | 5.839 | −6.6 ± 0.7 | −3.5 ± 1.7 | 0.558 604 |
| J124235.14+410527.7 | 1310-0230997 | New member | K5 | 0.683 | 9.273 | 15.626 | −7.1 ± 1.5 | −1.4 ± 2.1 | 0.804 599 |
| J124900.42+252135.6 | 1153-0197249 | New member | K5 | 0.681 | 9.069 | 5.894 | −10.3 ± 0.7 | −6.8 ± 0.7 | 0.997 940 |
| J124930.43+253211.1 | 1155-0197399 | New member? | K5 | 0.682 | 8.931 | 5.985 | −15.3 ± 1.4 | −6.0 ± 2.1 | 0.982 752 |
| J125001.70+210312.1 | 1110-0214013 | New member | K3 | 0.582 | 8.976 | 7.925 | −13.4 ± 1.4 | 8.1 ± 1.5 | 0.839 267 |
| J125211.61+252224.5 | 1153-0197624 | New member | F8 | 0.272 | 7.609 | 6.606 | −12.8 ± 1.2 | −9.0 ± 1.0 | 1.000 000 |
| J125314.67+240313.6 | 1140-0196476 | New member | K5 | 0.750 | 9.452 | 7.121 | 5.3 ± 2.7 | −17.1 ± 3.9 | 0.690 814 |
| J125736.86+285844.7 | 1189-0206667 | New member | G8 | 0.424 | 8.473 | 8.231 | −12.5 ± 0.6 | −7.5 ± 0.7 | 0.999 222 |
| J125927.75+194115.1 | 1096-0208690 | New member | K5 | 0.692 | 9.034 | 10.502 | −9.3 ± 5.3 | −9.7 ± 5.5 | 0.877 254 |
| J130543.99+200321.4 | 1100-0213302 | New member | K2 | 0.605 | 8.922 | 11.481 | 3.5 ± 0.6 | −6.4 ± 1.0 | 0.989 022 |
Note. The 1SWASP identifier encodes the J2000.0 coordinates of the object. θ denotes the angular distance of the star from the cluster centre. The spectral types are estimated from 2MASS photometry using the calibration of Blackwell & Lynas-Gray (1994).
6 PERIOD–COLOUR RELATION
The rotation periods of all stars with FAPs less than 0.01 and membership probabilities greater than 0.5 are plotted as a function of J−K colour in Fig. 5. Among these, the periods of stars with cluster membership probabilities greater than 0.85 are denoted by solid symbols. They follow a tight period–colour relation. The properties of these stars are listed in Table 2, including cross-identifications with previous catalogues of cluster members. The rotational parameters of individual light curves that yielded significant detections in the 2004 and 2007 seasons are listed in Table 3.
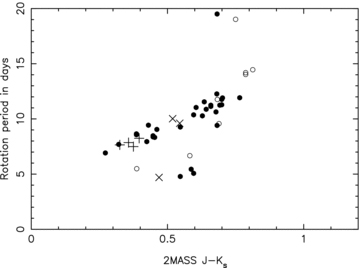
Photometric rotation period as a function of 2MASS (J−K) colour for stars with significant (FAP < 10−2) quasi-sinusoidal variability and cluster membership probability greater than 0.5, in the WASP fields surveyed in 2004 and 2007. Periods measured for candidates with cluster membership probabilities greater than 0.85 are denoted by filled circles; those with membership probabilities between 0.5 and 0.85 are denoted by open circles. Additional stars from Radick et al. (1990) and Marilli et al. (1997) are denoted by ‘+’ and ‘x’ symbols, respectively.
Sine-fitting periods for light curves of candidate rotational variables in the vicinity of Melotte 111, with cluster membership probabilities greater than 0.5.
| 1SWASP | Season | Field_cam | Nobs | Period (days) | Amplitude (mag) | FAP |
| J114837.70+281630.5 | 2004 | SW1143+3126_102 | 1138 | 9.43 | 0.005 | 0.000 079 |
| J115533.35+294341.7 | 2004 | SW1143+3126_102 | 1139 | 11.55 | 0.005 | 0.001 371 |
| J120052.24+271923.9 | 2007 | SW1217+2350_142 | 2841 | 10.63 | 0.010 | 0.000 374 |
| J120222.86+225458.7 | 2004 | SW1217+2326_104 | 1149 | 14.03 | 0.004 | 0.007 144 |
| J120222.86+225458.7 | 2007 | SW1217+2350_142 | 2824 | 14.19 | 0.008 | 0.001 182 |
| J120757.72+253511.3 | 2007 | SW1217+2350_142 | 2841 | 10.28 | 0.005 | 0.003 890 |
| J120836.10+310609.9 | 2007 | SW1222+3000_144 | 2960 | 11.92 | 0.007 | 0.002 868 |
| J121135.15+292244.5 | 2004 | SW1216+3126_103 | 1034 | 10.37 | 0.009 | 0.001 038 |
| J121135.15+292244.5 | 2007 | SW1222+3000_144 | 2959 | (5.07) | 0.006 | 0.001 124 |
| J121253.23+261501.3 | 2007 | SW1217+2350_142 | 2840 | (5.44) | 0.006 | 0.006 021 |
| J122115.62+260914.0 | 2004 | SW1217+2326_104 | 1147 | 10.88 | 0.011 | 0.000 146 |
| J122347.22+231444.3 | 2004 | SW1217+2326_104 | 1149 | 11.13 | 0.010 | 0.003 327 |
| J122347.22+231444.3 | 2007 | SW1217+2350_142 | 2841 | 11.24 | 0.009 | 0.000 749 |
| J122601.31+342108.4 | 2004 | SW1216+3126_103 | 1034 | 11.90 | 0.023 | 0.001 428 |
| J122651.03+261601.8 | 2004 | SW1244+2427_101 | 2269 | 11.77 | 0.005 | 0.000 632 |
| J122651.03+261601.8 | 2007 | SW1222+3000_144 | 2910 | 11.28 | 0.006 | 0.008 509 |
| J122656.48+224054.7 | 2004 | SW1244+2427_101 | 2265 | (5.77) | 0.020 | 0.006 039 |
| J122720.68+231947.4 | 2004 | SW1244+2427_101 | 2183 | 9.05 | 0.006 | 0.000 308 |
| J122748.29+281139.8 | 2007 | SW1222+3000_144 | 2904 | 8.65 | 0.010 | 0.002 253 |
| J122748.29+281139.8 | 2007 | SW1238+3135_143 | 3255 | 8.57 | 0.012 | 0.000 008 |
| J122748.29+281139.8 | 2007 | SW1242+2418_141 | 3575 | 8.59 | 0.011 | 0.000 008 |
| J122856.43+263257.4 | 2004 | SW1244+2427_101 | 2268 | (4.79) | 0.006 | 0.001 287 |
| J122856.43+263257.4 | 2007 | SW1242+2418_141 | 3833 | 9.26 | 0.007 | 0.006 194 |
| J122942.15+283714.6 | 2007 | SW1222+3000_144 | 2894 | 16.05 | 0.004 | 0.003 018 |
| J123231.07+351952.2 | 2004 | SW1243+3126_102 | 2259 | 7.69 | 0.008 | 0.000 009 |
| J123320.01+222423.3 | 2007 | SW1242+2418_141 | 3833 | 8.33 | 0.006 | 0.001 505 |
| J123341.88+291401.7 | 2007 | SW1222+3000_144 | 2790 | 16.88 | 0.010 | 0.006 104 |
| J123342.12+255634.0 | 2004 | SW1217+2326_104 | 1147 | 8.38 | 0.010 | 0.003 695 |
| J123342.12+255634.0 | 2007 | SW1242+2418_141 | 3831 | 8.47 | 0.009 | 0.000 000 |
| J123354.22+270804.7 | 2007 | SW1222+3000_144 | 2722 | 16.54 | 0.008 | 0.006 181 |
| J123454.29+272720.2 | 2004 | SW1216+3126_103 | 1017 | (5.49) | 0.013 | 0.004 207 |
| J123811.47+233322.2 | 2007 | SW1242+2418_141 | 3828 | 14.46 | 0.013 | 0.000 240 |
| J123941.99+213458.0 | 2004 | SW1244+2427_101 | 2264 | 9.57 | 0.004 | 0.007 075 |
| J124235.14+410527.7 | 2007 | SW1241+3924_148 | 3548 | 11.76 | 0.003 | 0.003 510 |
| J124309.53+244705.2 | 2007 | SW1242+2418_141 | 3830 | 2.77 | 0.015 | 0.000 027 |
| J124523.35+425104.4 | 2007 | SW1241+3924_148 | 3542 | 12.05 | 0.030 | 0.002 383 |
| J124900.42+252135.6 | 2007 | SW1242+2418_141 | 3822 | 12.27 | 0.009 | 0.000 001 |
| J124930.43+253211.1 | 2004 | SW1244+2427_101 | 2264 | 19.51 | 0.017 | 0.000 018 |
| J124930.43+253211.1 | 2007 | SW1242+2418_141 | 3820 | (9.41) | 0.019 | 0.000 082 |
| J125001.70+210312.1 | 2004 | SW1244+2427_101 | 2267 | (6.67) | 0.003 | 0.003 746 |
| J125211.61+252224.5 | 2007 | SW1242+2418_141 | 3815 | 6.92 | 0.005 | 0.007 111 |
| J125314.67+240313.6 | 2004 | SW1244+2427_101 | 2267 | 19.02 | 0.027 | 0.000 555 |
| J125419.08+324935.1 | 2004 | SW1243+3126_102 | 2291 | 15.69 | 0.003 | 0.002 814 |
| J125736.86+285844.7 | 2004 | SW1243+3126_102 | 2279 | 7.94 | 0.007 | 0.003 388 |
| J125927.75+194115.1 | 2007 | SW1252+1735_147 | 3788 | 11.24 | 0.025 | 0.000 021 |
| J130543.99+200321.4 | 2007 | SW1252+1735_147 | 3625 | 11.04 | 0.003 | 0.002 140 |
Note. The year of observation is listed, with a designator incorporating the RA and Dec. of the field centre and a three-digit camera identifier for each light curve. The number Nobs of observations is listed, followed by the period of the peak in the periodogram yielding the greatest improvement in the χ2 statistic. Columns 6 and 7 give the amplitude of the fitted sinusoid and the FAP of the signal detection. Periods suspected of being half the true period appear in parentheses.
Several light curves yield periods that follow a second sequence in Fig. 5, with periods close to half those on the main relation.
A similar secondary period–colour sequence was noted by Hartman et al. (2009) in their recent study of the comparably aged cluster M37. Several of them were recorded independently in two or more of the WASP cameras, and some in different seasons, and were found to jump between the two relations. The K4 dwarf 1SWASP J121135.15+292244.5, for example, yields P= 10.37 d in 2004 and 5.07 d in 2007. Similarly, the K1 dwarf J122856.43+263257.4 yielded periods of 4.79 d in 2004 and 9.26d in 2007. The K2 dwarf 1SWASP J121253.23+261501.2 yields 10.38 d in 2004 and 5.44 d in 2007, though only the latter measurement has FAP < 0.01 and is listed here.
These stars almost certainly rotate with periods near the main relation. The reason for the intermittent frequency doubling is apparent from Fig. 6. The 2004 light curve yields a period half that of the 2007 light curve, but the longer period is clearly present in both seasons. Evidently, the apparent doubling of these stars' rotational frequencies at some epochs of observation arises from two dominant starspot groups on opposing stellar hemispheres giving a double-humped light curve. We conclude that the true periods of the light curves on the lower sequence are twice those derived from sine fitting. After correcting for frequency doubling, the period–colour relation is as shown in Fig. 7.

Light curves and periodograms for 1SWASP J122856.43+263257.4 observed in 2004 (top) and 2007 (bottom). Each set of four panels shows the unphased light curve at upper left. Occasional gaps in the data were caused by inclement weather. The periodogram of p=Δχ2/χ20 versus frequency is at upper right, with horizontal dashed lines denoting thresholds of FAP 0.1, 0.01 and 0.001. The vertical bar indicates the true rotational frequency. The light curve phased on the best-fitting period for the year concerned is shown at lower left, and the sine-wave amplitude periodogram at lower right. The 2004 data illustrate the frequency doubling that occurs when major spot complexes are present on opposite stellar hemispheres, giving a double-humped light curve.

As for Fig. 5, with the periods of the light curves on the lower branch having been doubled. The solid line is a least-squares linear fit to the period–colour relation, and the dashed lines delineate the scatter about the mean relation expected from cyclic changes in spot latitude on differentially rotating stars.
Among the stars with membership probabilities greater than 0.85, only one outlier is seen with a period that departs significantly from the main relation. This star, 1SWASP J124930.43+253211.1 (J−K= 0.682), exhibited a clear period of 19.51d in 2004, with a weak secondary minimum. In 2007, the period appears to be 9.41 d, but the minima alternate in depth indicating the true period to be 18.82 d. Meibom et al. (2009) noted the presence of several similarly anomalous slow rotators in their rotation study of M35, and proposed that partial or complete tidal synchronization in stellar binary systems could be responsible. Radial velocity observations of this star would be desirable to check whether it really belongs to the cluster, and to test for evidence of binarity.
Half of the 23 rotational variables with membership probabilities greater than 0.85 lie within  of the cluster centre, while the other half lie in the periphery of the cluster, between 4° and
  from the cluster centre. Among them, 14 appear to be previously uncatalogued cluster members. Rotational variability thus appears to be a useful method for identifying new members of the cluster and its extended halo.
In Figs 5 and 7, we also show previously published photometric periods for Melotte 111 stars T65, T76, T85 and T132 (Radick et al. 1990) and T203, T213 and T221 (Marilli et al. 1997), with their 2MASS colours.
The photometric periods found by Marilli et al. (1997) for T203 and T221 lie close to the SuperWASP period–colour relation. The 4.7-day period they found for T213 is very close to half the period predicted by equation (8). The sine-fitting method reveals a 9.51-day modulation in the WASP light curve of this star, but the FAP was below the threshold value 0.01 that would qualify it as a secure detection. We adopt a period of 9.4 days for this object, twice that reported by Marilli et al.

The rms scatter of the observed periods about the fitted period–colour relation is 0.19 days – just 2 per cent of the mean period – and is not improved by the inclusion of quadratic or higher terms. This scatter is so small that much of it is attributable to year-to-year changes in the photometric modulation periods of the cluster stars themselves. There are seven instances in which periods were measured for the same star in both 2004 and 2007. These season-to-season period differences are 0.09, 0.11, 0.16, 0.23, 0.32 and 0.49 days. The season-to-season differences in the period determinations for a given star average 0.23 days, comparable to the scatter about the mean relation. Radick et al. (1995) reported finding very similar season-to-season period variations of between 2 and 8 per cent in their 12-year study of rotation in the Hyades.
There are two possible explanations for this trend: latitudinal differential rotation and core-envelope decoupling, both of whose effects will be superimposed on a spread at all spectral types resulting from a range of disc-locking lifetimes.
We expect the resulting scatter in rotation frequency to be no more than half this amount, if the main active belts migrate across a similar range of latitudes as the solar butterfly diagram occupies on the Sun. The corresponding range of rotation periods at each colour is shown in Fig. 7. The dispersions about the main period–colour reported here and by Hartman et al. (2009) in M37 are comparable to the scatter expected from differential rotation for the F and G stars. The K stars also show season-to-season period changes that are most easily explained by a degree of differential rotation somewhat greater than Doppler imaging studies have found among more rapidly rotating stars of similar mass. At all colours, we find the season-to-season period changes to contribute a significant fraction, though perhaps not all, of the overall scatter about the mean period–colour relation.
Additional residual scatter is expected at all spectral types if the early spin rates of stars are regulated by torque balance with accretion discs having a range of lifetimes. Such ‘disc-locking’ models are reasonably successful at explaining the distribution of stellar spin rates on the zero-age main sequence (Collier Cameron, Campbell & Quaintrell 1995; Keppens, MacGregor & Charbonneau 1995; Krishnamurthi et al. 1997; Allain 1998).
Once the star decouples from the disc, angular momentum is lost through the stellar wind alone, but the spin-down behaviour of the stellar surface depends critically on the degree of coupling between the star's radiative interior and convective envelope. Stauffer & Hartmann (1987) sought to explain the rapid spin-down of G dwarfs between the ages of the 50 Myr old α Per cluster and the 70 Myr old Pleiades by suggesting that magnetic braking early in a star's life may spin-down only the outer convective layers at first, leaving a decoupled reservoir of angular momentum in the stellar radiative core. If the coupling time-scale on which the stored angular momentum is transported from the core back into the envelope is longer than a few tens of Myr, outward angular momentum transport will spin-up the envelope at intermediate ages. This will counter the effects of magnetic braking and delay full convergence to a single period–colour relation. The effect would be lessened in K dwarfs, whose radiative interiors comprise a smaller fraction of the total stellar moment of inertia.
Several authors have modelled and discussed the implications of core-envelope decoupling for cluster period distributions at various ages (Li & Collier Cameron 1993; Collier Cameron & Li 1994; Krishnamurthi et al. 1997; Allain 1998; Wolff, Strom & Hillenbrand 2004; Soderblom, Jones & Fischer 2001). The models in these papers indicate that the weakest core-envelope coupling that can ensure the observed near solid-body rotation in the solar interior at an age of 4.6 Gyr would produce a dispersion by a factor 2 or more in the spin rates of solar-type stars at the age of the Hyades and Coma. The observed scatter among Coma stars with mid-F to mid-G spectral types is, however, only of the order of 2 per cent. Since much of this is demonstrably caused by differential rotation, the evolutionary contribution to the scatter must be small. This argues strongly for coupling time-scales substantially shorter than the cluster age.
7 GYROCHRONOLOGICAL AGES OF COMA AND HYADES
The tight period–colour relation for the rotational variables found within 12° of the core of the Coma Berenices cluster, sharing the proper motion and lying close to the cluster main sequence, contrasts strongly with the bimodal distribution of rotation periods seen in younger clusters. The absence of a population of rapid rotators in our survey is not, however, surprising because our faint limit extends only to the boundary between K and M spectral types. In the Hyades, rapid rotation is only seen at spectral types later than our faint limit. At earlier spectral types, the period–colour relation in Coma resembles the pattern of rotation rates observed in the Hyades by Radick et al. (1987), and subsequently updated by Radick et al. (1995). In Fig. 8, we show the period–colour relations for both clusters, using 2MASS J−K colours for the Hyades stars. All but five of the Radick et al. stars were included in the Hipparcos survey of the Hyades by Perryman et al. (1998), and were identified as cluster members from their parallaxes, proper motions and radial velocities.
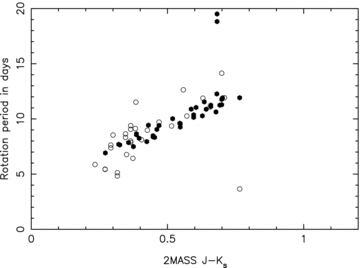
Period–colour relations for Coma Berenices (filled circles) and the Hyades (open circles). The Hyades J−K colours are taken from 2MASS, and the Hyades rotation periods from Radick et al. (1987).


Gyrochronological ages for individual light curves of stars in Coma Berenices (filled circles) and the Hyades (open circles), derived from equation (10).

Cumulative distributions of gyrochronological ages for individual light curves of stars in Coma Berenices (filled circles) and the Hyades (open circles), derived from equation (10). The mean age of the Coma Berenices stars is 591 Myr; that of the Hyades is 625 Myr.
Equation (11) yields a predicted sidereal solar photometric modulation period of 21.8 days for an assumed (J−K)⊙= 0.354 (Ramírez & Meléndez 2005) and a solar age t⊙= 4.56 Gyr. This is shorter than the observed 26.1-day sidereal period of sunspots in the mid-latitude active belt (Donahue, Saar & Baliunas 1996). Conversely, the Sun's 26.1-day period yields an age of 6.5 Gyr using equation (10) with tComa= 591 Myr. While an idealized braking law of this kind is convenient, it is unlikely to be appropriate for real stars whose moments of inertia evolve throughout their main-sequence lifetimes. A convenient first-order correction may be a simple adjustment to the index b of the braking power law P∝tb, as Barnes (2007) has proposed.
The major obstacle to fine-tuning the braking power-law index is the lack of old stars with reliably determined ages and spin periods. A very few stars have already had their spin periods determined from the rotational modulation of their chromospheric Ca ii H and K emission, and their ages determined from their solar-like p-mode oscillation patterns, namely α Cen A and B and 70 Oph A. Barnes (2007) found α Cen A and B to have comparable gyrochronological ages, from their respective spin periods of 28.0 and 36.9 days; Eggenberger et al. (2004) derived an asteroseismological age of 6.5 ± 0.3 Gyr for the α Cen system. The spin period of 70 Oph A was found by Stimets & Giles (1980) to be 20.1 days and by Noyes et al. (1984) to be 19.7 days from the same set of Mt Wilson Ca ii H and K modulation data. Eggenberger et al. (2008) determine an asteroseismological age of 6.2 ± 1.0 Gyr for 70 Oph A.
J−K colours and spin periods for the Sun and old main-sequence stars with measured rotation periods and asteroseismological age determinations.
| Star | J−K | Period (days) | Gyro Age (b= 0.5) | Gyro Age (b= 0.56) | Seismo Age (Gyr) |
| Sun | 0.354 | 26.1 ± 2.0 | 6.5 ± 1.0 | 5.0 ± 0.7 | 4.57 |
| α Cen A | 0.35 | 28.0 ± 3.0 | 7.6 ± 1.7 | 5.8 ± 1.1 | 6.5 ± 0.3 |
| α Cen B | 0.49 | 36.9 ± 1.8 | 9.3 ± 0.9 | 6.9 ± 0.6 | 6.5 ± 0.3 |
| 70 Oph A | 0.55 | 19.9 ± 0.5 | 2.4 ± 0.1 | 2.0 ± 0.1 | 6.2 ± 1.0 |
| 70 Oph A | 0.55 | 39.8 ± 1.0 | 9.5 ± 0.5 | 7.0 ± 0.3 | 6.2 ± 1.0 |
Note. The J−K colours were determined using the effective temperatures and interpolating formulae of Ramírez & Meléndez (2005). The rotation periods are from Donahue et al. (1996) for the Sun, Barnes (2007) for α Cen and from Stimets & Giles (1980) and Noyes et al. (1984) for 70 Oph A. The last row is based on the supposition that the true period of 70 Oph A is twice the measured period. The asteroseismological ages for α Cen and 70 Oph A are from Eggenberger et al. (2004, 2008). The gyro ages are estimated for two different values of the magnetic braking power-law index b.
A departure of the braking power-law index from the b= 0.5 of the Skumanich relation also seems to be needed in the comparison between K dwarfs in M35 and the Hyades (Meibom et al. 2009). Hartman et al. (2009) also find that they cannot fit M37, Hyades and the Sun simultaneously with a braking law that yields an asymptotic t−1/2 age dependence for the stellar spin rate. Barnes (2007) and Mamajek & Hillenbrand (2008) find similar departures from the Skumanich relation in their gyrochronological age calibrations for cluster and field stars. For the purposes of the present investigation, however, the ages of the Hyades and Coma are in any case so similar that such small changes in the braking index will have little effect on the ratio of the two clusters' ages.
8 CONCLUSIONS
We have shown that inverse variance-weighted sine-fitting searches yield reliable period determinations from SuperWASP data in stars as faint as Ks= 10, with amplitudes of rotational variability as low as 0.003 mag and periods of the order of 10 days recovered reliably with generalized Lomb–Scargle FAPs less than 0.01. This has enabled us to carry out the first comprehensive study of rotation among the F, G and K dwarfs in the Coma Berenices open cluster. We find a narrow, nearly linear relation between rotation period and colour from mid-F to late-K spectral types.
The scatter of the individual stellar rotation rates about the mean period–colour relation is surprisingly small, as has previously been noted by Radick et al. (1987) from their study of the Hyades, by Hartman et al. (2009) and Messina et al. (2008) from their more recent studies of M37 and by Meibom et al. (2009) from their study of M35. Indeed, our period–colour relation for Coma has a markedly lower scatter about the mean relation than Radick et al. found for the Hyades. It is not clear whether the difference in scatter is intrinsic, or simply reflects the much denser sampling of the SuperWASP observations. Some of the rotation periods in the Radick et al. Hyades sample were derived from as few as 30 observations per star obtained over an interval of 5 months. The SuperWASP periods in Coma are derived from between 1000 and 3800 observations over a 4-month period in each observing season.
The rms scatter about the mean period–colour relation in Coma is less than 5 per cent. A substantial fraction of this scatter appears to be attributable to season-to-season changes in period, caused by differential rotation and secular changes in active-region latitudes. The remaining few-per cent residuals about the fitted period–colour relation are consistent with the not-quite-complete convergence in spin rates expected from rotational models at this age. We do not see the large scatter expected from models with core-envelope coupling time-scales longer than about 100 Myr. Even solid-body spin-down models leave a residual scatter in rotation rates at the age of Coma and the Hyades. This residual scatter depends somewhat on the detailed form of the braking law among the fastest rotators at early ages, but is seldom less than about 10 per cent in the models cited above.
Although the stars in these clusters have not entirely forgotten their original spin rates, the degree of convergence is good enough to yield reasonably accurate gyrochronological age estimates. The scatter in the period–colour relation propagates into the distribution of ages for individual cluster stars derived from a linear period–colour relation assuming a simple t−1/2 spin-down law (Skumanich 1972). The most remarkable feature of Fig. 10 is the sharpness of the age distribution inferred for Coma. The rms scatter in the gyrochronological ages for the Coma stars is only just over 9 per cent of the mean age derived for the ensemble. This high degree of internal consistency is echoed in M37, M35 and the Hyades, as other authors have noted previously.
We have used J−K as the colour index of choice for defining a period–colour–age relation based on the Coma data, partly because of the ready availability of well-determined JHK colours in the 2MASS point-source catalogue for stars in the SuperWASP magnitude range and partly because J−K is less subject to reddening and metallicity effects than the more widely used B−V (Houdashelt, Bell & Sweigart 2000). Differences in metallicity from cluster to cluster may affect the B−V colour at a given mass, and the period to which stars of a given mass converge at a given age. We raise the latter possibility because the angular momentum loss rate in a thermally driven wind depends on the wind temperature as well as the total open magnetic flux threading the wind (Mestel & Spruit 1987; Collier Cameron & Li 1994). A dependence of wind temperature on metallicity would lead to systematic differences in the asymptotic rotation rate for stars of a given mass and age in clusters with different abundances.
Despite these caveats, the relative ages derived here for Coma and the Hyades are in close agreement with the difference in their isochrone ages, even though, according to Cayrel de Strobel et al. (1997), the metallicity of Coma is subsolar by about 0.05 dex, while the Hyades is overabundant by about +0.15 dex. Our results thus support the contention of Barnes (2007) that a properly-calibrated stellar rotational clock can provide a viable means of age determination in F, G and K stars that rotate more slowly than their counterparts of the same colour in the Hyades, Coma Berenices and M37 clusters.
Some fine-tuning will still be needed to obtain gyrochronological ages of the best possible precision for main-sequence F, G and K stars. We contend that asteroseismology offers a promising way forward, providing precise measurements of both stellar ages and spin periods in mature main-sequence stars. Although such analysis is exacting and only feasible for very bright stars, it will provide valuable gyrochronological calibration standards at later ages. Gyrochronological ages can then be determined for much larger numbers of fainter stars, in a manner analogous to the cosmological distance ladder.
The WASP Consortium consists of representatives from the Universities of Keele, Leicester, The Open University, Queens University Belfast and St Andrews, along with the Isaac Newton Group (La Palma) and the Instituto de Astrofisica de Canarias (Tenerife). The SuperWASP and WASP-S Cameras were constructed and operated with funds made available from Consortium Universities and PPARC/STFC. This publication makes use of data products from the 2MASS, which is a joint project of the University of Massachusetts and the Infrared Processing and Analysis Center/California Institute of Technology, funded by the National Aeronautics and Space Administration and the National Science Foundation. This research has made use of the VizieR catalogue access tool, CDS, Strasbourg, France. We also thank the anonymous referee for insightful comments that led to substantial improvements in our methodology.
REFERENCES
