


Abstract
We present optical and X-ray data for a sample of serendipitous XMM–Newton sources that are selected to have 0.5–2 versus 2–4.5 keV X-ray hardness ratios which are harder than the X-ray background. The sources have 2–4.5 keV X-ray flux ≥10−14 erg cm−2 s−1, and in this paper we examine a subsample of 42 optically bright (r < 21) sources; this subsample is 100 per cent spectroscopically identified. All but one of the optical counterparts are extragalactic, and we argue that the single exception, a Galactic M star, is probably a coincidental association rather than the correct identification of the X-ray source. The X-ray spectra of all the sources are consistent with heavily absorbed power laws (21.8 < log NH < 23.4), and all of them, including the two sources with 2–10 keV intrinsic luminosities of <1042 erg s−1, appear to be absorbed active galactic nuclei (AGN). The majority of the sources show only narrow emission lines in their optical spectra, implying that they are type 2 AGN. Three sources have 2–10 keV luminosities of >1044 erg s−1, and two of these sources have optical spectra which are dominated by narrow emission lines, that is, are type 2 QSOs. Only a small fraction of the sources (7/42) show broad optical emission lines, and all of these have NH < 1023 cm−2. This implies that ratios of X-ray absorption to optical/ultraviolet extinction equivalent to >100 times the Galactic gas-to-dust ratio are rare in AGN absorbers (at most a few per cent of the population), and may be restricted to broad absorption line QSOs. Seven objects appear to have an additional soft X-ray component in addition to the heavily absorbed power law; all seven are narrow emission-line objects with z < 0.3 and 2–10 keV intrinsic luminosities <1043 erg s−1. We consider the implications of our results in the light of the AGN unified scheme. We find that the soft components in narrow-line objects are consistent with the unified scheme provided that >4 per cent of broad-line AGN (BLAGN) have ionized absorbers that attenuate their soft X-ray flux by >50 per cent. In at least one of the X-ray-absorbed BLAGN in our sample the X-ray spectrum requires an ionized absorber, consistent with this picture.
1 INTRODUCTION
Deep surveys with Chandra and XMM–Newton have now resolved the majority of the extragalactic X-ray background (XRB) at <5 keV into point sources (Rosati et al. 2002; Alexander et al. 2003; Bauer et al. 2004; Worsley et al. 2004). At the bright flux limits that were probed with Einstein and ROSAT surveys, the soft X-ray sky is dominated by broad-line active galactic nuclei (BLAGN) with soft X-ray spectra (Maccacaro et al. 1988; Mittaz et al. 1999). At faint fluxes, the bulk of the sources have hard X-ray spectra (Brandt et al. 2001; Giacconi et al. 2001), as required to produce the overall XRB spectral shape. XRB synthesis models predict that these faint, hard sources are intrinsically absorbed AGN (e.g. Setti & Woltjer 1989; Comastri et al. 1995; Gilli, Salvati & Hasinger 2001). These absorbed sources are likely to be the dominant AGN population: they are responsible for the majority of the XRB energy density and probably outnumber unabsorbed AGN by a factor of 4 or more (Fabian & Iwasawa 1999), as is found in optical and X-ray studies of local AGN (Maiolino & Rieke 1995; Risaliti, Maiolino & Salvati 1999). Optical/infrared imaging and spectroscopy of the faint, hard-spectrum sources, while consistent with the absorbed AGN hypothesis, reveals a heterogeneous population. Many of these sources are narrow-line AGN (Seyfert type 2 galaxies and type 2 QSOs), others show no emission lines whatsoever, while some are optically unobscured, BLAGN (e.g. Mainieri et al. 2002; Barger et al. 2003; Szokoly et al. 2004; Page et al. 2006b). This variety suggests that there is a large range of gas-to-dust ratios within the absorbed population.
There are a variety of important issues regarding the absorbed population which remain to be addressed. First, the relationship between the optical spectroscopic characteristics and the level of X-ray absorption is not fully understood (e.g. Maiolino et al. 2001; Page, Mittaz & Carrera 2001; Boller et al. 2003; Barcons, Carrera & Ceballos 2003a; Caccianiga et al. 2004; Carrera, Page & Mittaz 2004). Nor is it established whether the fraction of absorbed AGN depends on redshift and/or luminosity: several recent studies suggest that the fraction of absorbed AGN decreases with luminosity and/or redshift (e.g. Barger et al. 2003; Cowie et al. 2003; Steffen et al. 2003; Ueda et al. 2003; La Franca et al. 2005), while other studies suggest that the absorbed fraction is independent of luminosity (e.g. Treister et al. 2004; Dwelly et al. 2005; Dwelly & Page 2006; Tozzi et al. 2006). Indeed, this issue has been debated since at least the early 1980s (e.g. Lawrence & Elvis 1982; Mushotzky 1982; Maccacaro, Gioia & Stocke 1984). Another particularly important question is whether the absorbed AGN population is wholly related to the unabsorbed population by AGN geometric unification schemes (Antonucci 1993). BLAGN with significant X-ray absorption but little or no optical/ultraviolet (UV) obscuration (e.g. Barr et al. 1977; Elvis et al. 1994; Akiyama et al. 2000; Page et al. 2001) have proven particularly challenging to fit within such schemes. Alternatively, parts of the absorbed population may be physically distinct from the unabsorbed population, as predicted by some evolutionary models (Sanders et al. 1988; Fabian 1999; Elvis, Marengo & Karovska 2002; Franceschini, Braito & Fadda 2002; Page et al. 2004).
In this paper we present a sample of serendipitous XMM–Newton sources selected to have hard X-ray spectra in the 0.5–4.5 keV energy range. This sample is well suited for the study of the X-ray and optical characteristics of the X-ray/optically bright part of the X-ray-absorbed AGN population. We describe the X-ray and optical selection of the sample in detail in Section 2, and in Sections 3 and 4 we describe the optical spectroscopic observations and the construction of the X-ray spectra. Our results are presented in Section 5 and their implications for the absorbed AGN population are discussed in Section 6. Throughout this paper we assume H0= 70 km s−1 Mpc−1, Ωm= 0.3 and ΩΛ= 0.7. We define a power-law spectrum such that dN/dE=AE−Γ where N is the number of photons, E is photon energy, Γ is the photon index and A is the normalization.
2 SAMPLE SELECTION
The sources were categorized according to optical magnitude to facilitate our optical identification programme. Those sources with counterparts on SuperCOSMOS digitizations of the Palomar or United Kingdom Schmidt Telescope sky-survey plates within 6 arcsec of the X-ray position will be referred to as the optically bright sample; this amounts to 73 sources, and provides the target list for our spectroscopic identification programme on 4-m telescopes. Those sources without sky-survey counterparts2 but which have counterparts in deeper imaging form the target list for our spectroscopic identification programme on 8–10 m telescopes and are considered the optically faint sample. Our identification programme for the optically faint sample is ongoing. The final category of sources (‘blank-field sources’) are those for which no optical counterpart is found to r∼ 23. Discussion of the optically faint and blank-field samples is deferred to a future paper pending the results of the 8–10 m spectroscopic campaign.
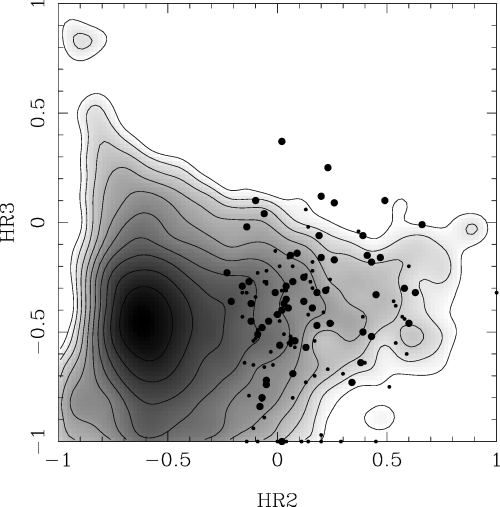
HR2 and HR3 hardness ratio distribution of the optically bright sources (large dots) and optically faint/blank-field sources (small dots) from the hard-spectrum sample. The underlying grey-scale and contours show the pn-camera hardness ratio distribution of the entire high Galactic latitude (∣b∣ > 20°) 1XMM catalogue, and have a logarithmic scaling (Watson et al. 2003).
The optical magnitudes and X-ray fluxes of the hard-spectrum sources are shown in Fig. 2, and in this figure we also show the interval ∣log10(fX/fR)∣ < 1, where fX and fR are X-ray flux and optical flux, respectively, as defined by McHardy et al. (2003).3 The majority of hard-spectrum sources lie within this interval, as do most of the X-ray-selected population at this flux level (Stocke et al. 1991).
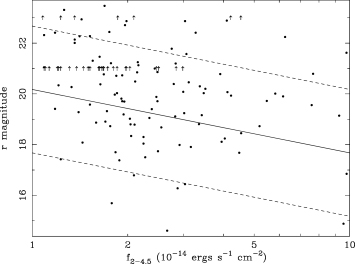
2–4.5 keV X-ray flux versus optical r-band magnitude for the hard-spectrum sources. The solid line corresponds to the ratio fX/fR= 1 and the dashed lines indicate the ±1 dex interval, where fX/fR is the ratio of X-ray to optical flux as defined in McHardy et al. (2003). The 2–4.5 keV fluxes (f2–4.5) were determined from the 2–4.5 keV count rates, assuming a photon index Γ= 1.7.
3 OPTICAL SPECTROSCOPIC OBSERVATIONS
Optical spectra were obtained in two observing runs. The first run took place on the nights of 2003 January 27 and 28 at the William Herschel Telescope (WHT) on La Palma. Observing conditions were variable, but most of the data were taken in conditions of good seeing (∼1 arcsec) and sky transparency. Observations were made with the ISIS dual arm spectrograph using a 1.5-arcsec slit oriented at the parallactic angle, and employing the 5400 Å dichroic. On the blue arm we used the R300B grating, covering the wavelength range from 3000 to 5700 Å at 4.9-Å resolution (measured from arc lines taken through the slit) and on the red arm we used the R158R grating, covering the wavelength range 5000–10 000 Å at 10.1-Å resolution. Spectra of CuNe and CuAr arc lamps were used to calibrate the wavelength scale. Flux calibration, and approximate correction for the telluric absorption bands at ∼6900 and ∼7600 Å were achieved through observations of G191−B2B and BD+33 2642. Data were reduced using standard iraf routines. The reduced, flux-calibrated spectra from the red and blue arms were then merged to form a single spectrum for each target.
The second observing run took place at the New Technology Telescope at La Silla on the nights of the 2003 May 2 and 3 in conditions of variable seeing and sky transparency. Observations were made using the EMMI spectrograph using a 1-arcsec slit at the parallactic angle and grism #3, providing 8-Å resolution and a wavelength range of 3800–9000 Å. Spectra of He and Ar arc lamps were used to calibrate the wavelength scale. Observations of the spectrophotometric standards LTT4364 and LTT2415 were used for relative flux calibration.
In total, spectra of the optical counterparts to 42 hard-spectrum sources were observed. The spectra are shown in Fig. 3. The spectroscopic completeness is 100 per cent for the observed sample, that is, an adequate spectrum yielding a reliable redshift was obtained for every optical counterpart that was observed. Apart from the selection of counterparts from sky-survey plates, we did not bias the spectroscopic observations to bright sources. To demonstrate this, Fig. 4 compares the optical magnitude distributions for the optically bright sources which were and were not observed spectroscopically; the two distributions are indistinguishable according to the Kolmogorov–Smirnov test, which gives the probability that they were both drawn from the same distribution as 46 per cent. Hence our spectroscopically identified sources are a representative and statistically complete sample of the optically bright (r<21), hard-spectrum population.


Optical spectra of hard-spectrum serendipitous sources.
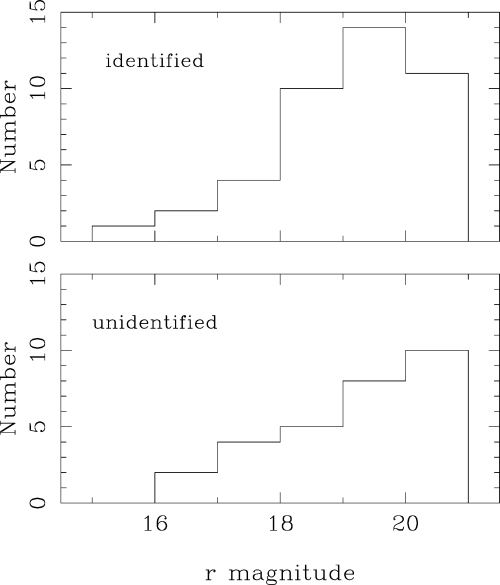
Magnitude distributions for sources with r < 21 which were (upper panel) and were not (lower panel) observed during our optical spectroscopic observations.
4 CONSTRUCTION OF X-RAY SPECTRA
We extracted X-ray spectra for every source using the available XMM–Newton EPIC data. For sources which are present in more than one XMM–Newton observation in the public archive, we have used all the available data to obtain the highest possible signal-to-noise ratio. Table 1 gives the XMM–Newton observations used to construct the X-ray spectrum of each source. The EPIC data were reduced using the sas version 5.4. The XMM–Newton point spread function changes with off-axis angle. Therefore source spectra were extracted from elliptical source regions with sizes and orientations depending on the fluxes and off-axis angles of the sources. Typically, these regions have major axes of ∼18 arcsec and minor axes of ∼10 arcsec. Background spectra were extracted from annular regions, of 2.5 arcmin outer radius, centred on the source, and with all significant X-ray sources excised. Response matrices and the appropriate effective area files were computed using the sas tasks rmfgen and arfgen, respectively. For each source the EPIC spectra were combined to form a single spectrum using the method of Page, Davis & Salvi (2003a). Source spectra were grouped using the heasoft tool grppha to ensure the minimum number of counts per bin given in Table 3 (usually 20) before fitting.
XMM–Newton observations used to construct the X-ray spectra.
| Source | XMM–Newton observation IDs | ||
| XMM J005601.36−012407.4 | 0012440101 | ||
| XMM J005609.41−012641.7 | 0012440101 | ||
| XMM J021908.37−044731.4 | 0112370401 | 0112371501 | 0112370301 |
| XMM J021939.22−051133.7 | 0112370301 | ||
| XMM J022322.12−045738.1 | 0109520501 | ||
| XMM J080625.35+244326.0 | 0094530401 | ||
| XMM J083139.11+524206.2 | 0092800201 | 0092800101 | |
| XMM J090524.00+621114.2 | 0110661701 | 0110660201 | |
| XMM J094239.79+465005.3 | 0106460101 | ||
| XMM J094454.24−083953.6 | 0017540101 | ||
| XMM J094527.16−083309.4 | 0017540101 | ||
| XMM J095231.84−015016.1 | 0065790101 | ||
| XMM J095539.24+411727.3 | 0111290201 | ||
| XMM J104441.90−012655.3 | 0125300101 | ||
| XMM J104444.50−013313.5 | 0125300101 | ||
| XMM J105014.58+325041.5 | 0055990201 | ||
| XMM J105743.59−033402.4 | 0094800101 | ||
| XMM J111825.42+073448.3 | 0082340101 | ||
| XMM J115233.75+371156.3 | 0112551401 | ||
| XMM J121312.04+024929.8 | 0081340801 | ||
| XMM J122656.53+013125.2 | 0110990201 | ||
| XMM J125701.68+281230.2 | 0124710701 | 0124712101 | |
| XMM J130129.08+274037.1 | 0124710801 | ||
| XMM J130458.98+175451.8 | 0017940101 | ||
| XMM J130529.89−102141.5 | 0032141201 | ||
| XMM J133026.09+241356.7 | 0100240101 | 0100240201 | |
| XMM J133623.04+241738.6 | 0096010101 | ||
| XMM J133913.92−314421.9 | 0035940301 | ||
| XMM J134656.75+580316.5 | 0112250201 | ||
| XMM J140057.10−110120.6 | 0109910101 | ||
| XMM J140145.11+025334.6 | 0098010101 | ||
| XMM J140149.53−111647.8 | 0109910101 | ||
| XMM J141634.78+113329.2 | 0112250301 | 0112251301 | |
| XMM J145048.99+191431.2 | 0056030101 | ||
| XMM J150339.60+101605.6 | 0112910101 | 0070740101 | 0070740301 |
| XMM J150558.42+014104.2 | 0021540101 | ||
| XMM J151650.30+070907.3 | 0109920301 | 0109920101 | |
| XMM J152146.64+073113.9 | 0109930101 | ||
| XMM J152254.63+074534.5 | 0109930101 | ||
| XMM J161646.54+122015.1 | 0103460901 | 0103460801 | |
| XMM J161736.21+122901.5 | 0103461001 | 0103460901 | |
| XMM J161818.95+124110.3 | 0103461001 | ||
Absorbed power-law fits to the XMM–Newton spectra with fixed photon index Γ= 1.9. The column labelled ‘Counts min/bin’ indicates the minimum number of counts per bin used when constructing the spectrum. A is the power-law normalization in units of 10−5 photons cm−2 s−1 keV−1. The ‘Prob’ column gives the null hypothesis probability corresponding to χ2/ν. Confidence limits are given at 95 per cent for one interesting parameter (Δχ2= 4); confidence limits that are truncated by the allowed fit range of the parameter, rather than by Δχ2= 4 are labelled with ‘*’. The final column gives the 95 per cent upper limit on the ratio of a second, unabsorbed power law to the primary absorbed power law for those sources which are well fitted by the single absorbed power-law model, as described in Section 5.3.
| Source | Counts min/bin | A | log NH (cm−2) | χ2/ν | Prob | 95 per cent upper limit A2/A1 |
| XMM J005601.36−012407.4 | 30 | 1.7+0.4−0.3 | 22.1+0.2−0.2 | 13/13 | 0.43 | 0.12 |
| XMM J005609.41−012641.7 | 20 | 2.3+0.9−0.8 | 22.7+0.2−0.2 | 5/9 | 0.85 | 0.05 |
| XMM J021908.37−044731.4 | 20 | 2.2+0.4−0.4 | 22.0+0.1−0.2 | 38/14 | 6.1 × 10⁻⁴ | – |
| XMM J021939.22−051133.7 | 20 | 3.7+1.1−1.0 | 22.8+0.2−0.2 | 23/9 | 7.1 × 10⁻³ | – |
| XMM J022322.12−045738.1 | 20 | 1.9+0.6−0.5 | 23.1+0.2−0.2 | 4/4 | 0.39 | 0.02 |
| XMM J080625.35+244326.0 | 15 | 1.4+0.8−0.8 | 21.9+0.5−21.9* | 16/5 | 7.2 × 10⁻³ | – |
| XMM J083139.11+524206.2 | 20 | 7.0+1.3−1.1 | 23.3+0.1−0.1 | 149/38 | 6.7 × 10⁻¹⁵ | – |
| XMM J090524.00+621114.2 | 5 | 1.3+1.2−0.8 | 22.3+0.6−0.5 | 7/5 | 0.25 | 0.16 |
| XMM J094239.79+465005.3 | 20 | 1.2+0.4−0.4 | 22.3+0.3−0.3 | 27/10 | 2.3 × 10⁻³ | – |
| XMM J094454.24−083953.6 | 10 | 1.3+0.7−0.6 | 22.3+0.4−0.4 | 2/2 | 0.33 | 0.22 |
| XMM J094527.16−083309.4 | 10 | 4.8+6.6−3.4 | 23.3+0.4−0.7 | 3/2 | 0.23 | 0.07 |
| XMM J095231.84−015016.1 | 20 | 2.2+0.7−0.6 | 21.9+0.2−0.3 | 1/3 | 0.76 | 0.26 |
| XMM J095539.24+411727.3 | 10 | 3.6+3.7−2.0 | 22.8+0.5−0.4 | 3/4 | 0.56 | 0.08 |
| XMM J104441.90−012655.3 | 20 | 1.7+0.3−0.3 | 22.3+0.1−0.1 | 17/14 | 0.28 | 0.03 |
| XMM J104444.50−013313.5 | 20 | 2.2+0.6−0.5 | 22.0+0.2−0.2 | 18/13 | 0.17 | 0.13 |
| XMM J105014.58+325041.5 | 20 | 1.7+0.5−0.5 | 22.3+0.2−0.2 | 1/4 | 0.95 | 0.07 |
| XMM J105743.59−033402.4 | 20 | 1.1+0.6−0.4 | 22.5+0.3−0.3 | 12/4 | 1.6 × 10⁻² | 0.44 |
| XMM J111825.42+073448.3 | 20 | 1.2+0.4−0.3 | 22.6+0.2−0.2 | 22/13 | 6.0 × 10⁻² | 0.14 |
| XMM J115233.75+371156.3 | 5 | 5.1+4.4−3.2 | 22.4+0.5−0.5 | 1/2 | 0.75 | 0.27 |
| XMM J121312.04+024929.8 | 20 | 1.3+0.7−0.5 | 22.5+0.3−0.3 | 10/4 | 3.7 × 10⁻² | 0.16 |
| XMM J122656.53+013125.2 | 20 | 5.8+0.9−0.8 | 22.4+0.1−0.1 | 37/17 | 5.6 × 10⁻³ | – |
| XMM J125701.68+281230.2 | 20 | 3.4+1.0−0.9 | 22.8+0.2−0.2 | 17/11 | 0.11 | 0.05 |
| XMM J130129.08+274037.1 | 20 | 1.0+0.4−0.3 | 22.7+0.2−0.2 | 5/5 | 0.44 | 0.06 |
| XMM J130458.98+175451.8 | 20 | 2.1+0.8−0.7 | 22.6+0.2−0.2 | 12/9 | 0.21 | 0.03 |
| XMM J130529.89−102141.5 | 5 | 1.1+1.0−0.6 | 22.7+0.5−0.4 | 3/5 | 0.69 | 0.08 |
| XMM J133026.09+241356.7 | 20 | 2.8+0.5−0.4 | 22.5+0.1−0.1 | 117/34 | 5.6 × 10⁻¹¹ | – |
| XMM J133623.04+241738.6 | 15 | 3.6+2.1−1.8 | 22.4+0.3−0.5 | 7/3 | 8.4 × 10⁻² | 0.24 |
| XMM J133913.92−314421.9 | 20 | 1.6+0.4−0.4 | 22.3+0.2−0.2 | 10/9 | 0.38 | 0.13 |
| XMM J134656.75+580316.5 | 20 | 6.1+1.9−1.5 | 22.9+0.2−0.2 | 20/11 | 4.5 × 10⁻² | 0.02 |
| XMM J140057.10−110120.6 | 20 | 1.8+0.5−0.5 | 22.4+0.2−0.2 | 11/11 | 0.46 | 0.05 |
| XMM J140145.11+025334.6 | 10 | 1.4+0.7−0.6 | 22.0+0.4−0.5 | 3/6 | 0.81 | 0.38 |
| XMM J140149.53−111647.8 | 20 | 1.3+0.3−0.3 | 22.4+0.2−0.2 | 12/13 | 0.51 | 0.07 |
| XMM J141634.78+113329.2 | 20 | 2.1+0.4−0.4 | 22.3+0.1−0.1 | 23/17 | 0.16 | 0.18 |
| XMM J145048.99+191431.2 | 20 | 1.4+0.3−0.3 | 22.6+0.1−0.1 | 7/10 | 0.72 | 0.11 |
| XMM J150339.60+101605.6 | 20 | 7.1+2.1−1.7 | 22.8+0.2−0.1 | 47/13 | 1.0 × 10⁻⁵ | – |
| XMM J150558.42+014104.2 | 25 | 3.1+1.0−0.9 | 22.4+0.2−0.2 | 7/5 | 0.23 | 0.06 |
| XMM J151650.30+070907.3 | 20 | 0.8+0.3−0.2 | 22.3+0.3−0.3 | 11/12 | 0.53 | 0.22 |
| XMM J152146.64+073113.9 | 20 | 3.9+0.6−0.6 | 22.3+0.1−0.1 | 29/29 | 0.48 | 0.07 |
| XMM J152254.63+074534.5 | 20 | 0.8+0.9−0.5 | 22.8+0.6−0.5 | 4/2 | 0.15 | 0.05 |
| XMM J161646.54+122015.1 | 20 | 1.9+0.4−0.4 | 22.2+0.2−0.1 | 12/10 | 0.32 | 0.17 |
| XMM J161736.21+122901.5 | 20 | 1.7+0.7−0.5 | 22.0+0.3−0.3 | 29/10 | 1.3 × 10⁻³ | – |
| XMM J161818.95+124110.3 | 20 | 3.5+1.8−1.5 | 22.8+0.3−0.3 | 4/2 | 0.12 | 0.15 |
5 RESULTS
5.1 Optical spectra
The optical spectra are shown in Fig. 3, and the identifications, redshifts and emission-line characteristics are given in Table 2. The distribution of offsets between the X-ray sources and optical counterparts is similar to those found in other XMM–Newton surveys of similar depth (e.g. Barcons et al. 2002; Fiore et al 2003), with 90 per cent of optical counterparts lying within 3 arcsec of the X-ray source. Note that two of the sources, XMM J122656.53+013125.2 and XMM J134656.75+580316.65 are also members of the XMM–Newton Bright Serendipitous Survey and are also reported in Della Ceca et al. (2004), while one of the sources, XMM J021939.22−051133.7, is also a member of the XMM–Newton Medium Sensitivity Survey and is also reported in Barcons et al. (2007). We have split the objects into four categories. Objects which have any permitted emission lines with measured full width at half-maximum (FWHM)4 >1000 km s−1 have been classified as BLAGN; this class includes QSOs and type 1 Seyfert galaxies. Galaxies which only show emission lines with an FWHM < 1000 km s−1 have been classified as narrow emission-line galaxies (NELGs). Galaxies in which we do not detect any emission lines have been classified simply as ‘galaxies’. Finally, one object has the spectrum of a Galactic star.
The X-ray sources and optical counterparts. X-ray fluxes are for the 2–4.5 keV band, in units of 10−14 erg cm−2 s−1. The column labelled ‘r’ gives the r magnitude from our Isaac Newton Telescope Wide Field Camera images, except for those sources marked with an ‘*’, in which case the magnitude is UK Schmidt R (for southern fields) or POSS-II R (for northern fields). The ‘cam’ column gives the EPIC camera from which the source was selected. The column labelled ‘o−x’ gives the offset between the X-ray and optical positions in arcseconds.
| Source | Flux (2–4.5) | HR2 | cam | Galactic NH (1020 cm−2) | Optical position (J2000) | o−x (arcsec) | r | Type | z | |
| RA | Dec. | |||||||||
| XMM J005601.36−012407.4 | 2.4 | −0.04 ± 0.10 | PN | 3.24 | 00 56 01.46 | −01 24 05.0 | 2.8 | 21.0* | NELG | 0.463 |
| XMM J005609.41−012641.7 | 2.4 | 0.58 ± 0.15 | PN | 3.29 | 00 56 09.56 | −01 26 41.7 | 2.2 | 17.7* | NELG | 0.148 |
| XMM J021908.37−044731.4 | 5.4 | 0.04 ± 0.10 | M2 | 2.55 | 02 19 08.38 | −04 47 30.7 | 0.7 | 19.7 | NELG | 0.279 |
| XMM J021939.22−051133.7 | 1.8 | 0.26 ± 0.15 | PN | 2.59 | 02 19 39.08 | −05 11 33.4 | 2.1 | 17.7 | NELG | 0.151 |
| XMM J022322.12−045738.1 | 1.9 | 0.60 ± 0.10 | PN | 2.63 | 02 23 21.95 | −04 57 38.9 | 2.7 | 20.7* | NELG | 0.780 |
| XMM J080625.35+244326.0 | 5.8 | 0.13 ± 0.19 | M1 | 3.94 | 08 06 25.33 | +24 43 24.1 | 1.9 | 20.0 | BLAGN | 0.608 |
| XMM J083139.11+524206.2 | 1.2 | 0.02 ± 0.14 | PN | 3.84 | 08 31 39.08 | +52 42 05.8 | 0.5 | 17.4 | NELG | 0.059 |
| XMM J090524.00+621114.2 | 4.0 | 0.43 ± 0.16 | M2 | 4.47 | 09 05 23.75 | +62 11 09.3 | 5.2 | 18.2* | NELG | 0.175 |
| XMM J094239.79+465005.3 | 3.5 | 0.24 ± 0.11 | M1 | 1.25 | 09 42 39.99 | +46 50 04.9 | 2.1 | 20.3 | NELG | 0.284 |
| XMM J094454.24−083953.6 | 3.3 | 0.18 ± 0.16 | M1 | 3.60 | 09 44 54.02 | −08 39 52.8 | 3.4 | 20.3* | NELG | 0.362 |
| XMM J094527.16−083309.4 | 1.7 | 0.49 ± 0.21 | PN | 3.58 | 09 45 27.18 | −08 33 08.1 | 1.3 | 18.7* | NELG | 0.369 |
| XMM J095231.84−015016.1 | 5.2 | −0.08 ± 0.10 | PN | 3.96 | 09 52 31.79 | −01 50 13.9 | 2.3 | 18.7* | Galaxy | 0.316 |
| XMM J095539.24+411727.3 | 2.8 | 0.06 ± 0.21 | PN | 1.16 | 09 55 39.38 | +41 17 29.6 | 2.8 | 19.1* | NELG | 0.249 |
| XMM J104441.90−012655.3 | 1.9 | 0.05 ± 0.07 | PN | 4.18 | 10 44 41.88 | −01 26 56.2 | 1.0 | 19.1* | NELG | 0.160 |
| XMM J104444.50−013313.5 | 2.0 | −0.01 ± 0.09 | PN | 4.19 | 10 44 44.48 | −01 33 10.6 | 2.9 | 18.3* | M star | 0.000 |
| XMM J105014.58+325041.5 | 1.8 | −0.13 ± 0.14 | PN | 2.00 | 10 50 14.58 | +32 50 42.6 | 1.1 | 20.0 | NELG | 0.309 |
| XMM J105743.59−033402.4 | 2.0 | 0.18 ± 0.14 | PN | 3.59 | 10 57 43.68 | −03 34 02.0 | 1.4 | 19.0 | BLAGN | 0.567 |
| XMM J111825.42+073448.3 | 1.3 | 0.22 ± 0.11 | PN | 3.75 | 11 18 25.25 | +07 34 48.8 | 2.6 | 20.3 | BLAGN | 0.466 |
| XMM J115233.75+371156.3 | 9.2 | 0.07 ± 0.13 | M1 | 1.88 | 11 52 33.80 | +37 11 56.5 | 0.6 | 19.1* | NELG | 0.411 |
| XMM J121312.04+024929.8 | 2.1 | 0.42 ± 0.34 | PN | 1.79 | 12 13 12.17 | +02 49 25.9 | 4.4 | 18.8* | NELG | 0.216 |
| XMM J122656.53+013125.2 | 7.5 | −0.23 ± 0.06 | PN | 1.84 | 12 26 56.46 | +01 31 24.6 | 1.2 | 19.6* | BLAGN | 0.732 |
| XMM J125701.68+281230.2 | 3.3 | 0.12 ± 0.12 | PN | 0.91 | 12 57 01.72 | +28 12 30.2 | 0.5 | 18.8* | BLAGN | 0.305 |
| XMM J130129.08+274037.1 | 2.4 | 0.38 ± 0.15 | M1 | 0.94 | 13 01 29.17 | +27 40 37.3 | 1.2 | 19.7* | NELG | 0.462 |
| XMM J130458.98+175451.8 | 2.8 | 0.66 ± 0.18 | M1 | 2.15 | 13 04 59.01 | +17 54 54.4 | 2.6 | 16.3 | NELG | 0.034 |
| XMM J130529.89−102141.5 | 1.4 | 0.39 ± 0.14 | PN | 3.32 | 13 05 29.89 | −10 21 42.3 | 0.8 | 19.3* | NELG | 0.366 |
| XMM J133026.09+241356.7 | 2.5 | 0.04 ± 0.08 | PN | 1.16 | 13 30 26.05 | +24 13 56.1 | 0.8 | 18.7* | NELG | 0.166 |
| XMM J133623.04+241738.6 | 4.1 | 0.12 ± 0.12 | M2 | 1.17 | 13 36 22.90 | +24 17 36.5 | 2.8 | 20.1 | NELG | 0.341 |
| XMM J133913.92−314421.9 | 2.3 | 0.01 ± 0.12 | M1 | 3.85 | 13 39 13.94 | −31 44 22.4 | 0.6 | 19.4* | Galaxy | 0.378 |
| XMM J134656.75+580316.5 | 3.4 | 0.47 ± 0.10 | PN | 1.27 | 13 46 56.75 | +58 03 15.7 | 0.8 | 20.0 | Galaxy | 0.373 |
| XMM J140057.10−110120.6 | 2.9 | −0.12 ± 0.11 | M2 | 4.12 | 14 00 57.09 | −11 01 21.2 | 0.6 | 18.0* | BLAGN | 0.257 |
| XMM J140145.11+025334.6 | 2.2 | −0.21 ± 0.09 | PN | 2.33 | 14 01 45.02 | +02 53 33.1 | 2.0 | 18.0* | NELG | 0.242 |
| XMM J140149.53−111647.8 | 1.9 | 0.20 ± 0.12 | PN | 4.54 | 14 01 49.52 | −11 16 48.4 | 0.6 | 19.8 | NELG | 0.248 |
| XMM J141634.78+113329.2 | 3.9 | 0.08 ± 0.11 | PN | 1.82 | 14 16 34.82 | +11 33 31.5 | 2.4 | 20.8 | NELG | 0.519 |
| XMM J145048.99+191431.2 | 3.9 | 0.02 ± 0.10 | M2 | 2.48 | 14 50 48.98 | +19 14 30.9 | 0.3 | 18.1* | BLAGN | 0.774 |
| XMM J150339.60+101605.6 | 9.7 | 0.63 ± 0.10 | M1 | 2.32 | 15 03 39.50 | +10 16 03.0 | 3.0 | 16.9* | NELG | 0.088 |
| XMM J150558.42+014104.2 | 3.4 | 0.16 ± 0.08 | PN | 4.26 | 15 05 58.38 | +01 41 04.3 | 0.6 | 19.2 | NELG | 0.237 |
| XMM J151650.30+070907.3 | 3.1 | 0.07 ± 0.14 | M1 | 2.68 | 15 16 50.37 | +07 09 04.3 | 3.2 | 20.5* | NELG | 0.674 |
| XMM J152146.64+073113.9 | 4.2 | −0.16 ± 0.06 | PN | 3.05 | 15 21 46.68 | +07 31 13.4 | 0.8 | 19.9 | NELG | 0.429 |
| XMM J152254.63+074534.5 | 1.1 | −0.06 ± 0.20 | PN | 3.12 | 15 22 54.63 | +07 45 33.4 | 1.1 | 19.4* | NELG | 0.400 |
| XMM J161646.54+122015.1 | 2.3 | −0.09 ± 0.14 | PN | 4.57 | 16 16 46.37 | +12 20 17.6 | 3.5 | 19.1* | NELG | 0.256 |
| XMM J161736.21+122901.5 | 3.3 | 0.09 ± 0.18 | PN | 4.59 | 16 17 36.25 | +12 29 03.3 | 1.9 | 15.7* | NELG | 0.030 |
| XMM J161818.95+124110.3 | 3.3 | 0.43 ± 0.28 | M2 | 4.56 | 16 18 19.00 | +12 41 11.6 | 1.5 | 18.3* | NELG | 0.191 |
As can be seen in Fig. 3 and Table 2, the sources all have z < 0.8, and majority (31/42) of the sources are classified as NELGs. In all the NELGs we observe at least one of Hα, [O iii] 4954 Å/5007 Å or [O ii] 3727 Å. The three objects classified as galaxies have 0.3 < z < 0.4, similar to the mean redshift for the NELGs, 〈z〉= 0.29 ± 0.03, so their galaxy classification is not due to these emission lines being redshifted outside the observed spectral window. The seven BLAGN, however, have a higher mean redshift than either the NELGs or galaxies, 〈z〉= 0.53 ± 0.08. More than half of the BLAGN are identified by a broad Mg ii 2798 Å line.
Two sources (XMM J122656.53+013125.2 and XMM J140057.10−110120.6) have emission lines with 1000 < FWHM < 2000 km s−1, and therefore might conceivably be narrow-line Seyfert 1 galaxies (Osterbrock & Pogge 1985). In XMM J122656.53+013125.2 the Mg ii line has a measured FWHM of 1600 km s−1, and the other lines all have FWHM < 1000 km s−1. However, the large ratio of [O iii]/Hβ rules out a narrow-line Seyfert 1 galaxy (Shuder & Osterbrock 1981), and suggests instead that the broad-line region is heavily reddened. The Mg ii profile could be a composite of emission from the narrow-line region and a reddened line from the broad-line region. For XMM J140057.10−110120.6 only one emission line is detected (Hα) with a measured FWHM of 1900 km s−1. The red, galaxy-dominated continuum leads us to suspect that the nucleus and broad-line region are also reddened in this object, and that the Hα line profile is likely to be a composite of emission from the narrow-line region and a reddened broad line.
5.2 Basic X-ray spectral modelling
The X-ray spectra are shown in Fig. 5. As a starting point for the spectral modelling we considered an absorbed power-law model, corresponding to an AGN viewed through a screen of cold material. For each object we included a zero-redshift absorber with NH fixed at the Galactic value found from 21-cm observations (Dickey & Lockman 1990) and a cold absorber at the redshift of the source with NH as a free parameter in the fit. In fits of this type, particularly in low–moderate signal-to-noise ratio data, the power-law photon index Γ and absorbing column density NH are somewhat degenerate, and this can lead to large, highly coupled uncertainties on both parameters. Therefore we began our spectral fitting with Γ fixed at a value of 1.9, which is the mean slope found for unobscured BLAGN in XMM–Newton surveys (Mainieri et al. 2002; Piconcelli et al. 2002; Caccianiga et al. 2004; Mateos et al. 2005a; Page et al. 2006b).


X-ray spectra of the sources (data points) together with absorbed Γ= 1.9 power-law models (black stepped lines). Both model and data have been divided by the effective area as a function of energy, and the spectra are displayed as E×FE so that an unabsorbed power law with Γ= 2 would be a horizontal line. When the absorbed Γ= 1.9 power-law model does not provide an acceptable fit to the data, the best alternative model is shown in grey. For XMM J021908.37−044731.4, XMM J021939.22−051133.7 and XMM J094239.79+465005.3 the grey model includes a mekal component, for XMM J083139.11+524206.2, XMM J133026.09+241356.7, XMM J150339.60+101605.6 and XMM J161736.21+122901.5 the grey model includes an unabsorbed power-law component, for XMM J080625.35+244326.0 the grey model has an ionized absorber, and for XMM J122656.53+013125.2 the grey model has a power-law index of Γ= 1.5.
The results of these fits are given in Table 3; the uncertainties listed in Table 3 and all subsequent tables are 95 per cent for one interesting parameter (Δχ2= 4). We consider a null hypothesis probability of 1 per cent to be an appropriate threshold for rejection of the spectral model, because at this level, and for our sample size, we expect less than one rejection by chance if the form of the model is correct. Of the 42 sources, 33 are therefore acceptably fitted with this model, while nine objects (∼20 per cent) are not acceptably fitted. In seven of the nine cases, the poor χ2 is due to an excess of flux in the lowest energy channels with respect to the model (see Fig. 5).
5.3 Modelling the nine sources with complex X-ray spectra
We now examine in more detail the X-ray spectra of the nine sources which were not well fitted with a Γ= 1.9 power law and neutral absorption. Before considering spectral models with an additional soft X-ray component, we investigate the possibility that the poor χ2 could be a consequence of our decision to fix Γ= 1.9 in the power-law component. There is certainly a range of photon indices in the unabsorbed AGN population (Mateos et al. 2005a,b; Page et al. 2006b), and the fit with fixed Γ could result in significant residuals for AGN which are outliers in this distribution. Therefore, for the nine objects which had unacceptable χ2/ν, we refit the spectra, this time allowing the photon index of the power law to vary as a fit parameter. The results of these fits are shown in Table 4. Four of the objects are acceptably fitted with this model, but only one of these, XMM J122656.53+013125.2, has a value of Γ consistent with a ‘normal’ AGN spectrum. The other three objects (XMM J161736.21+122901.5, XMM J094239.79+465005.3 and XMM J080625.35+244326.0) for which this fit yields a reasonable χ2/ν have best-fitting photon indices which are exceedingly hard, Γ < 1.2. Such photon indices are well outside the range of photon indices normally observed in unabsorbed AGN (>3.5σ outliers from the distribution, Mateos et al. 2005a), and therefore we consider that the variation in AGN photon indices only provides a plausible explanation for the poor fit of the absorbed Γ= 1.9 power-law model to the X-ray spectrum of XMM J122656.53+013125.2.
Absorbed power-law fits to the XMM–Newton spectra with photon index Γ free to vary. A is the power-law normalization in units of 10−5 photons cm−2 s−1 keV−1. The ‘Prob’ column gives the null hypothesis probability corresponding to χ2/ν. Confidence limits are given at 95 per cent for one interesting parameter (Δχ2= 4); confidence limits that are truncated by the allowed fit range of the parameter, rather than by Δχ2= 4 are labelled with ‘*’.
| Source | Γ | A | log NH (cm−2) | χ2/ν | Prob |
| XMM J021908.37−044731.4 | 1.5+0.5−0.6 | 1.3+1.1−0.8 | 21.7+0.3−21.7* | 35/13 | 1.0 × 10⁻³ |
| XMM J021939.22−051133.7 | 1.4+1.3−0.9* | 1.7+11.7−1.3 | 22.7+0.3−0.4 | 22/8 | 5.1 × 10⁻³ |
| XMM J080625.35+244326.0 | 1.1+0.5−0.3 | 0.64+0.32−0.15 | 0.00+21.5−0.0* | 8/4 | 0.10 |
| XMM J083139.11+524206.2 | 1.7+0.8−0.7 | 4.3+15.9−3.2 | 23.2+0.2−0.2 | 148/37 | 3.9 × 10⁻¹⁵ |
| XMM J094239.79+465005.3 | 1.0+0.4−0.3 | 0.35+0.26−0.13 | 21.5+0.5−0.6 | 17/9 | 5.8 × 10⁻² |
| XMM J122656.53+013125.2 | 1.5+0.3−0.4 | 3.6+1.8−1.2 | 22.3+0.2−0.2 | 31/16 | 1.4 × 10⁻² |
| XMM J133026.09+241356.7 | 0.5+0.2−0.0* | 0.31+0.05−0.04 | 0.0+20.8−0.0* | 74/33 | 6.0 × 10⁻⁵ |
| XMM J150339.60+101605.6 | 0.5+0.5−0.0* | 0.55+0.78−0.09 | 21.8+0.6−0.4 | 35/12 | 4.6 × 10⁻⁴ |
| XMM J161736.21+122901.5 | 0.5+0.4−0.0* | 0.29+0.23−0.04 | 0.0+21.5−0.0* | 5/9 | 0.85 |
For the nine objects not well fitted in Section 5.2, we now consider a model of photoelectric absorption in which the absorber is ionized, rather than cold, as ionized absorption is often observed in nearby Seyfert 1 galaxies (e.g. Reynolds 1997; George et al. 1998; Blustin et al. 2005). For this we use the ‘absori’ model in xspec, in which the ionization state of the absorber is defined by the ionization parameter ξ=L/nr2, where L is the ionizing luminosity of the source, n is the number density of the absorber and r is the distance of the absorber from the ionizing radiation. The photon index of the power law was fixed at Γ= 1.9, and the temperature of the absorber was fixed at 3 × 10⁴ K (the fits are not sensitive to this parameter). The results are given in Table 5. This model produces acceptable χ2/ν for 4/9 of the sources, but does not give acceptable fits for the other five objects.
Fits to the XMM–Newton spectra with a power law of Γ= 1.9 passing through an ionized medium. A is the power-law normalization in units of 10−5 photons cm−2 s−1 keV−1. The ionization parameter ξ is in units of erg cm s−1. Confidence limits are given at 95 per cent for one interesting parameter (Δχ2= 4); confidence limits that are truncated by the allowed fit range of the parameter, rather than by Δχ2= 4 are labelled with ‘*’. The ‘Prob’ column gives the null hypothesis probability corresponding to χ2/ν.
| Source | A | log NH (cm−2) | log ξ | χ2/ν | Prob |
| XMM J021908.37−044731.4 | 2.4+0.4−0.4 | 22.2+0.1−0.2 | 0.8+0.3−0.5 | 11/13 | 0.59 |
| XMM J021939.22−051133.7 | 3.8+1.1−1.0 | 23.0+0.2−0.2 | 1.4+0.2−0.2 | 13/8 | 0.11 |
| XMM J080625.35+244326.0 | 2.0+0.8−0.7 | 22.9+0.4−0.5 | 2.4+0.5−0.7 | 1/4 | 0.97 |
| XMM J083139.11+524206.2 | 6.7+1.2−1.1 | 23.4+0.1−0.1 | 1.6+0.1−0.1 | 128/37 | 6.6 × 10⁻¹² |
| XMM J094239.79+465005.3 | 1.2+0.4−0.4 | 22.4+0.2−0.3 | 0.2+0.8−2.2* | 25/9 | 2.7 × 10⁻³ |
| XMM J122656.53+013125.2 | 5.8+1.0−0.8 | 22.5+0.2−0.1 | −1.2+2.4−0.8 | 37/16 | 2.4 × 10⁻³ |
| XMM J133026.09+241356.7 | 2.7+0.4−0.4 | 22.6+0.1−0.1 | 1.0+0.1−0.2 | 82/33 | 4.9 × 10⁻⁶ |
| XMM J150339.60+101605.6 | 7.3+2.0−1.7 | 23.0+0.1−0.2 | 1.3+0.2−0.3 | 40/12 | 8.8 × 10⁻⁵ |
| XMM J161736.21+122901.5 | 1.9+0.6−0.5 | 22.3+0.2−0.2 | 0.6+0.5−0.9 | 19/9 | 2.8 × 10⁻² |
Next, we considered two different models that contain an additional component, which is bright at the soft X-ray end of the spectrum. To minimize the number of free parameters in the fit, we maintain a fixed Γ= 1.9 for the primary power-law component in these fits.
In the first model, we include a second power law with Γ= 1.9, but which is not attenuated by the column of cold gas intrinsic to the object, and represents a component of the primary emission which is scattered into our line of sight, bypassing the absorber. The photon indices of both power laws were frozen at a value of 1.9 in this model. Although such a model is lacking in experimental verification from observations of nearby AGN, it has a long heritage (e.g. Holt et al. 1980; Turner et al. 1997; Franceschini et al. 2003; Caccianiga et al. 2004), and its functional form provides a simple and convenient parametrization of the relative contributions of the primary, absorbed component and the component which provides the excess flux at soft energies. The results of fitting this model are listed in Table 6. All but two objects are fitted acceptably using this model. We have also used this model to determine 95 per cent upper limits for the contribution of any soft component in the sources which are acceptably fitted with a simple absorbed power-law model, by increasing the contribution of the unabsorbed power law until Δχ2= 4 with respect to the model without the unabsorbed power law; these upper limits are included in Table 3.
Two component fits to the XMM–Newton spectra consisting of two power laws, of which one is absorbed by cold material, and the other is not. A1 is the normalization of the absorbed power law and A2 is the normalization of the unabsorbed component, in units of 10−5 photons cm−2 s−1 keV−1. Both power laws have fixed Γ= 1.9. Confidence limits are given at 95 per cent for one interesting parameter (Δχ2= 4); confidence limits that are truncated by the allowed fit range of the parameter, rather than by Δχ2= 4 are labelled with ‘*’. The ‘Prob’ column gives the null hypothesis probability corresponding to χ2/ν.
| Source | A1 | A2 | log NH (cm−2) | χ2/ν | Prob |
| XMM J021908.37−044731.4 | 2.2+0.5−0.5 | 0.32+0.12−0.13 | 22.3+0.2−0.2 | 16/13 | 0.27 |
| XMM J021939.22−051133.7 | 4.1+1.3−1.1 | 0.11+0.05−0.05 | 22.9+0.3−0.3 | 7/8 | 0.54 |
| XMM J080625.35+244326.0 | 1.5+1.1−0.9 | 0.56+0.23−0.27 | 22.7+0.6−0.5 | 4/4 | 0.47 |
| XMM J083139.11+524206.2 | 7.6+1.4−1.3 | 0.13+0.02−0.03 | 23.4+0.1−0.1 | 39/37 | 0.38 |
| XMM J094239.79+465005.3 | 1.3+0.4−0.4 | 0.05+0.05−0.05 | 22.4+0.3−0.3 | 23/9 | 5.5 × 10⁻³ |
| XMM J122656.53+013125.2 | 5.7+0.7−0.8 | 0.00+0.09−0.00* | 22.4+0.1−0.1 | 37/16 | 2.0 × 10⁻³ |
| XMM J133026.09+241356.7 | 3.0+0.5−0.4 | 0.20+0.05−0.04 | 22.6+0.1−0.1 | 27/33 | 0.78 |
| XMM J150339.60+101605.6 | 7.9+2.2−1.9 | 0.21+0.09−0.08 | 22.9+0.1−0.1 | 22/12 | 3.7 × 10⁻² |
| XMM J161736.21+122901.5 | 2.4+1.1−0.8 | 0.23+0.09−0.10 | 22.5+0.3−0.3 | 11/9 | 0.30 |
In the second model, we include an optically thin thermal plasma component (‘mekal’ in xspec) instead of an additional power law. We do not include any attenuation of this component by the intrinsic absorber, because it is intended to represent a soft X-ray line emitting plasma which lies outside the central, obscured region of the AGN. Such a component of line emitting plasma has long been seen in Seyfert 2 galaxies (e.g. Marshall et al. 1993; Ueno et al. 1994; Turner et al. 1997; Ogle et al. 2000). Observations with the gratings onboard XMM–Newton and Chandra show that the gas is photoionized (e.g. Sako et al. 2000; Brinkman et al. 2002; Kinkhabwala et al. 2002) rather than collisionally ionized (as in the mekal model). However, the two cases are indistinguishable at the resolution and signal-to-noise ratio of our data. The fit results are given in Table 7; this model is quite successful, in that it provides an acceptable fit for six of the nine sources.
Two component fits to the XMM–Newton spectra consisting of an absorbed, Γ= 1.9 power law, and an optically thin thermal plasma. A is the power-law normalization in units of 10−5 photons cm−2 s−1 keV−1. The ‘Prob’ column gives the null hypothesis probability corresponding to χ2/ν. Confidence limits are given at 95 per cent for one interesting parameter (Δχ2= 4); confidence limits that are truncated by the allowed fit range of the parameter, rather than by Δχ2= 4 are labelled with ‘*’.
| Source | A | log NH (cm−2) | kT (keV) | χ2/ν | Prob |
| XMM J021908.37−044731.4 | 2.4+0.5−0.5 | 22.1+0.2−0.2 | 0.23+0.07−0.07 | 10/12 | 0.64 |
| XMM J021939.22−051133.7 | 3.8+1.1−1.0 | 22.8+0.2−0.2 | 0.30+0.11−0.08 | 3/7 | 0.88 |
| XMM J080625.35+244326.0 | 1.9+0.7−0.7 | 22.4+0.2−0.5 | 0.43+0.40−0.23 | 1/3 | 0.93 |
| XMM J083139.11+524206.2 | 7.2+1.2−1.2 | 23.3+0.1−0.1 | 1.00+0.00*−0.11 | 77/40 | 8.6 × 10⁻⁵ |
| XMM J094239.79+465005.3 | 1.4+0.4−0.4 | 22.5+0.1−0.2 | 1.00+0.00*−0.18 | 16/8 | 4.9 × 10⁻² |
| XMM J122656.53+013125.2 | 5.7+1.0−0.8 | 22.4+0.1−0.1 | 1.00+0.00*−0.90* | 37/15 | 1.2 × 10⁻³ |
| XMM J133026.09+241356.7 | 2.9+0.4−0.4 | 22.5+0.1−0.1 | 0.29+0.06−0.05 | 44/32 | 7.5 × 10⁻² |
| XMM J150339.60+101605.6 | 7.3+2.3−1.7 | 22.8+0.2−0.1 | 1.00+0.00*−0.21 | 27/11 | 4.0 × 10⁻³ |
| XMM J161736.21+122901.5 | 2.1+0.8−0.6 | 22.3+0.3−0.2 | 0.41+0.59−0.20 | 17/8 | 2.9 × 10⁻² |
6 DISCUSSION
6.1 Optical identifications of the hard-spectrum sources
The hardness ratio selection has produced a sample with considerably different optical properties to the general X-ray population at S0.5–4.5 > 10−14 erg cm−2 s−1. Of our sample of 42 objects, 31 are identified as NELGs, compared to <20 per cent of the overall X-ray population at this flux level (Barcons et al. 2003b). This is as expected from AGN unification schemes, because the hardness ratio traces absorption. It is in line with the findings of several Chandra and XMM–Newton surveys that sources with large hardness ratios are predominantly narrow-line objects (e.g. Hasinger et al. 2001; Barger et al. 2002; Silverman et al. 2005) and confirms the specific findings of Della Ceca et al. (2004) and Caccianiga et al. (2004) that a large fraction of XMM–Newton sources with HR2 > −0.3 are narrow-line objects. In contrast, BLAGN, which are the majority source population in simple flux-limited surveys of equivalent depth (Barcons et al. 2003b; Fiore et al 2003), account for only seven out of 42 of our sources. These emission-line demographics are also remarkably different to those found in hard-spectrum sources selected at lower energy: in the hard-spectrum ROSAT sample of Page et al. (2001), the majority of the sources are BLAGN with only ∼20 per cent identified as NELGs. There are many examples of X-ray-absorbed AGN in the literature which appear to show far less attenuation to their broad lines than would be expected from a standard Galactic mixture of gas and dust (e.g. Akiyama et al. 2000; Loaring, Page & Ramsay 2003). However, in most cases the absorbing media responsible for hardening the X-ray spectra of the sources in our sample have successfully suppressed the AGN continuum and broad emission lines.
Only one source (XMM J104444.50−013313.5) out of 42 has an optical counterpart which is a Galactic star, compared to 11 per cent of the overall X-ray population at S0.5–4.5 > 2 × 10⁻¹⁴ erg cm−2 s−1 (Barcons et al. 2003b). In fact it is surprising that even one source in our sample should turn out to be a star, because coronally active stars have optically thin thermal spectra which peak in the range 0.7–1 keV, and thus they should be excluded from our sample by our hardness ratio selection (equation 2). This is well established empirically: almost all of the stars in the XMM–Newton Bright Serendipitous Survey have HR2 < −0.3 (Della Ceca et al. 2004). The X-ray spectrum of XMM J104444.50−013313.5 has a similar form to the rest of our sample, and is consistent with an absorbed Γ= 1.9 power-law shape. This would be highly anomalous for a Galactic star (e.g. Page et al. 2006b). Therefore we must consider the possibility that the M star is not the correct optical counterpart to XMM J104444.50−013313.5. In Fig. 6 we show a 1 × 1-arcmin2 region, centred on XMM J104444.50−013313.5, from an R-band image taken with the Wide Field Imager on the 2.2-m telescope in La Silla. A second optical counterpart is seen closer to the X-ray source position than the M star, but 2.9 mag fainter. We consider that this fainter optical source is more likely to be the correct optical counterpart than the M star, and that the proximity of the M star to the X-ray source is coincidental. If this is correct, then XMM J104444.50−013313.5 should be assigned to the optically faint subsample, rather than optically bright subsample.
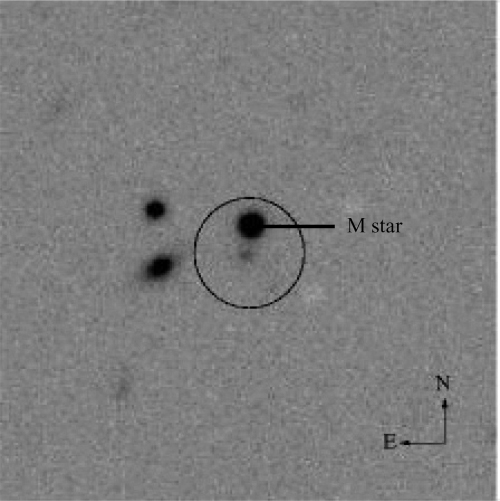
1 × 1 arcmin2R-band image of XMM J104444.50−013313.5. The black circle is a 6 arcsec radius circle centred on the X-ray source position. The brighter counterpart is the M star for which we have an optical spectrum. The fainter counterpart is closer to the centre of the circle and thus to the X-ray source position.
6.2 Redshift and luminosity distributions
For each source we have calculated the intrinsic, rest-frame 2–10 keV luminosity, based on the unabsorbed primary power-law continuum from the best-fitting spectral model, shown in Fig. 5. These luminosities are shown as a function of redshift in Fig. 7. As expected from a flux-limited sample,5 luminosity is strongly correlated with redshift: the linear correlation coefficient of log L2–10 and z is 0.84, and the probability that there is no correlation is < 10−11. The BLAGN of the sample have higher mean redshifts and luminosities (〈z〉= 0.53 ± 0.08, 〈 log L2–10〉= 43.7 ± 0.2) than the NELGs (〈z〉= 0.30 ± 0.03, 〈 log L2–10〉= 43.0 ± 0.1), but the differences are only of moderate statistical significance: according to the Kolmogorov–Smirnov test both the redshift distributions and the luminosity distributions differ between the BLAGN and NELGs with 98 per cent confidence.
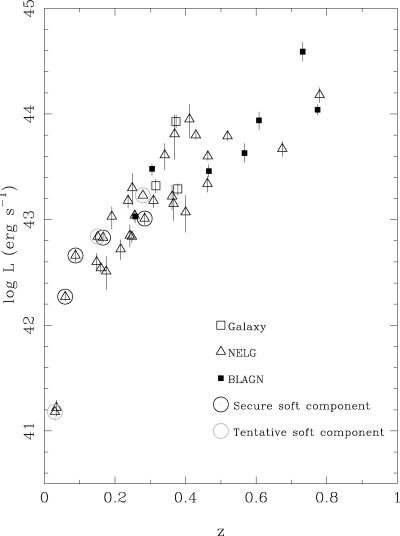
2–10 keV luminosities of the sample as a function of redshift. The luminosities have been computed for the primary power-law component in the best-fitting model for each source, and are corrected for absorption. The sources enclosed in circles are those which are best fitted with a soft component in addition to an absorbed power law. The black circles indicate sources for which the detection of a soft component is secure, while the grey circles indicate sources for which the best-fitting model includes a soft component, but for which the alternative ionized-absorber model also produces an acceptable fit (i.e. tentative detections of the soft component). Note that the most luminous source is XMM J122656.53+013125.2, which has an optical spectrum that is dominated by narrow emission lines, but is classified as a BLAGN because it has an Mg ii line with an FWHM > 1000 km s−1.
All but two of the sources have 2–10 keV luminosities in excess of 1042 erg s−1, and therefore undoubtably contain AGN. The other two objects, which have 2–10 keV luminosities of ∼ 1041 erg s−1, do not display deep Balmer absorption lines in their optical spectra, which would indicate a population of young stars. One of these two sources, XMM J161736.21+122901.5, has emission lines which classify it as a Seyfert 2, and hence is unambiguously AGN dominated. The other, XMM J130458.98+175451.8, has only a weak [O ii] 3727 Å line, and no Hα emission can be discerned, suggesting that it is not strongly star forming, and hence that its X-ray emission must also come from an obscured AGN.
Most of the objects in our sample have luminosities typical of Seyfert galaxies (1041 < L2–10 < 1044). However, the three highest redshift objects have L2–10 > 1044 erg s−1, within the luminosity range of QSOs. Two of these would be classified as ‘type 2’ QSOs according to their optical spectra: XMM J022322.12−045738.1 shows only narrow lines, and XMM J122656.53+013125.2 is dominated by narrow lines (although the FWHM of Mg ii exceeds 1000 km s−1, leading to a BLAGN classification according to our scheme). The other, XMM J080625.35+244326.0, shows little evidence for optical obscuration, exhibiting a strong UV continuum and broad emission lines (Fig. 3).
All of the sources in our sample have been imaged at 1.4 GHz by the Very Large Array surveys FIRST (Becker, White & Helfand 1995) or NVSS (Condon et al. 1998). Only two of our X-ray sources have radio counterparts with 1.4-GHz flux density > 2.5 mJy: XMM J150339.60+101605.6 with a flux density of 113 mJy and XMM J104444.50−013313.5 with a flux density of 4.3 mJy. The position of the radio counterpart to XMM J104444.50−013313.5 is consistent with the faint counterpart near the centre of the error circle, rather than the M star that we observed with the WHT. The small rate of radio detections implies that the sample is almost completely dominated by radio-quiet objects.
6.3 X-ray spectral characteristics
The spectral fits show that the basic hypothesis that the sources have spectra similar to normal, unobscured AGN, attenuated by large columns of cold absorbing material, is adequate for most of the sources. The underlying continua are in almost all cases consistent with a typical AGN power law of Γ= 1.9. Only one object appears to require a different spectral index: for XMM J122656.53+013125.2 the only model that produces an acceptable fit to the X-ray spectrum has Γ= 1.5 ± 0.3. In four of the remaining eight cases for which the basic Γ= 1.9 power law and cold absorber are rejected, an ionized absorber provides an acceptable fit to the X-ray spectrum. However, in only one case does the ionized absorber provide the highest null hypothesis probability (i.e. best fit) of all the models tried: XMM J080625.35+244326.0, which is also the only BLAGN in the sample for which the simple power law and cold absorber model fails. Its intrinsic luminosity (L2–10∼ 1044 erg s−1) is similar to that of the archetypal warm-absorber Seyfert 1 H0557−385 (Ashton et al. 2006), suggesting that this is a plausible model. It is interesting to note that in their study of 41 serendipitous XMM–Newton sources, Piconcelli et al. (2002) found evidence for an ionized absorber in only one source, XMMU J140127.7+025603, which is also a BLAGN. Furthermore, in a study of the 13H Deep Field, Page et al. (2006b) found that at least one of the X-ray-absorbed BLAGN (source 101) has an ionized absorber. Unfortunately XMM J080625.35+244326.0 has one of the poorest signal-to-noise ratio X-ray spectra in our sample, and the models incorporating an additional component of soft X-rays also result in acceptable fits. None the less, the success of the ionized absorber model for this object is consistent with a picture in which a significant fraction of X-ray-absorbed BLAGN possess ionized absorbers.
For the remaining seven sources, all classified as NELGs, for which the simplest model (a Γ= 1.9 power law and cold absorber) is rejected, the best fits are obtained when an additional soft component is included. For four of these sources this is the only viable model, so we consider these to be ‘secure’ detections of the soft component. We consider the other three sources to be ‘tentative’ detections of the soft component, because we cannot rule out the alternative model with an ionized absorber on χ2 grounds. Both models for the soft component are successful for most, but not all, of these seven objects: the power-law soft excess results in acceptable fits for all but XMM J094239.79+465005.3, and the thermal plasma soft excess results in acceptable fits for all but XMM J083139.11+524206.2 and XMM J150339.60+101605.6. It is somewhat surprising that the power-law soft component is as successful as the thermal plasma, given that the soft X-ray emission in nearby Seyfert 2 galaxies is readily resolved into lines by grating observations (e.g. Sako et al. 2000; Sambruna et al. 2001; Kinkhabwala et al. 2002). However, it should be noted that an unabsorbed power-law soft component was required to reproduce the soft X-ray emission observed in NGC 4151 with ASCA (George et al. 1998), even though this emission was also subsequently resolved into line emission and recombination continua (Ogle et al. 2000; Schurch et al. 2004). As our EPIC spectra are of much lower signal-to-noise ratio than the archival ASCA data on NGC 4151, we cannot rule out a soft component dominated by emission lines and recombination continua in XMM J083139.11+524206.2 and XMM J150339.60+101605.6.
It is notable that the seven NELGs with tentative or secure detections of a soft X-ray component are towards the lower redshift, lower luminosity end of the sample (see Fig. 5). All of them have z < 0.3 and L2–10 < 3 × 1043 erg s−1. This may be a natural consequence of the way we have selected and analysed the sample. First, for higher redshift sources a smaller proportion of the soft component is visible within the 0.2–10 keV energy range of EPIC, making it more difficult to detect the soft component. Secondly, the HR2 −σHR2 > −0.3 selection criterion will exclude objects from the sample if the soft component is too strong. For a typical source with Γ= 1.9, log NH= 22.5 and σHR2= 0.15, the strength of soft component that will remove it from the sample declines from 16 per cent of the primary power law at z= 0.3 to only 7 per cent at z= 0.6. Thus a soft excess is simultaneously more difficult to detect, and more likely to violate our selection criterion, at z > 0.3. The upper panel of Fig. 8 shows the 0.5–2 keV luminosities of the soft components in these seven objects as a function of redshift, based on the model with a power-law soft component. The soft component luminosities, like the primary emission, appear to be highly correlated with redshift. This may itself be a selection effect related to our ability to detect the soft component in the presence of the primary absorbed power law. The most powerful soft component of the seven sources has a 0.5–2 keV luminosity of ∼2 × 1042 erg s−1, but this is a ‘tentative’ soft component as the spectrum of XMM J021908.37−044731.4 can also be modelled with an ionized absorber; of the four secure detections of the soft component, the most powerful has a luminosity of ∼ 3 × 1041 erg s−1. In the lower panel of Fig. 8 we show the ratios of the soft component flux to the intrinsic (i.e. unabsorbed) flux of the primary power-law component. We also show the upper limits for soft component contributions for the NELGs in which no soft component is detected. All of the secure soft component detections have luminosities equivalent to less than 10 per cent that of the primary power law, and more than half of the upper limits are also below this level. Only one tentatively detected soft component has a luminosity >10 per cent of the primary power law.
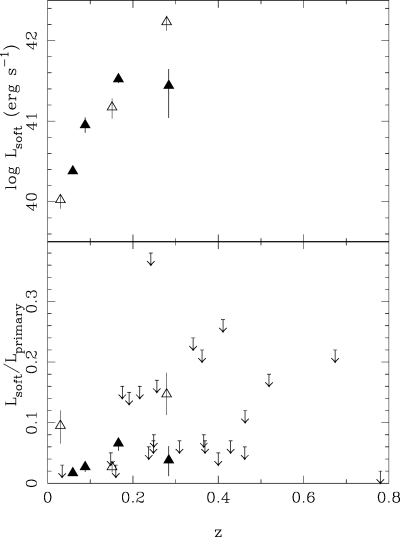
Top panel: 0.5–2 keV luminosities of the soft components (based on the power-law model) for the seven NELGs with a spectrum more complex than an absorbed power law. The filled symbols indicate those NELGs for which acceptable fits were only found with an additional soft component (i.e. solid detections of the soft component), while the open symbols indicate those objects for which acceptable fits could also be found with an ionized absorber instead of a soft component (i.e. tentative detections of the soft component). Bottom panel: ratios of the soft (unabsorbed) power-law normalization to that of the primary (absorbed) power law, for the NELGs. Filled and open triangles indicate the same objects as in the top panel, while upper limits are given for those objects that could be fitted with the absorbed power-law model (see Table 3).
In the XMM–Newton performance-verification observations of the Lockman Hole, Mainieri et al. (2002) find only one source that requires a soft component superimposed on a heavily absorbed primary power law. This object (#50 in Mainieri et al. 2002, and #901 in Lehmann et al. 2001) has similar properties to the objects in our sample that show an additional soft component: narrow optical emission lines, z= 0.204 and L2−10∼ 1043 erg s−1. In the 13H Deep Field, Page et al. (2006b) also find one absorbed source (#100), with convincing evidence for an additional soft component. This source has narrow emission lines, z= 0.27 and L2−10= 4 × 1042 erg s−1. Caccianiga et al. (2004) find three heavily absorbed objects which require additional soft components among their sample of serendipitous 4.5–7.5 keV selected XMM–Newton sources. Again, all have narrow optical emission lines, z < 0.3, and L2−10 < 3 × 1043 erg s−1. However, Mateos et al. (2005b) find three heavily absorbed narrow-line AGN in the very deep XMM–Newton observations of the Lockman Hole, which have 0.7 < z < 0.8 and 3 × 1043 < L2−10 < 1044 erg s−1, and which require additional soft components. The soft component 0.5–2 keV luminosities are <2 × 1042 erg cm−2 s−1 in all three cases, similar to the soft component luminosities found in our sample.
Our results are in stark contrast to the soft X-ray properties reported for absorbed sources in the BEPPOSAX HELLAS survey: Vignali et al. (2001) find that additional soft components, equivalent to between 25 and 65 per cent of the primary unabsorbed power-law emission, are required in 6/12 heavily absorbed (NH > 5 × 1022 cm−2) broad-line sources. However, as we have already discussed, the HR2 selection criterion will exclude objects with very strong soft components from our sample, and a typical source at z= 0.3 with NH= 3 × 1022 cm−2, will only be selected in our sample for a soft component equivalent to <16 per cent of the primary emission. None the less, it is hard to explain such powerful soft components, equivalent to greater than 25 per cent of the primary emission, in terms of scattered emission (see Section 6.6). One possibility is that these HELLAS BLAGN actually possess ionized absorbers, which in the hardness ratio analysis performed by Vignali et al. (2001), could not be distinguished from cold absorption and a strong soft component, as would be the case for XMM J080625.35+244326.0 in our sample. For NELGs, Vignali et al. (2001) report that two absorbed HELLAS objects with narrow emission lines showed evidence for additional soft X-ray components, equivalent to 5 and 35 per cent of the primary power-law emission. While the HELLAS source with a soft component equivalent to 5 per cent of the primary power law is comparable with our findings, 35 per cent is larger than any soft component that would be expected in our sample by the HR2 selection criterion.
6.4 X-ray bright, optically normal galaxies
Three sources in our sample (XMM J095231.84−015016.1, XMM J133913.92−314421.9 and XMM J134656.75+580316.5) have 2–10 keV luminosities of 1043–1044 erg s−1, but show no emission lines in their optical spectra; they are therefore ‘X-ray bright, optically normal galaxies’ (XBONGs; see Elvis et al. 1981; Griffiths et al. 1995; Comastri et al. 2002). As discussed by Severgnini et al. (2003) and Moran, Filippenko & Chornock (2002), the majority of such objects are thought to be AGN in which the emission lines are undetectable against the host galaxy starlight except in high signal-to-noise ratio observations with subarcsecond spatial resolution. As discussed in Page et al. (2003b) and Severgnini et al. (2003), both absorbed and unabsorbed AGN could contribute to the XBONG population. Our three sources are consistent with the absorbed AGN scenario, as all of them show significant X-ray absorption.
6.5 Limits on the gas-to-dust ratios in BLAGN
Fig. 9 shows the distribution of absorber NH from the best-fitting models as a function of redshift. NH ranges from 7 × 10²¹ to 3 × 1023 cm−2, with a mean of 3 × 1022 cm−2. The distributions of NH for the BLAGN, NELGs and galaxies are indistinguishable with a KS test. There is no correlation between log NH and redshift (linear correlation coefficient of −0.05), which is interesting because the hardness ratio criterion (equation 2) should select objects with higher column density at higher redshift and higher luminosities. The paucity of luminous (L2−10 > 1044 erg cm−2 s−1) sources with NH > 1023 cm−2 in the sample implies either that such sources are rare, or that the optical limits have excluded these objects from the sample.
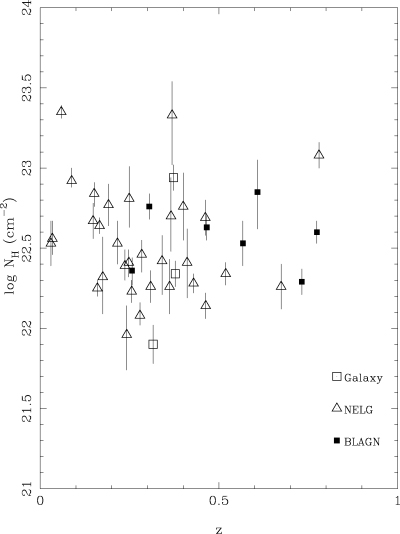
Column densities of the sample as a function of redshift.
It is rewarding to compare our sample with the sample of ROSAT sources presented in Page et al. (2001), which is also a hard-spectrum, X-ray colour selected sample, has a 0.5–2 keV flux limit which is similar to our 2–4.5 keV flux limit, and has a similar optical magnitude limit to the sample presented here. Our XMM–Newton sample is selected at higher energies, so that at any given redshift it selects objects with higher column densities than the ROSAT sample. Whereas our XMM–Newton sample contains no objects at z > 1, almost a quarter of the ROSAT sample (14/62 objects) have z > 1, all of which are BLAGN with 21.4 < log NH < 22.6; most of them show little attenuation by dust in their UV spectra and have R < 21 (e.g. Page, Mittaz & Carrera 2000). At z > 1 the flux limits and X-ray colour selection of our survey mean that it is most sensitive to AGN with 23 < log NH < 23.5. Therefore the lack of BLAGN with NH > 1023 cm−2, and the absence of any objects at z > 1 in our R < 21XMM–Newton sample implies that BLAGN with NH > 1023 cm−2, but without significant attenuation in the UV, are rare. Assuming that this is because of extinction in the optical/UV, we can estimate the maximum effective gas-to-dust ratio6 which is found in our X-ray-absorbed AGN sample as follows. To have been extinguished beyond the optical limits of the sample (R= 21), BLAGN at z∼ 1 would have to be attenuated by more than 1 mag at 3500 Å (rest frame) compared to the ROSAT sample of Page et al. (2001) in which all but two BLAGN have R < 20. This would be equivalent to an extinction of E(B−V) = 0.2 for Galactic dust(Rieke & Lebofsky 1985), which would correspond to NH∼ 1021 cm−2 for a Galactic gas-to-dust ratio (Bohlin, Savage & Drake 1978). Thus we should observe BLAGN with z > 1 and NH > 1023 cm−2 in our sample if they have effective gas-to-dust ratios ≥ 100 times Galactic. Since we do not observe such sources, we infer that BLAGN with effective gas-to-dust ratios ≥ 100 times Galactic are absent from our sample.
The space density of z > 1 X-ray-absorbed BLAGN with 21.4 < log NH < 22.6 is ∼10 per cent the space density of unobscured BLAGN (Akiyama et al. 2000; Mainieri et al. 2002; Page et al. 2004; Perola et al. 2004; Silverman et al. 2005; Page et al. 2006b). The lack of BLAGN with 23 < log NH < 23.5 in our XMM–Newton sample (at higher energies than the ROSAT sample, but with a similar limiting flux) implies that such objects have an even smaller space density, equivalent to no more than a few per cent of the unobscured population. It is interesting to compare this to the space density of broad absorption line (BAL) QSOs, which make up ∼15 per cent of the optical QSO population in the redshift interval (1.7 < z < 3.5) where the BALs can be detected (Reichard et al. 2003), and approximately half of which have NH > 1023 cm−2 (Gallagher et al. 2002). BALQSOs are the only subset of the optically selected BLAGN population which appear to have effective gas-to-dust ratios ∼100 times Galactic (Maiolino et al. 2001), showing both strong UV emission and large X-ray column densities. The limits from our survey imply that BALQSOs will also form the majority of BLAGN with extreme gas-to-dust ratios amongst the X-ray-selected population.
6.6 Implications for the AGN population and geometric unification
The phenomenology of X-ray-absorbed AGN is an important test of the AGN unification scheme, which postulates that AGN are surrounded by a dense obscuring torus of dust and gas (Antonucci 1993), or optically thick material associated with the outer accretion disc (e.g. Elitzur & Shlosman 2006), and therefore the X-ray and optical absorption properties of AGN are primarily determined by their orientation with respect to the observer. Overall, the results found here and elsewhere are in broad agreement with this unification scheme, because the majority of the sources that show significant X-ray absorption (i.e. NH > 1022 cm−2) are NELGs, and so have optical properties consistent with an edge-on perspective, namely, narrow emission lines and absent or highly attenuated nuclear UV/optical continua. From the X-ray spectra of 31 such NELGs presented earlier, there are four secure detections of an additional soft component which is equivalent to between 2 and 7 per cent of the primary, absorbed, emission. In addition, there are three tentative detections, and for most of the sources the upper limits do not rule out a soft component equivalent to several per cent of the primary emission. The secure detection rate alone implies that such components are present in >4 per cent of the population (at 95 per cent confidence, based on the estimators of Gehrels 1986). Thus a non-negligible fraction of these heavily absorbed, narrow-line objects show an additional component of soft X-ray emission that apparently escapes the obscuring torus.
In the context of the unified scheme, some soft X-ray emission is expected to arise from obscured AGN in the form of X-rays that are reprocessed or scattered in the ionization cones of the AGN. In such a geometry, the amount of soft X-ray radiation that can be directed into our line of sight depends on the opening angle of the torus, and the fraction of the soft X-ray emission that is absorbed or scattered in the ionization cones. Assuming that the torus covers 80 per cent of the sky, as inferred in optical and X-ray studies of local AGN (Maiolino & Rieke 1995; Risaliti et al. 1999), and that the radiation that is intercepted within the ionization cones is scattered or re-emitted isotropically (so that half is directed back towards the torus), then the luminosity of the scattered component will be 10 per cent of the luminosity that was absorbed or scattered within the ionization cone. Thus to produce a soft component equivalent to 5 per cent of the primary power law requires that around half of the soft X-rays are absorbed or scattered within the ionization cone. For such a large fraction of the soft X-ray radiation to be intercepted within the ionization cone implies that the cone must contain an ionized absorber with a large column density.
Thus within the context of the unified scheme, the fraction of absorbed, narrow-line objects that show an additional soft component, equivalent to several per cent of the primary emission, should be matched by (at least) the same fraction (i.e. >4 per cent) of broad-line objects displaying significant absorption (≥50 per cent) of their soft X-rays from an ionized absorber. Note that this is a lower limit to the fraction of heavily absorbed broad-line objects, since ionized absorption close to the base of the ionization cone will not redirect X-rays over the edge of the torus.
While many Seyfert 1 galaxies in the local Universe have ionized absorbers (Reynolds 1997; George et al. 1998; Blustin et al. 2005), only a few nearby objects such as NGC 3783 (Blustin et al. 2002; Behar et al. 2003; Krongold et al. 2003; Netzer et al. 2003) and H0557−385 (Ashton et al. 2006) are known to absorb more than half of the incident soft X-ray emission. None the less, the presence of these two objects within the 19 BLAGN in the Piccinotti et al. (1982) sample is consistent with our expectation of >4 per cent. For more distant objects, the fraction of BLAGN with heavy soft X-ray absorption is ∼10 per cent (Akiyama et al. 2000; Mainieri et al. 2002; Page et al. 2004; Perola et al. 2004; Silverman et al. 2005; Page et al. 2006b). This is compatible with our findings for the NELGs provided that > 40 per cent of these X-ray-absorbed BLAGN are viewed pole-on and harbour high-opacity ionized absorbers, so that > 4 per cent of all BLAGN have this property. Evidence that this could be the case is building up: within the sample presented here an ionized absorber provides the best fit to the spectrum of XMM J080625.35+244326.0, and examples of X-ray-absorbed BLAGN which require ionized absorbers have also been found by Piconcelli et al. (2002), Page et al. (2006a) and Page et al. (2006b). Objects classified as ‘soft X-ray weak quasars’ (Brandt, Laor & Wills 2000) also appear to be BLAGN with substantial soft X-ray absorption, and the absorbers in a significant fraction of these are also found to be ionized (Schartel et al. 2005). These results indicate that within the context of the unified scheme, the current limits on the scattered components in narrow-line objects are compatible with the numbers of X-ray-absorbed broad-line objects.
Finally, it is worth asking how the three galaxies without discernable optical emission lines fit within this picture. In our sample, they are outnumbered ∼10:1 by the NELGs, and so are a minority of the absorbed AGN population. In trying to fit these objects with the unified scheme, we can envisage four possible hypotheses for the apparent weakness of their optical emission lines: (i) the AGN are so weak compared to the host galaxies that the emission lines are undetectable against the bright galaxy continua, (ii) the tori in these objects have covering factors approaching unity, (iii) their narrow-line regions are themselves obscured or (iv) the gas in their narrow-line regions is so tenuous as to make the optical emission lines anomalously weak. Hypothesis (i) can be ruled out immediately: their optical-to-X-ray flux ratios lie within 0.5 dex of the fX/fR= 1 line shown in Fig. 2, and are indistinguishable from those of the NELGs. In all the remaining possibilities, the fraction of soft X-rays that can be reprocessed and redirected into our line of sight should be negligible, and so significant soft X-ray components in their X-ray spectra would be inconsistent with the unified scheme. Soft components are not detected in any of the three, as expected from the unified scheme.
7 CONCLUSIONS
We have defined the XMM-SSC survey of hard-spectrum XMM–Newton sources, and presented optical and X-ray spectra for an optically bright (r < 21) sample of 42 sources. We find that our hardness ratio selection criterion provides a very clean sample of X-ray-absorbed AGN, in agreement with the findings of Caccianiga et al. (2004) and Della Ceca et al. (2004). Every source in the optically bright sample is an AGN with 21.8 < log NH < 23.4, with the possible exception of one source. This source has an optical counterpart which is a Galactic M star, but we argue that a fainter optical counterpart, closer to the X-ray source position, is more likely to be the correct optical counterpart. Most (36/42) of the sources have X-ray luminosities characteristic of Seyfert galaxies (1042 < L2−10 < 1044 erg s−1). The majority of the sources (31/42) show only narrow emission lines (FWHM < 1000 km s−1) in their optical spectra, although a small number (7) of the sources also show broad emission lines, and three sources have no detectable emission lines in their optical spectra. None of the sources have z > 1. The lack of BLAGN at higher redshifts, luminosities and column densities implies that the effective gas-to-dust ratio in AGN absorbers rarely exceeds 100 times Galactic, and it is unlikely that more than a few per cent of BLAGN have X-ray column densities of cold gas which are >1023 cm−2. In seven of the 31 NELGs an absorbed power law is unable to fit the X-ray spectrum satisfactorily; an additional soft component provides acceptable fits for these objects. In our sample, these soft components are only observed in narrow emission-line objects which are relatively nearby (z < 0.3) and have low–moderate luminosity (L2−10 < 3 × 1043 erg s−1). These soft components are a natural consequence of the AGN unified scheme if they are soft X-rays that have been absorbed and re-emitted within the narrow-line region. This would require that >4 per cent of BLAGN have ionized absorbers with >50 per cent opacity to soft X-rays, indicating that a substantial fraction of X-ray-absorbed BLAGN have ionized absorbers.
A coding error in the task emldetect led to overestimated values for DET_ML prior to science analysis system (sas) version 6.0. The values of DET_ML given in this paper have been corrected for this problem.
We take the sky-survey plate limit to be r∼ 21, and consider sources with r > 21 as part of the optically faint sample even if they are detected on the sky-survey plates.
The relationship fX=fR as defined by MHardy et al. (2003) translates to r= 20.175 − log f2−4.5 where f2−4.5 is the 2–4.5 keV flux in units of 10−14 erg cm−2 s−1, assuming an X-ray photon index Γ= 1.7.
The FWHM has not been corrected for the instrumental contribution, which is up to 600 km s−1 at the blue end of EMMI.
A uniform flux limit has not been imposed on the sample; none the less the sample is flux limited in that the distance to which an object of any particular luminosity can be detected is determined by its flux.
The Galactic gas-to-dust ratio which would produce equivalent UV extinction for the X-ray derived cold column density.
Based on observations obtained with XMM–Newton, an ESA science mission with instruments and contributions directly funded by ESA Member States and NASA. This research was also based on observations made at the WHT which is operated on the island of La Palma by the Isaac Newton Group in the Spanish Observatorio del Roque de los Muchachos of the Instituto de Astrofisica de Canarias, and on observations collected at the European Southern Observatory, Chile, ESO No. 71.A-0444. This research has made use of the NASA/IPAC Extragalactic Database which is operated by the Jet Propulsion Laboratory, California Institute of Technology, under contract with the National Aeronautics and Space Administration. This research has made use of data obtained from the SuperCOSMOS Science Archive, prepared and hosted by the Wide Field Astronomy Unit, Institute for Astronomy, University of Edinburgh, which is funded by the UK Particle Physics and Astronomy Research Council. FJC acknowledges financial support from the Spanish Ministerio de Educacion Ciencia, under projects ESP2003-00812 and ESP2006-13608-C02-01. RDC and PS acknowledge partial financial support by the MIUR (Cofin-03-02-23) and INAF. We thank Natalie Webb for useful comments.
REFERENCES
