


Abstract
Optical and near-infrared (near-IR) observations of the Type Ic supernova (SN Ic) 2004aw are presented, obtained from −3 to +413 d with respect to the B-band maximum. The photometric evolution is characterized by a comparatively slow post-maximum decline of the light curves. The peaks in redder bands are significantly delayed relative to the bluer bands, the I-band maximum occurring 8.4 d later than that in B. With an absolute peak magnitude of −18.02 in the V band the SN can be considered fairly bright, but not exceptional. This also holds for the U through I bolometric light curve, where SN 2004aw has a position intermediate between SNe 2002ap and 1998bw. Spectroscopically SN 2004aw provides a link between a normal SN Ic like SN 1994I and the group of broad-lined SNe Ic. The spectral evolution is rather slow, with a spectrum at day +64 being still predominantly photospheric. The shape of the nebular [O i]λλ6300, 6364 line indicates a highly aspherical explosion. Helium cannot be unambiguously identified in the spectra, even in the near-IR. Using an analytical description of the light-curve peak we find that the total mass of the ejecta in SN 2004aw is 3.5–8.0 M⊙, significantly larger than that in SN 1994I, although not as large as in SN 1998bw. The same model suggests that about 0.3 M⊙ of 56Ni has been synthesized in the explosion. No connection to a GRB can be firmly established.
1 INTRODUCTION
Type Ic supernovae (SNe Ic) were established as a distinct class in the 1980s, and soon proposed to originate from the gravitational core collapse of a massive star whose hydrogen and helium envelopes were stripped through stellar winds or binary interaction (for a review on the different SN types see e.g. Filippenko 1997). However, over the subsequent ten or more years only a few observational efforts were made to learn more about the nature and properties of this class of SNe. Exceptions were SN 1987M (Filippenko, Porter & Sargent 1990; Nomoto, Filippenko & Shigeyama 1990; Jeffery et al. 1991; Swartz et al. 1993), SN 1990U, SN 1990aa and SN 1991A (Filippenko 1992; Gómez & López 1994), and especially SN 1994I (e.g. Filippenko et al. 1995; Richmond et al. 1996), which was studied in great detail at various frequencies. For some other SNe Ic, like SN 1983V (Clocchiatti et al. 1997) and SN 1990B (Clocchiatti et al. 2001), extensive data sets were obtained, but their publication took some time and coincided with the new boom in SN Ic research, which set in with the discovery of SN 1997ef (Garnavich et al. 1997a, b, c; Iwamoto et al. 2000; Mazzali, Iwamoto & Nomoto 2000) and SN 1998bw (Galama et al. 1998; Patat et al. 2001). These objects showed extremely broad spectral features owing to an unusually high kinetic energy of their ejecta, and therefore were labelled as ‘hypernovae’. Also, the collection of SN Ib/c spectra published by Matheson et al. (2001) and efforts to model spectra of SNe Ib/c by Branch et al. (2002) and Elmhamdi et al. (2006) might be considered expressions of the new enthusiasm in this field.
In the following years, several more broad-lined SNe Ic (hereafter BL-SNe) were discovered. Unfortunately, a specific and generally accepted definition of the term ‘hypernova’ could not be established; instead several different definitions were used in parallel, creating considerable confusion. Probably the most commonly adopted definition is that of Nomoto et al. (2003, 2005) and Mazzali et al. (2005a), who refer to hypernovae as core-collapse SNe with a total kinetic energy of the ejecta larger than 1052 erg, about an order of magnitude larger than in ordinary SNe Ic like SN 1994I. However, others use hypernova as a synonym for a jet-induced SN connected to a gamma-ray burst (GRB) as predicted by the collapsar model (Paczyński 1998a,b; MacFadyen & Woosley 1999). In addition, a classification based on observationally accessible quantities such as the width of spectral features (Mazzali et al. 2002; Pandey et al. 2003a) or the luminosity (Brown et al. 2000) can be found in the literature. Because of this ambiguity, we avoid the use of the term hypernova and rather concentrate on the observable discrimination of SNe Ic into normal-velocity and broad-lined events on the basis of spectra obtained near the time of optical maximum brightness.
Some of the SNe Ic discovered so far could be linked to GRBs, while for the majority there is apparently no association. Thus far, the precise mechanism connecting GRBs with SNe is not fully understood. In particular, it is not clear how we would infer the occurrence of a GRB accompanying an SN explosion, if the former is directed away from the observer, so that neither γ-rays nor X-rays are detected. Given the relatively small number of well-observed SNe Ic or BL-SNe to date, every additional object with good photometric and spectroscopic coverage may help to improve the picture of stripped-envelope core-collapse SNe and their relation to GRBs. This is the context of the observing campaign conducted on SN 2004aw.
SN 2004aw (z= 0.0163) was discovered independently by Boles & Itagaki (2004) on ut 2004 March 19.85 and 20.51, respectively. After an initial classification as an SN Ia (Benetti et al. 2004a; Matheson, Challis & Kirshner 2004), it was reclassified as an SN Ic (Filippenko et al. 2004). The SN is located at  and
and  , in a tidal tail of NGC 3997, a barred spiral (SBb) galaxy and multiple system (LEDA1). Van den Bergh, Li & Filippenko (2005) noted that NGC 3997 is a merger system of two spiral galaxies showing tidally deformed spiral arms.
After discovery and classification, the European Supernova Collaboration2 and the Berkeley Supernova Group started follow-up observations in the optical and infrared at various telescopes. We present the entire set of data obtained for SN 2004aw and discuss the techniques applied for data reduction in Section 2. In Section 3, we estimate the distance of SN 2004aw and the extinction along the line of sight towards it. Sections 4 and 5 are devoted to the analysis of the light curves and spectra, respectively. Conclusions are drawn and their impact on the connection between ordinary SNe Ic, BL-SNe and GRBs is discussed in Section 6, followed by a short summary in Section 7. Synthetic light curves and spectra will be presented in separate papers (Deng et al., in preparation; Baklanov et al., in preparation).
2 DATA ACQUISITION AND REDUCTION
2.1 Photometry
Optical images of SN 2004aw were acquired from 3 d before to almost 1 yr after maximum light (which occurred on JD 245 3088.4 ± 0.5 for the B band), with dense sampling during the first two months. Basic data reduction (bias subtraction, overscan correction and flat-fielding) was performed using standard routines in iraf3 (Massey & Davis 1992; Massey 1997). A local sequence of stars in the SN field (shown in Fig. 1) was calibrated using observations of several standard stars obtained on photometric nights. Their magnitudes, listed in Table 1, were used to fix the photometric zero-points for all nights and determine the SN relative magnitudes. The stars labelled 1, 2 and 3 were saturated in almost all images except those taken with the Katzman Automatic Imaging Telescope (KAIT: Filippenko et al. 2001) at Lick Observatory, so they were calibrated relative to the rest of the sequence from KAIT images only.
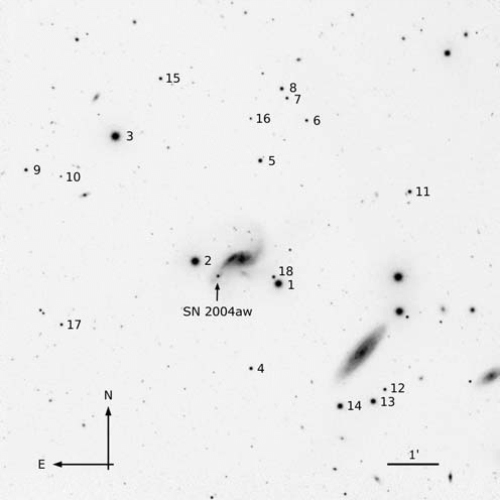
J-band image of the SN 2004aw field taken with the Calar Alto 3.5-m Telescope plus Omega 2000 on ut 2004 April 7. The local sequence stars are marked.
| ID | U | B | V | R | I | J | H | K′ |
|---|---|---|---|---|---|---|---|---|
| 1 | 13.67 ± 0.01 | 13.01 ± 0.01 | 12.64 ± 0.01 | 12.40 ± 0.01 | ||||
| 2 | 13.43 ± 0.01 | 12.67 ± 0.01 | 12.27 ± 0.01 | 11.99 ± 0.01 | ||||
| 3 | 13.62 ± 0.01 | 12.71 ± 0.02 | 12.21 ± 0.01 | 11.79 ± 0.01 | ||||
| 4 | 20.77 ± 0.04 | 19.44 ± 0.01 | 18.09 ± 0.01 | 17.20 ± 0.01 | 16.38 ± 0.01 | 15.27 ± 0.06 | 14.68 ± 0.05 | 14.53 ± 0.04 |
| 5 | 19.85 ± 0.04 | 18.48 ± 0.01 | 17.17 ± 0.02 | 16.30 ± 0.03 | 15.55 ± 0.02 | 14.58 ± 0.08 | 13.94 ± 0.07 | 13.85 ± 0.09 |
| 6 | 20.47 ± 0.03 | 18.93 ± 0.02 | 17.93 ± 0.02 | 16.91 ± 0.01 | 15.74 ± 0.04 | 15.12 ± 0.08 | 15.03 ± 0.06 | |
| 7 | 17.61 ± 0.04 | 17.77 ± 0.02 | 17.27 ± 0.01 | 16.95 ± 0.02 | 16.64 ± 0.02 | 16.23 ± 0.03 | 15.93 ± 0.07 | 16.00 ± 0.05 |
| 8 | 19.93 ± 0.01 | 18.41 ± 0.01 | 17.34 ± 0.02 | 16.19 ± 0.02 | 14.95 ± 0.04 | 14.34 ± 0.05 | 14.23 ± 0.06 | |
| 9 | 17.06 ± 0.05 | 17.22 ± 0.03 | 16.68 ± 0.02 | 16.28 ± 0.03 | 15.93 ± 0.03 | 15.52 ± 0.03 | 15.21 ± 0.03 | 15.22 ± 0.04 |
| 10 | 21.00 ± 0.06 | 19.98 ± 0.06 | 19.04 ± 0.02 | 18.44 ± 0.02 | 17.94 ± 0.05 | |||
| 11 | 19.24 ± 0.05 | 18.11 ± 0.04 | 16.95 ± 0.03 | 16.28 ± 0.03 | 15.75 ± 0.04 | 14.81 ± 0.04 | 14.22 ± 0.04 | 14.15 ± 0.03 |
| 12 | 18.04 ± 0.02 | 17.82 ± 0.01 | 17.08 ± 0.01 | 16.70 ± 0.02 | 16.30 ± 0.02 | 15.64 ± 0.04 | 15.32 ± 0.03 | 15.24 ± 0.06 |
| 13 | 16.38 ± 0.02 | 15.66 ± 0.02 | 14.76 ± 0.01 | 14.30 ± 0.02 | 13.88 ± 0.02 | 13.16 ± 0.02 | 12.80 ± 0.04 | 12.77 ± 0.03 |
| 14 | 18.91 ± 0.02 | 17.63 ± 0.01 | 16.13 ± 0.02 | 15.16 ± 0.01 | 14.18 ± 0.02 | |||
| 15 | 15.48 ± 0.03 | 14.90 ± 0.05 | 14.76 ± 0.04 | |||||
| 16 | 16.95 ± 0.04 | 16.37 ± 0.08 | 16.29 ± 0.11 | |||||
| 17 | 16.09 ± 0.02 | 15.48 ± 0.08 | 15.39 ± 0.05 | |||||
| 18 | 15.37 ± 0.04 | 14.73 ± 0.05 | 14.60 ± 0.05 |
The optical data for stars 4–14 were obtained on nine photometric nights using CAFOS, DOLORES and PFIP, while stars 1–3 were calibrated with KAIT images relative to the rest of the sequence. In the near-IR, all nights were used to calibrate the sequence.
| ID | U | B | V | R | I | J | H | K′ |
|---|---|---|---|---|---|---|---|---|
| 1 | 13.67 ± 0.01 | 13.01 ± 0.01 | 12.64 ± 0.01 | 12.40 ± 0.01 | ||||
| 2 | 13.43 ± 0.01 | 12.67 ± 0.01 | 12.27 ± 0.01 | 11.99 ± 0.01 | ||||
| 3 | 13.62 ± 0.01 | 12.71 ± 0.02 | 12.21 ± 0.01 | 11.79 ± 0.01 | ||||
| 4 | 20.77 ± 0.04 | 19.44 ± 0.01 | 18.09 ± 0.01 | 17.20 ± 0.01 | 16.38 ± 0.01 | 15.27 ± 0.06 | 14.68 ± 0.05 | 14.53 ± 0.04 |
| 5 | 19.85 ± 0.04 | 18.48 ± 0.01 | 17.17 ± 0.02 | 16.30 ± 0.03 | 15.55 ± 0.02 | 14.58 ± 0.08 | 13.94 ± 0.07 | 13.85 ± 0.09 |
| 6 | 20.47 ± 0.03 | 18.93 ± 0.02 | 17.93 ± 0.02 | 16.91 ± 0.01 | 15.74 ± 0.04 | 15.12 ± 0.08 | 15.03 ± 0.06 | |
| 7 | 17.61 ± 0.04 | 17.77 ± 0.02 | 17.27 ± 0.01 | 16.95 ± 0.02 | 16.64 ± 0.02 | 16.23 ± 0.03 | 15.93 ± 0.07 | 16.00 ± 0.05 |
| 8 | 19.93 ± 0.01 | 18.41 ± 0.01 | 17.34 ± 0.02 | 16.19 ± 0.02 | 14.95 ± 0.04 | 14.34 ± 0.05 | 14.23 ± 0.06 | |
| 9 | 17.06 ± 0.05 | 17.22 ± 0.03 | 16.68 ± 0.02 | 16.28 ± 0.03 | 15.93 ± 0.03 | 15.52 ± 0.03 | 15.21 ± 0.03 | 15.22 ± 0.04 |
| 10 | 21.00 ± 0.06 | 19.98 ± 0.06 | 19.04 ± 0.02 | 18.44 ± 0.02 | 17.94 ± 0.05 | |||
| 11 | 19.24 ± 0.05 | 18.11 ± 0.04 | 16.95 ± 0.03 | 16.28 ± 0.03 | 15.75 ± 0.04 | 14.81 ± 0.04 | 14.22 ± 0.04 | 14.15 ± 0.03 |
| 12 | 18.04 ± 0.02 | 17.82 ± 0.01 | 17.08 ± 0.01 | 16.70 ± 0.02 | 16.30 ± 0.02 | 15.64 ± 0.04 | 15.32 ± 0.03 | 15.24 ± 0.06 |
| 13 | 16.38 ± 0.02 | 15.66 ± 0.02 | 14.76 ± 0.01 | 14.30 ± 0.02 | 13.88 ± 0.02 | 13.16 ± 0.02 | 12.80 ± 0.04 | 12.77 ± 0.03 |
| 14 | 18.91 ± 0.02 | 17.63 ± 0.01 | 16.13 ± 0.02 | 15.16 ± 0.01 | 14.18 ± 0.02 | |||
| 15 | 15.48 ± 0.03 | 14.90 ± 0.05 | 14.76 ± 0.04 | |||||
| 16 | 16.95 ± 0.04 | 16.37 ± 0.08 | 16.29 ± 0.11 | |||||
| 17 | 16.09 ± 0.02 | 15.48 ± 0.08 | 15.39 ± 0.05 | |||||
| 18 | 15.37 ± 0.04 | 14.73 ± 0.05 | 14.60 ± 0.05 |
The optical data for stars 4–14 were obtained on nine photometric nights using CAFOS, DOLORES and PFIP, while stars 1–3 were calibrated with KAIT images relative to the rest of the sequence. In the near-IR, all nights were used to calibrate the sequence.
The instrumental SN magnitudes were determined with the point spread function (PSF) fitting photometry using the software package ‘snoopy’, specifically designed for this purpose by F. Patat and implemented in iraf by E. Cappellaro. In general, no template galaxy subtraction was done, because no suitable templates were available. For the KAIT images, templates obtained on days +266 to +270 with the same instrument and under variable seeing conditions were used to perform galaxy subtraction. This technique is expected to provide superior results given the non-isolated position of SN 2004aw within its host galaxy and the mostly poor seeing of the KAIT observations. However, the SN had not entirely faded away at that epoch, which caused a flux oversubtraction. This was corrected by subtracting from the KAIT templates the SN flux measured in the nearly simultaneous (day +258) TNG observations, which have better quality and seeing than those acquired with KAIT. Depending on epoch and filter, the corrections derived in this way range from 0.02 to 0.10 mag.
We noted that in some of our observations the filter response deviates from the standard Johnson/Cousins passbands (Bessell 1990). Thus, besides a first-order colour-term correction derived from observations of Landolt standard fields, we applied an additional correction based on the prescription of Stritzinger et al. (2002), Pignata et al. (2004) and references therein. These ‘S-corrections’ were computed for the epochs from 0 to +57 d in the R and I bands and from 0 to +36 d in the B and V bands. Only for the Wendelstein Telescope and the William Herschel Telescope, for which we did not have the required filter response curves, the S-corrections were omitted. The derived corrections were mostly small (typically ≤ 0.03 mag), but in some cases reached values of up to ∼0.10 mag. The largest corrections were applied to the B- and I-band magnitudes obtained with CAFOS. In summary, the corrections were very modest in the V and R bands, they produced a small reduction of the scatter in the B band, and improved substantially the coherence of the I-band magnitudes.
The final apparent magnitudes for SN 2004aw are reported in Table 2, together with their uncertainties, computed as the sum in quadrature of the measurement errors of the instrumental SN magnitudes and the error associated with the photometric zero-point of the night.
Photometric observations of SN 2004aw.a
| ut Date | JD −245 3000 | Epochb (d) | U | B | V | R | I | Telescope | Seeingc (arcsec) |
|---|---|---|---|---|---|---|---|---|---|
| 04/03/21 | 85.8 | −2.6 | 18.12 ± 0.04 | 17.47 ± 0.04 | 17.19 ± 0.04 | 16.97 ± 0.05 | KAIT | 2.24 | |
| 04/03/23 | 87.8 | −0.6 | 18.08 ± 0.03 | 17.36 ± 0.04 | 17.07 ± 0.02 | 16.77 ± 0.03 | KAIT | 2.64 | |
| 04/03/24 | 88.8 | 0.4 | 18.06 ± 0.12 | 17.32 ± 0.11 | 16.97 ± 0.06 | 16.78 ± 0.11 | KAIT | 2.58 | |
| 04/03/24d | 89.4 | 1.0 | 18.18 ± 0.06 | 18.07 ± 0.06 | 17.29 ± 0.04 | 17.01 ± 0.04 | 16.71 ± 0.04 | TNG | 1.38 |
| 04/03/26 | 90.9 | 2.5 | 17.31 ± 0.03 | 16.93 ± 0.06 | 16.63 ± 0.04 | KAIT | 2.69 | ||
| 04/03/28 | 92.8 | 4.4 | 18.38 ± 0.07 | 17.32 ± 0.04 | 16.91 ± 0.04 | 16.60 ± 0.04 | KAIT | 3.90 | |
| 04/03/28 | 93.1 | 4.7 | 18.38 ± 0.11 | 18.24 ± 0.06 | 17.31 ± 0.03 | 16.87 ± 0.03 | 16.52 ± 0.02 | SSO | 2.62 |
| 04/03/29 | 93.8 | 5.4 | 18.39 ± 0.04 | 17.35 ± 0.04 | 16.92 ± 0.04 | 16.54 ± 0.04 | KAIT | 2.44 | |
| 04/03/29 | 94.1 | 5.7 | 18.55 ± 0.05 | 18.35 ± 0.05 | 17.37 ± 0.06 | 16.91 ± 0.04 | 16.54 ± 0.07 | SSO | 2.20 |
| 04/03/29 | 94.5 | 6.1 | 18.42 ± 0.11 | 17.44 ± 0.06 | 16.99 ± 0.06 | 16.54 ± 0.06 | Ekar | 3.16 | |
| 04/03/30 | 94.8 | 6.4 | 18.43 ± 0.10 | 17.33 ± 0.06 | 16.91 ± 0.07 | 16.53 ± 0.07 | KAIT | 2.48 | |
| 04/03/30 | 95.5 | 7.1 | 18.52 ± 0.10 | 17.38 ± 0.06 | 16.88 ± 0.04 | 16.43 ± 0.05 | WD | 1.57 | |
| 04/03/30 | 95.5 | 7.1 | 17.43 ± 0.16 | 16.54 ± 0.06 | NOT | 0.75 | |||
| 04/03/31 | 95.8 | 7.4 | 18.53 ± 0.08 | 17.43 ± 0.06 | 16.92 ± 0.03 | 16.54 ± 0.04 | KAIT | 2.32 | |
| 04/03/31 | 96.5 | 8.1 | 18.95 ± 0.09 | 18.58 ± 0.04 | 17.32 ± 0.05 | 16.85 ± 0.04 | 16.40 ± 0.05 | NOT | 0.96 |
| 04/04/01 | 96.8 | 8.4 | 18.56 ± 0.12 | 17.44 ± 0.05 | 16.95 ± 0.04 | 16.56 ± 0.05 | KAIT | 3.08 | |
| 04/04/01 | 97.4 | 9.0 | 18.81 ± 0.08 | 17.34 ± 0.08 | 16.88 ± 0.03 | 16.42 ± 0.03 | WD | 1.82 | |
| 04/04/07 | 102.8 | 14.4 | 17.69 ± 0.06 | 17.04 ± 0.04 | 16.58 ± 0.04 | KAIT | 2.44 | ||
| 04/04/07 | 103.3 | 14.9 | 19.14 ± 0.05 | 17.71 ± 0.05 | 17.07 ± 0.05 | 16.59 ± 0.05 | Caha | 1.34 | |
| 04/04/07d | 103.5 | 15.1 | 19.81 ± 0.18 | 19.25 ± 0.08 | 17.73 ± 0.11 | 17.04 ± 0.05 | 16.56 ± 0.10 | TNG | 1.93 |
| 04/04/09 | 104.8 | 16.4 | 19.25 ± 0.07 | 17.82 ± 0.03 | 17.10 ± 0.05 | 16.65 ± 0.03 | KAIT | 2.24 | |
| 04/04/12 | 107.8 | 19.4 | 19.47 ± 0.11 | 18.02 ± 0.15 | 17.26 ± 0.05 | 16.71 ± 0.05 | KAIT | 2.74 | |
| 04/04/12 | 108.3 | 19.9 | 19.49 ± 0.06 | 17.97 ± 0.03 | 17.23 ± 0.03 | 16.71 ± 0.03 | Caha | 1.47 | |
| 04/04/14d | 109.6 | 21.2 | 19.54 ± 0.11 | 18.01 ± 0.04 | 17.27 ± 0.04 | 16.74 ± 0.04 | Caha | 1.91 | |
| 04/04/14d | 110.4 | 22.0 | 19.60 ± 0.03 | 18.07 ± 0.03 | 17.33 ± 0.04 | 16.77 ± 0.05 | Caha | 1.14 | |
| 04/04/16 | 111.8 | 23.4 | 19.67 ± 0.12 | 18.15 ± 0.05 | 17.41 ± 0.04 | 16.88 ± 0.03 | KAIT | 2.84 | |
| 04/04/17 | 113.4 | 25.0 | 19.77 ± 0.15 | 18.22 ± 0.07 | 17.49 ± 0.06 | 16.93 ± 0.05 | Caha | 3.70 | |
| 04/04/18 | 114.5 | 26.1 | 20.81 ± 0.08 | 19.95 ± 0.04 | 18.30 ± 0.03 | 17.55 ± 0.03 | NOT | 0.86 | |
| 04/04/20 | 116.4 | 28.0 | 20.91 ± 0.06 | 19.96 ± 0.06 | 18.35 ± 0.03 | 17.61 ± 0.03 | 17.00 ± 0.03 | NOT | 0.69 |
| 04/04/20 | 116.4 | 28.0 | 19.99 ± 0.05 | 18.42 ± 0.04 | 17.65 ± 0.03 | 17.03 ± 0.04 | Caha | 1.09 | |
| 04/04/21 | 117.4 | 29.0 | 20.17 ± 0.15 | 18.44 ± 0.05 | 17.67 ± 0.07 | 17.03 ± 0.07 | Ekar | 2.30 | |
| 04/04/21 | 117.5 | 29.1 | 20.02 ± 0.05 | 18.46 ± 0.04 | 17.68 ± 0.04 | 17.05 ± 0.05 | Caha | 1.57 | |
| 04/04/23 | 118.6 | 30.2 | 20.04 ± 0.09 | 18.47 ± 0.07 | 17.71 ± 0.07 | 17.08 ± 0.04 | Caha | 2.92 | |
| 04/04/23d | 119.4 | 31.0 | 20.09 ± 0.09 | 18.52 ± 0.06 | 17.74 ± 0.04 | 17.12 ± 0.05 | Caha | 1.84 | |
| 04/04/24 | 119.8 | 31.4 | 20.05 ± 0.11 | 18.57 ± 0.07 | 17.78 ± 0.05 | 17.15 ± 0.05 | KAIT | 2.46 | |
| 04/04/24d | 120.5 | 32.1 | 20.88 ± 0.14 | 20.14 ± 0.05 | 18.58 ± 0.04 | 17.80 ± 0.03 | 17.13 ± 0.03 | Caha | 1.35 |
| 04/04/25d | 121.5 | 33.1 | 20.20 ± 0.07 | 18.64 ± 0.03 | 17.83 ± 0.03 | 17.16 ± 0.04 | Caha | 1.30 | |
| 04/04/29 | 124.8 | 36.4 | 20.49 ± 0.43 | 18.86 ± 0.20 | 17.99 ± 0.06 | 17.29 ± 0.08 | KAIT | 3.18 | |
| 04/05/04 | 129.8 | 41.4 | 20.37 ± 0.41 | 18.75 ± 0.11 | 18.05 ± 0.08 | 17.33 ± 0.06 | KAIT | 2.68 | |
| 04/05/06d | 132.5 | 44.1 | 21.43 ± 0.13 | 20.53 ± 0.06 | 18.97 ± 0.04 | 18.15 ± 0.02 | 17.52 ± 0.04 | TNG | 1.05 |
| 04/05/09 | 134.8 | 46.4 | 20.47 ± 0.19 | 19.01 ± 0.09 | 18.25 ± 0.08 | 17.53 ± 0.06 | KAIT | 2.54 | |
| 04/05/11d | 137.4 | 49.0 | 21.44 ± 0.13 | 20.63 ± 0.07 | 19.09 ± 0.03 | 18.29 ± 0.02 | 17.62 ± 0.03 | WHT | 1.38 |
| 04/05/13 | 138.7 | 50.3 | 20.51 ± 0.17 | 19.05 ± 0.08 | 18.31 ± 0.06 | 17.59 ± 0.06 | KAIT | 2.20 | |
| 04/05/13 | 139.4 | 51.0 | 20.65 ± 0.11 | 19.16 ± 0.05 | 18.32 ± 0.04 | Ekar | 2.06 | ||
| 04/05/20 | 145.7 | 57.3 | 19.15 ± 0.07 | 18.44 ± 0.05 | 17.77 ± 0.09 | KAIT | 2.08 | ||
| 04/05/27 | 152.7 | 64.3 | 19.32 ± 0.16 | 18.63 ± 0.10 | 17.81 ± 0.10 | KAIT | 2.18 | ||
| 04/06/03 | 159.7 | 71.3 | 19.33 ± 0.25 | 18.57 ± 0.12 | 17.91 ± 0.08 | KAIT | 2.68 | ||
| 04/12/06 | 346.7 | 258.3 | >23.3 | 23.45 ± 0.34 | 22.70 ± 0.37 | 21.26 ± 0.23 | 20.84 ± 0.12 | TNG | 1.43 |
| 05/03/06 | 436.7 | 348.3 | >24.0 | 22.27 ± 0.44 | VLT | 1.76 |
Notes. KAIT: 0.76-m Katzman Automated Imaging Telescope; pixel scale = 0.8 arcsec px−1. TNG: 3.58-m Telescopio Nazionale Galileo plus Dolores; pixel scale = 0.275 arcsec px−1. SSO: Siding Spring Observatory 2.3-m Telescope plus Imager; pixel scale = 0.60 arcsec px−1. Ekar: Asiago 1.82-m Telescope plus AFOSC; pixel scale = 0.473 arcsec px−1. WD: 0.8-m Wendelstein Telescope plus Monica; pixel scale = 0.50 arcsec px−1. NOT: 2.5-m Nordic Optical Telescope plus ALFOSC; pixel scale = 0.188 arcsec px−1. Caha: Calar Alto 2.2-m Telescope plus CAFOS SiTe; pixel scale = 0.53 arcsec px−1. WHT: 4.2-m William Herschel Telescope plus PFIP; pixel scale = 0.24 arcsec px−1. VLT: ESO 8.2-m Very Large Telescope plus FORS2; pixel scale = 0.252 arcsec px−1.
The magnitudes are S-corrected, but not corrected for interstellar extinction. The KAIT images acquired from 266 to 270 d past maximum are not listed as they did not allow any measurement of the SN magnitudes; bepoch with respect to the estimated B-band maximum JD 245 3088.4 ± 0.5; caverage seeing over all filter bands; dnight used to calibrate a local sequence.
IR photometry in the JHK′ bands was obtained using NICS mounted on TNG and Omega 2000 mounted on the Calar Alto 3.5-m Telescope. The observations range from approximately 10 to 29 d after maximum light. While the basic reduction (sky determination and subtraction, combination of dithered images) was always performed manually in order to have better control over changes in the sky background, a dedicated tool (snap4) was used to correct cross-talking and field distortions in the NICS frames.
As in the case of optical photometry, the SN magnitudes were determined with respect to a calibrated sequence of stars in the field. These are the same as for optical wavelengths, complemented by four additional red stars that are either not detected in most optical bands or are close to another bright star. Their calibration was performed with standard-field observations (Hunt et al. 1998) at both telescopes, and with the help of the magnitudes reported in the 2MASS5 catalogue. For the latter comparison, the K-band magnitudes were transformed to the K′ band following Wainscoat & Cowie (1992). The SN measurements were performed using the PSF-fitting technique; no template galaxy subtraction was done. Instrumental magnitudes were transformed to the standard JHK′ system (Bessell & Brett 1988; Wainscoat & Cowie 1992) by adjusting the zero-points, but without applying any colour correction. The latter is the most uncertain aspect of our calibration, but all our attempts to determine the colour terms of the two instruments with the help of standard fields or the 2MASS local sequence yielded inconsistent values. Therefore, we have omitted colour corrections, but accounted for this deficiency with an additional contribution to the total photometric error. The derived JHK′ magnitudes and their uncertainties are shown in Table 3.
IR photometry of SN 2004aw.a
| ut Date | JD −245 3000 | Epochb (d) | J | H | K′ | Telescope | Seeingc (arcsec) |
|---|---|---|---|---|---|---|---|
| 04/04/03 | 98.6 | 10.2 | 15.98 ± 0.06 | 15.78 ± 0.06 | 15.65 ± 0.08 | TNG | 0.96 |
| 04/04/07 | 102.6 | 14.2 | 15.88 ± 0.03 | 15.79 ± 0.06 | 15.64 ± 0.07 | Caha | 1.35 |
| 04/04/08 | 103.6 | 15.2 | 15.87 ± 0.06 | 15.80 ± 0.06 | 15.72 ± 0.06 | Caha | 1.06 |
| 04/04/13 | 109.4 | 21.0 | 15.92 ± 0.03 | 15.86 ± 0.04 | 15.72 ± 0.07 | Caha | 0.96 |
| 04/04/21 | 117.4 | 29.0 | 16.25 ± 0.09 | 15.99 ± 0.14 | 15.95 ± 0.13 | TNG | 0.96 |
Notes. TNG: Telescopio Nazionale Galileo plus NICS; pixel scale = 0.25 arcsec px−1. Caha: Calar Alto 3.5-m Telescope plus Omega 2000; pixel scale = 0.45 arcsec px−1.
The magnitudes are not corrected for interstellar extinction; bepoch with respect to the estimated B-band maximum JD 245 3088.4 ± 0.5; caverage seeing over all filter bands.
2.2 Spectroscopy
The spectroscopic observations are reported in Table 4. Until SN 2004aw starts its transition to the nebular phase at ∼2 months from maximum light, its evolution is densely sampled at optical wavelengths. During the nebular phase, the SN was recovered and three more spectra were taken at phases between 236 and 413 d after maximum.
Spectroscopic observations of SN 2004aw.
| ut Date | JD −245 3000 | Epocha (d) | Airmass | Telescope | Grism/grating | Range (Å) | Resolutionb (Å) | Standards |
|---|---|---|---|---|---|---|---|---|
| 04/03/24 | 89.4 | 1.0 | 1.21 | TNG-D | LR-B + LR-R | 3200–9200 | 12 | Feige56 |
| 04/03/28 | 93.0 | 4.6 | 1.83 | SSO | grt300 + grt316 | 3650–9000 | 5 | Feige56, Cd329927 |
| 04/03/29 | 94.0 | 5.6 | 1.85 | SSO | grt300 + grt316 | 3650–9000 | 5 | Feige56, L745-46 |
| 04/03/29 | 94.5 | 6.1 | 1.26 | Ekar | gm 4 | 3800–7700 | 24 | |
| 04/03/31 | 96.5 | 8.1 | 1.01 | NOT | gm 4 | 3500–8900 | 14 | Feige67 |
| 04/04/07 | 103.5 | 15.1 | 1.01 | TNG-D | LR-B + LR-R | 3500–9400 | 14 | Hd93521 |
| 04/04/13 | 109.5 | 21.1 | 1.06 | Caha | b200 + r200 | 3550–9200 | 10 | Feige66 |
| 04/04/14 | 110.5 | 22.1 | 1.04 | Caha | b200 + r200 | 3500–9600 | 10 | Feige66 |
| 04/04/18 | 114.5 | 26.1 | 1.21 | NOT | gm 4 | 3650–8900 | 13 | |
| 04/04/20 | 116.4 | 28.0 | 1.12 | Caha | b200 + r200 | 3500–9400 | 10 | Feige66 |
| 04/04/21 | 116.8 | 28.4 | 1.01 | UKIRT | gm HK | 13 700–24 500 | 34 | BS4501 (F4V) |
| 04/04/21 | 117.4 | 29.0 | 1.16 | TNG-N | Amici prism | 7500–25 000 | 60–200 | AS24-0 (A0) |
| 04/04/21 | 117.4 | 29.0 | 1.26 | Ekar | gm 4 | 3800–7700 | 24 | Bd+332642 |
| 04/04/22 | 118.4 | 30.0 | 1.26 | Ekar | gm 2 | 5200–9400 | 75 | Bd+332642 |
| 04/04/27 | 123.5 | 35.1 | 1.26 | Caha | b200 | 3800–8650 | 12 | Feige66 |
| 04/05/06 | 132.4 | 44.0 | 1.05 | TNG-D | LR-R | 4950–9400 | 11 | Feige56 |
| 04/05/12 | 137.8 | 49.4 | 1.21 | Lick | gm600 + grt300 | 5200–9600 | 5/11 | Feige34, HD84937 |
| 04/05/25 | 151.4 | 63.0 | 1.54 | Ekar | gm 2 | 5200–9200 | 75 | |
| 04/05/27 | 152.8 | 64.4 | 1.45 | Lick | grt600 | 4000–6650 | 8 | HD84937 |
| 04/11/14 | 324.1 | 235.7 | 1.50 | Keck | gm400 + grt400 | 3750–9300 | 6 | Feige34, Bd+174708 |
| 04/12/09 | 348.8 | 260.4 | 1.08 | TNG-D | LR-B | 3800–7950 | 15 | GD140 |
| 05/05/11 | 501.8 | 413.4 | 1.04 | Keck | gm400 + grt400 | 5450–9200 | 6 | Feige34, HD84937 |
Notes. TNG-D: 3.58-m Telescopio Nazionale Galileo plus Dolores. TNG-N: 3.58-m Telescopio Nazionale Galileo plus NICS. SSO: Siding Spring Observatory 2.3-m Telescope plus DBS. NOT: 2.5-m Nordic Optical Telescope plus ALFOSC. Caha: Calar Alto 2.2-m Telescope plus CAFOS SiTe. Ekar: Asiago 1.82-m Telescope plus AFOSC. UKIRT: 3.8-m United Kingdom Infrared Telescope plus UIST. Lick: Shane 3-m Reflector plus Kast Dual Spectrograph. Keck: Keck 10-m Telescope plus LRIS.
Relative to B-band maximum (JD = 245 3088.4); bfull-width at half maximum (FWHM) of isolated, unblended night-sky lines.
All optical frames were first debiased and flat-fielded before the spectra were optimally extracted (Massey, Valdes & Barnes 1992) using standard iraf routines. Wavelength calibration was accomplished with the help of arc-lamp exposures or, whenever this was not possible or unsatisfactory, using the night-sky lines. The instrumental sensitivity functions required for flux calibration were determined from observations of the spectrophotometric standard stars reported in Table 4. Whenever no standard was observed, the sensitivity curve obtained on a different night with the same instrumental configuration was used. Telluric features were recognized in the spectra of the spectrophotometric standard stars and removed from the SN spectra.
Most of our SN 2004aw and standard-star spectra were obtained at low airmass (see Table 4) and with the slit along the parallactic angle (Filippenko 1982); surely, whenever the airmass exceeded ∼1.3 the parallactic angle was used. Therefore, the shape of the continua should not be strongly affected by differential flux losses. Moreover, all spectra were checked against the photometry, and multiplication by a constant factor to correct for flux losses due to a misalignment of the slit or to clouds proved to be sufficient to achieve a good agreement. The two spectra taken on days +5.6 and +6.1 have been co-added to increase the signal-to-noise ratio (S/N).
Almost contemporaneously with the last epoch of IR photometry (i.e. 29 d after maximum light in the B band), two IR spectra were obtained (see Table 4). The one taken with the TNG/Amici prism covers the full wavelength range from the I through K bands, but has extremely low resolution (FWHM of night-sky lines ≈ 60–200 Å). The other, taken at UKIRT, has rather poor S/N.
Both spectra were reduced following standard procedures. After pairwise subtraction of dithered frames, the SN traces were optimally extracted, scaled to the flux level of the spectrum with the highest S/N (assuming that this suffered the least flux loss), and then combined. Wavelength calibration was performed using arc-lamp exposures (UIST) or a tabulated function relating pixel number to wavelength (NICS). Removal of telluric features and a rough flux calibration were accomplished with the help of stars of spectral type A0 and F4V for NICS and UIST, respectively. In order to construct the sensitivity curves containing both instrumental response and atmospheric absorption, the A0 star was compared to Vega, and the F4V spectrum to that of the Sun. The final flux calibration was done with respect to the simultaneous SN photometry, and a constant correction factor was sufficient to provide satisfactory agreement. Finally, the two IR spectra were averaged in their common wavelength range (the H and K bands).
3 DISTANCE AND EXTINCTION
This section deals with two aspects that turn out to represent the largest source of uncertainty in the absolute calibration of the SN 2004aw data. Neither Cepheid distances nor other similarly precise distance measurements are available for NGC 3997, the host galaxy of SN 2004aw. Therefore, the redshift is the only indicator of its distance. LEDA reports a recession velocity of 4769 km s−1 inferred mainly from radio measurements, which increases to 4906 km s−1 when a correction for the Local Group infall on to the Virgo cluster is applied. The recession velocities of the other members of the small galaxy cluster to which NGC 3997 belongs show only little dispersion (approximately ±250 km s−1 around an average Local Group infall-corrected value of 4700 km s−1). Thus, assuming 500 km s−1 as an upper limit for the peculiar motion seems conservative, and we adopt this value for the uncertainty in determining the distance from the Hubble law. Using vrec= 4906 km s−1 and H0= 72 km s−1 Mpc−1, this implies a distance modulus of μ= 34.17 ± 0.23 mag.
The uncertainty associated with the amount of extinction must be considered the dominant source of error in the calibration of the SN 2004aw data. Based on our current knowledge from a very limited set of well-observed nearby objects, SNe Ic have very heterogeneous observed properties. Hence, in contrast to SNe Ia (e.g. Phillips et al. 1999) and to a certain degree also SNe IIP (Hamuy 2003; Pastorello 2003), it is not possible to infer the amount of reddening from light curves or colour curves of SNe Ic, so that (apart from spectral modelling) the only possibility of getting an estimate of the extinction along the line of sight towards SN 2004aw is by relating the equivalent width (EW) of the interstellar Na i D lines in the spectrum to the colour excess. This procedure suffers from the entirely unknown composition of the dust, and in particular the unconstrained gas-to-dust ratio of the extinguishing material. In addition, the lines might be saturated, which is impossible to be verified in low-resolution spectra.
For SN 2004aw we find a moderately strong Na i D line at the redshift of the host galaxy, and in the few spectra with sufficiently high S/N a weak line at its rest wavelength is also visible. The EWs were determined to be 2.17 ± 0.11 Å and 0.65 ± 0.03 Å, respectively (errors are only statistical). Using

a revised version of the relation presented by Turatto, Benetti & Cappellaro (2003), this implies a reddening E(B−V) = 0.35 ± 0.02 mag in NGC 3997, and a Galactic reddening of E(B−V) = 0.10 ± 0.01 mag. The value for the Galactic contribution is inconsistent with the colour excess of E(B−V) = 0.021 mag reported by Schlegel, Finkbeiner & Davis (1998) for the direction towards NGC 3997. The discrepancy could be attributed either to small-scale variations in the dust distribution of the Milky Way, to scatter in the Turatto et al. relation, or to a measurement error owing to the weakness of the line. Since we consider this last option to be the most likely, we adopt the Galactic reddening of Schlegel et al., which yields a total reddening along the line of sight of 0.37 mag. With a value of 3.1 typically assumed for RV=AV/E(B−V) (for a more detailed discussion see e.g. Cardelli, Clayton & Mathis 1989; O'Donnell 1994; Riess, Press & Kirshner 1996; Phillips et al. 1999; Elias-Rosa et al. 2006), we obtain AV= 1.15 mag and AB= 1.52 mag. We conservatively assume a total uncertainty in our estimate of the B−V colour excess of 25 per cent or 0.10 mag.
4 LIGHT CURVES
4.1 Optical light curves
Fig. 2 shows the UBVRI light curves of SN 2004aw before the seasonal gap. In addition to the results from our monitoring campaign, an unfiltered measurement provided by T. Boles and the pre-discovery limit of K. Itagaki (Boles & Itagaki 2004) are included in the figure. The SN maximum is covered in all bands except U. The post-maximum decline in the blue bands is much faster than that in the redder ones. The latest points in Fig. 2 (approximately from day +45 on) mark the onset of the radioactive tail of the light curve. Unfortunately, several of these magnitudes are uncertain owing to the very poor S/N (see errors reported in Table 2).
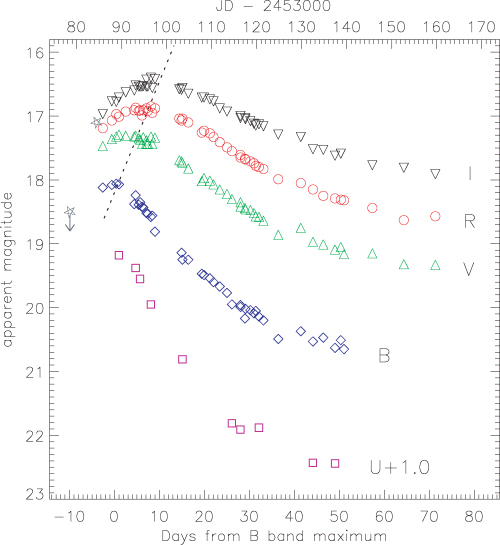
UBVRI light curves of SN 2004aw from −3 to +71 d from B-band maximum (which is JD 245 3088.4 ± 0.5). In addition, two unfiltered measurements (open-starred symbols) made by amateur astronomers are shown: T. Boles reports a magnitude of 17.1 for JD 245 3084.4 (discovery) and K. Itagaki provides a detection limit of 18.5 for JD 245 3078.5 (Boles & Itagaki 2004). The dotted line roughly connects the maxima of the B-through-I bands.
Fig. 3 shows the complete light curves of SN 2004aw, including the data points obtained at late phases. For comparison, the light curves of SNe 1998bw (Galama et al. 1998; McKenzie & Schaefer 1999; Patat et al. 2001; Sollerman et al. 2002) and 2002ap (Foley et al. 2003; Yoshii et al. 2003; Tomita et al. 2006) are also displayed in the figure, shifted in time and magnitude to match the peaks of SN 2004aw in all filters. During the radioactive tail of the light curves, one complete UBVRI set of observations was taken 258 d past maximum at TNG, and in B and R the SN was observed again 348 d past maximum at the VLT under poor seeing conditions (for details see Table 2). Since no template is available for these observations, the non-isolated position of SN 2004aw limits the precision of our late-time photometry. The SN is not visible in the TNG U-band image and in the VLT B-band image, so that only limits can be derived.
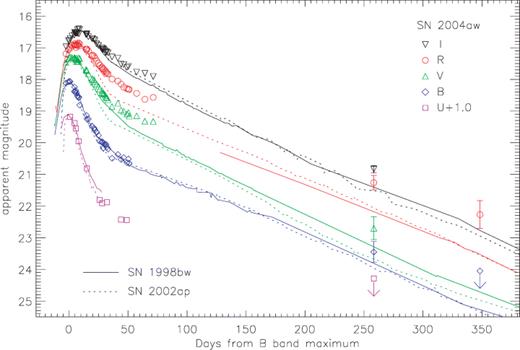
Late-time light curves of SN 2004aw compared to SN 1998bw (McKenzie & Schaefer 1999; Patat et al. 2001) and SN 2002ap (Foley et al. 2003; Yoshii et al. 2003; Tomita et al. 2006). The latter two have been shifted in time and magnitude to match SN 2004aw at maximum. The data suggest a comparatively slow decline of SN 2004aw.
In Table 5 the most important photometric properties of SN 2004aw are reported. One of them is the clear delay of maximum light in the red with respect to the bluer bands, which is highlighted by a dotted line in Fig. 2. Between the maxima in the B and I bands, for instance, there is an offset of 8.4 d. Fig. 3 reveals that the early B-band light curve of SN 2004aw (until ∼ 40 d after the B-band maximum) overlaps with that of SN 1998bw. The U band seems to fade slightly faster (very similar to SN 2002ap), whereas in the redder bands the decline of SN 2004aw is slower than that of SN 1998bw. Even with measurement uncertainties of up to 0.4 mag (see Table 2), the late-time light curves of SN 2004aw shown in Fig. 3 seem to deviate from those of the other two SNe. Measured relative to the peak, SN 2004aw appears between 0.4 mag (B band) and 0.9 mag (R band) more luminous than SN 1998bw at day +258, and a comparison with SN 2002ap yields similar results. This can be interpreted either as a measurement error due to a possible underlying compact source of light in the host galaxy, or as a real effect, making SN 2004aw a very slowly declining SN. The fact that even in the nebular spectra taken at similar epochs (Table 4), almost no trace of an underlying stellar continuum or narrow Hα emission can be detected (see Section 5.1), indicates that the galaxy background at the site of SN 2004aw is smooth enough to be properly subtracted. Hence, we tend to believe in our measurements and think that SN 2004aw truly declines more slowly than SNe 1998bw and 2002ap.
Main photometric parameters of SN 2004aw.a
| U | B | V | R | I | |||||||||||||||
|---|---|---|---|---|---|---|---|---|---|---|---|---|---|---|---|---|---|---|---|
| Apparent magnitude at maximum | 18.18 ± 0.15b | 18.06 ± 0.04 | 17.30 ± 0.03 | 16.90 ± 0.03 | 16.53 ± 0.03 | ||||||||||||||
| Absolute magnitude at maximumc | −17.79 ± 0.56b | −17.63 ± 0.48 | −18.02 ± 0.39 | −18.14 ± 0.34 | −18.18 ± 0.28 | ||||||||||||||
| Extinction | 1.80 ± 0.49 | 1.52 ± 0.41 | 1.15 ± 0.31 | 0.87 ± 0.24 | 0.54 ± 0.15 | ||||||||||||||
| Epoch of maximum relative to Bd | 0.0 | +2.7 ± 0.6 | +6.6 ± 0.6 | +8.4 ± 0.9 | |||||||||||||||
| Decline rate βe | 10.28 ± 0.60 | 6.96 ± 0.16 | 4.64 ± 0.12 | 3.20 ± 0.12 | 2.16 ± 0.12 | ||||||||||||||
| Decline rate of radioactive tailf | 1.35 ± 0.18 | 1.74 ± 0.22 | 1.36 ± 0.14 | 1.53 ± 0.09 | |||||||||||||||
| Δmg15 | 1.62 ± 0.25b | 1.09 ± 0.04 | 0.62 ± 0.03 | 0.41 ± 0.03 | 0.34 ± 0.03 | ||||||||||||||
| (U−B)0 | (B−V)0 | (V−R)0 | (R−I)0 | (V−I)0 | |||||||||||||||
| Colour at | −0.16 ± 0.16b | 0.35 ± 0.05 | 0.02 ± 0.04 | −0.03 ± 0.04 | −0.01 ± 0.04 | ||||||||||||||
| B maximumc | |||||||||||||||||||
A distance modulus μ= 34.17 mag (LEDA, but H0= 72 km s−1 Mpc−1) and a colour excess E(B−V) = 0.37 mag were adopted; bcalculated using the earliest data point in the U band, which is estimated to be within 2 d from maximum; cvalues corrected for interstellar extinction; dbased on a polynomial fit and overplotted light curves of other SNe Ic; the B-band maximum is on JD 245 3088.4 ± 0.5; eaverage decline rate in the time-interval 5–30 d past B-band maximum (in mag per 100 d); faverage decline rate in the time-interval 60–300 d past B-band maximum (in mag per 100 d); gdecline in magnitudes within 15 d from peak.
4.2 Near-IR light curves
To date, our knowledge of the behaviour of SNe Ic in the near-infrared (near-IR) is very limited. Only a few objects have ever been observed in the IR, and in most cases the coverage is rather poor. IR photometry at more than ∼5 epochs is available only for SN 2002ap (Nishihara et al. 2002; Yoshii et al. 2003). Given the paucity of IR observations, even our modest IR data set of SN 2004aw may shed some light on the behaviour of SNe Ic in this wavelength range.
As mentioned in Section 2.1, no colour corrections were applied to calibrate the JHK′ magnitudes of SN 2004aw presented in Table 3. This is a considerable source of uncertainty; moreover, the sparse sampling makes it difficult to check the self-consistency of the light curves, as can be seen in Fig. 4. The H and K′ light curves show a relatively flat behaviour with only a slight decline (≤ 0.3 mag) in the interval from +10 to +30 d. The J band seems to peak at about day +17, but we cannot exclude the fact that, because of a lack of colour corrections, the calibration error of some points is actually larger than that reported in Table 3. During the time-interval covered by our near-IR photometry, all optical bands show a significant decline, from about 0.6 mag in the I band to 1.7 mag in the U band. The different behaviour of the optical and the near-IR bands in this phase is responsible for the strongly increasing contribution of the near-IR to the total bolometric flux, which is discussed in Section 4.4.
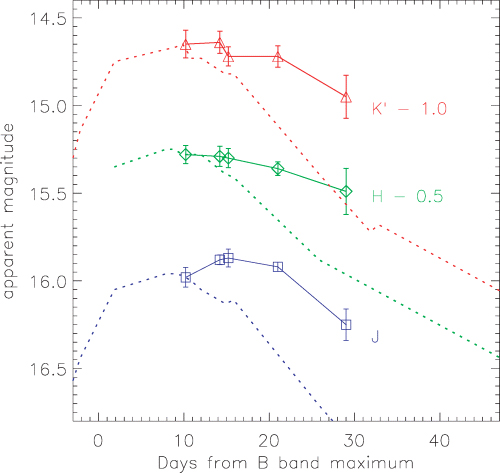
JHK′ light curves of SN 2004aw. For comparison, the JHK light curves of SN 2002ap are also displayed (dotted lines, Yoshii et al. 2003). A global shift, besides the one mentioned in the figure for each band, has been applied to the data of SN 2002ap to roughly match SN 2004aw at +10 d.
To date, SN 2002ap is the only SN Ic with good temporal coverage of the near-IR bands at early phases (Nishihara et al. 2002; Yoshii et al. 2003), making a systematic comparison of SNe Ic in this regime difficult. At least between day +10 and day +30, SN 2002ap and SN 2004aw show substantial differences in their evolution, as can be seen in Fig. 4. While SN 2004aw exhibits an almost plateau-like behaviour, the JHK′ light curves of SN 2002ap fade with rates similar to the optical bands, ranging from 0.75 to 1.0 mag within these 20 d. Given the fairly similar optical light curves of these two SNe, the differences in the near-IR are a surprising result.
4.3 Colour evolution
Fig. 5 presents the evolution of the intrinsic B−V, V−R and V−I colours for SNe 2004aw, 1998bw, 2002ap and 1994I. The extinction values reported in Sections 3 and 4.4 were used to deredden the colour curves. Starting before maximum light, the colours of all objects become monotonically redder for more than two weeks. Later on, the differences among the different objects become more distinct.
![Colour evolution of SNe 2004aw, 1998bw, 2002ap and 1994I. The curves have been dereddened according to the values reported in Section 4.4[in particular E(B−V) = 0.30 mag for SN 1994I] and shifted in time to match the B-band maximum of SN 2004aw. The vertical dotted lines at +18 d mark the epoch suggested to be used for dating SNe Ic (see Section 4.3).](https://oup.silverchair-cdn.com/oup/backfile/Content_public/Journal/mnras/371/3/10.1111/j.1365-2966.2006.10776.x/2/m_mnras0371-1459-f5.jpeg?Expires=1750267013&Signature=UIZLfTuNOEireFLC1dr07cn~H9Vurz0JyfvBZ9jfJsn9i0mKoacWQ8LsVILI9FilgziTn6s9XcUKrJsealV7M~NIredMa7soi1G0Sj0FaxJ8OZazrjpHIGMb5zYO~s4GWvN9o5F6XqHdU8b00VJgjRXdnmTurSIG8hTBOWMSpc4t71E-WMicIrBeKBmFME8INX8Ia5vjxy8Jz6MHADVhuZ6bjkObigXp616tKSgqfadNoGPz2FvM9WIRzAnYEz8TFtObYwBYoDz9V7~RbV6qedosOz2m64tQW1ETzlZEz0qb~s72n6TbVdslerBppmoudKRsYR3BDlSMDVefMJrYFw__&Key-Pair-Id=APKAIE5G5CRDK6RD3PGA)
Colour evolution of SNe 2004aw, 1998bw, 2002ap and 1994I. The curves have been dereddened according to the values reported in Section 4.4[in particular E(B−V) = 0.30 mag for SN 1994I] and shifted in time to match the B-band maximum of SN 2004aw. The vertical dotted lines at +18 d mark the epoch suggested to be used for dating SNe Ic (see Section 4.3).
The B−V colours of SN 1994I and SN 2002ap are reddest at about +15 to +20 d, and then become bluer again. This also holds for SN 1998bw, although here the evolution after the red peak is much slower. In contrast, in SN 2004aw this epoch marks the onset of a plateau of fairly constant B−V colour lasting at least until +50 d. During this plateau phase, SN 2004aw is typically 0.3–0.4 mag redder than SN 1998bw. The V−R colour evolution of SN 2004aw and SN 2002ap is very similar, whereas SN 1994I becomes increasingly bluer after day +18. SN 1998bw shows the bluest V−R colour until +15 d, but the subsequent behaviour cannot be evaluated due to lack of information in the R band after +30 d. At +30 d, SN 2004aw and SN 2002ap are redder by ∼0.2 mag than SN 1994I and SN 1998bw. Finally, SN 2004aw shows the reddest V−I colour until day +18. After this epoch, SN 1998bw and SN 2004aw still become redder, but with a reduced slope. SN 2002ap takes another 10 d to reach this inflection point, while the V−I colour of SN 1994I remains constant between +20 and +50 d. At +30 d, there is a clear colour separation between the objects with a V−I of 0.3, 0.5, 0.8 and 0.9 mag for SN 1998bw, SN 1994I, SN 2004aw and SN 2002ap, respectively.
In all the colours studied here, SN 1998bw appears to be bluer than SN 2002ap and SN 2004aw during the entire post-maximum phase. After day +20, the same holds for SN 1994I, but in this case this may be due to contamination from blue stars in the host galaxy (see also Section 5.2). Remarkably, the SNe of our sample all show a peak or a change in the slope of their colour curves at about 15 to 20 d after B-band maximum. If the generality of such behaviour can be confirmed using a significantly larger sample of well-monitored SNe Ic, this may provide an interesting, extinction-independent new tool to determine the phase of SNe Ic and BL-SNe when maximum light was missed by not more than a few days.
4.4 Absolute magnitudes, bolometric light curve
In order to compare the absolute peak magnitudes, the values reported in the literature should first be homogenized with respect to the treatment of distance and extinction. Whenever available, we preferred a Cepheid distance modulus. When a kinematical distance modulus had to be used, it was computed using the host-galaxy recession velocity corrected for the Local Group infall on to the Virgo cluster and H0= 72 km s−1 Mpc−1. In most cases, extinction estimates from the original papers were adopted, but for SN 1994I a more recent result provided by Sauer et al. (2006) was used.
Comparing the absolute magnitudes, SN 2004aw seems to be a fairly bright, but not outstanding object. Type Ic SNe exhibit peak magnitudes in the V band from about −17 to beyond −19 (see e.g. Richardson, Branch & Baron 2006). With MV=−19.13 mag[Galama et al. 1998, μ= 32.76 mag, E(B−V) = 0.06 mag], the BL-SN 1998bw is one of the brightest core-collapse SNe ever observed. The broad-lined SN 2002ap, on the other hand, is comparatively faint at maximum with MV=−17.35 mag[Sharina, Karachentsev & Tikhonov 1996; Foley et al. 2003; Yoshii et al. 2003, μ= 29.46 mag, E(B−V) = 0.09 mag], and with MV=−17.14 mag, the BL-SN 1997ef is not very luminous either [Garnavich et al. 1997a, b, c; Mazzali et al. 2002, μ= 33.54 mag, E(B−V) = 0.04 mag]. The peak absolute magnitudes of the so-called ‘normal’ SNe Ic seem to cover a similarly wide range. SN 1994I peaks at MV=−17.62 mag[Richmond et al. 1996; Sauer et al. 2006, μ= 29.60 mag, E(B−V) = 0.30 mag], SN 1999ex reaches −17.58 mag [Stritzinger et al. 2002, μ= 33.28 mag, E(B−V) = 0.30 mag], and SN 1992ar may have MV < − 20 mag (Clocchiatti et al. 2000). SN 2004aw (MV=−18.02 ± 0.39 mag) is a bit brighter than SN 1994I (and probably also the average of all SNe Ic), but not exceptionally luminous.
We have constructed a ‘quasi-bolometric light curve’ (see e.g. Nomoto et al. 1990) of SN 2004aw in the following way: first the U through I magnitudes were converted into monochromatic fluxes and the spectral energy distribution (SED) was interpolated linearly. Then the SED was integrated over frequency, assuming zero flux at the integration limits, which are given by the blue edge of the U band and the red edge of the I band. In Fig. 6(a), we compare the bolometric curve of SN 2004aw with those of SN 1998bw, SN 2002ap and SN 1994I. We note a wide spread in peak luminosities, with SN 1998bw being the brightest object and SN 2004aw intermediate. The differences in the decline rates observed in different bands are clearly reproduced in the bolometric light curves.
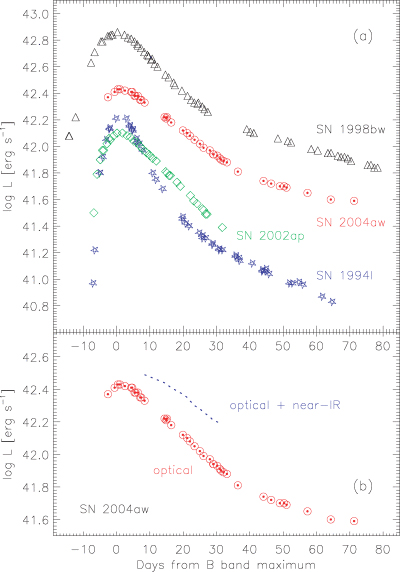
(a) Quasi-bolometric light curves of SNe 2004aw, 1998bw, 2002ap and SN 1994I, computed including the U-through-I-band fluxes. The distance and extinction values reported in Section 4.4 have been adopted. (b) Comparison of the quasi-bolometric light curves of SN 2004aw with (dotted line) and without the contribution of the JHK′ bands. For phases earlier than +10 d and later than +30 d, no near-IR photometry is available.
Taking into account the contribution of the JHK′ bands (see Section 4.2 and Table 3) makes a significant difference in the bolometric light curves, as can be seen in Fig. 6(b). Between +10 and +30 d the near-IR contribution increases from ∼31 to ∼45 per cent, demonstrating that a considerable portion of the bolometric flux is released in these bands. Unfortunately, no near-IR photometry is available for epochs earlier than +10 d or later than +30 d, so that the corrections to the U-through-I light curve cannot be obtained for all phases. Yoshii et al. (2003) estimated that in SNe Ic, wavelength regions other than the optical and near-IR contribute much less than 10 per cent to the total bolometric flux. Therefore, ignoring the contributions from these frequencies does not lead to a significant underestimate of the true bolometric luminosity.
5 SPECTRAL EVOLUTION
5.1 Sequence of optical spectra
The spectroscopic evolution of SN 2004aw from maximum light to +65 d is densely covered. During this period a continuum is present in all the spectra, so that the photospheric phase lasts for at least two months from maximum. However, after approximately one month the emission component of the Ca ii near-IR triplet starts to grow, and in the last two spectra of this sequence first hints of forbidden O i and Ca ii emission lines become visible, marking the onset of the transition to the nebular phase. In addition, three entirely nebular spectra at epochs between 236 and more than 400 d past maximum have been obtained. The complete spectroscopic evolution is presented in Fig. 7.
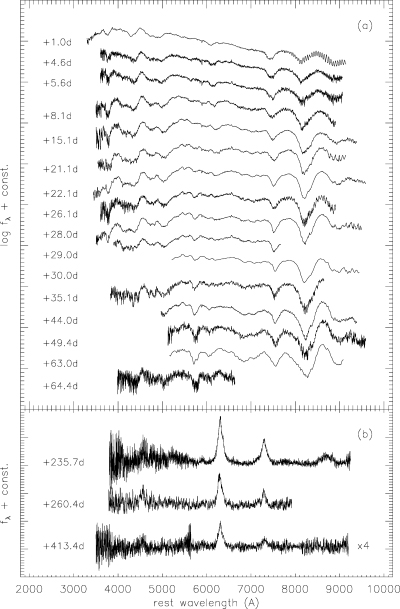
Spectroscopic evolution of SN 2004aw. Epochs are given with respect to B-band maximum (JD = 245 3088.4). The spectra were checked against the photometry, transferred to the SN rest frame assuming a recession velocity of 4900 km s−1 (inferred from the position of a faint host galaxy Hα line visible in most spectra), and dereddened assuming E(B−V) = 0.37 mag. (a) Series of photospheric spectra from maximum light to about two months later, shown with a logarithmic scale. The day +5.6 spectrum is a combination of the two spectra taken at Siding Spring and Asiago within half a day. (b) Nebular spectra, plotted linearly. For better clarity, the day +413 spectrum was scaled up by a factor of 4. The increased noise in this spectrum around 5500 Å marks the overlap region of the blue and red channels of Keck/LRIS, with low signal in both of them.
The first spectrum of this sequence, obtained one day after B-band maximum, is characterized by a blue continuum and P Cygni features of Ca ii (H&K and the near-IR triplet), O iλ7774, Fe ii blends and Mg iiλ4481. Also, Si iiλ6355 and possibly C iiλ6580 and Na i D can be seen. He iλ5876 might be blended with Na i D, although other optical He i lines cannot be detected. During the first week after maximum (covered by the first four spectra), the evolution is significant. Within a few days the flux in the blue part decreases dramatically, the Ca ii near-IR triplet becomes stronger, and the absorption troughs centred at 4200 and 4800 Å develop the characteristic ‘W’-shaped profile that is observed in many Type I SNe around and after maximum.
Later on the spectra evolve more slowly, and during the following month the main changes consist of a further suppression of the flux in the blue, an increasing strength of the emission component of the Ca ii near-IR triplet and an increasingly distinct Na i D absorption. The Si II line, on the other hand, disappears [Clocchiatti et al. (1997) mentioned the possibility that it might be filled by the emerging [O i]λλ6300, 6364 emission lines]. Towards the end of our early-time follow-up, approximately 65 d after maximum, SN 2004aw still shows a well-developed continuum, with only hints of the characteristic nebular emission lines superimposed.
About 170 d later (at a phase of +236 d) the continuum has entirely disappeared, and the spectrum is dominated by forbidden emission lines of [O i]λλ6300, 6364 and [Ca ii]λλ7291, 7323, possibly blended with [O ii]λλ7320, 7330. Emissions of the Ca ii near-IR triplet, Mg i]λ4571 and blended [Fe ii] lines near 5000 Å are also visible. While the weak feature near 6000 Å could be a residual of Na i D, the faint emission line near 4000 Å can tentatively be attributed to [S ii]λ4069. The peaks of both [O i]λλ6300, 6364 and [Ca ii]λλ7291, 7323/[O ii]λλ7320, 7330 are sharp and show a narrow core. Between 236 and 413 d past maximum only minor changes occurred, the most obvious being the disappearance of the permitted emission of the Ca ii near-IR triplet. The strength of the [Ca ii] relative to [O i] also declines.
5.2 Comparison to optical spectra of other SNe Ic
The spectral evolution of SN 2004aw is consistent with that of other Type Ic SNe. However, the spectroscopic variety among the members of this class is large, especially when also the broad-lined supernovae are taken into account. It is the aim of this section to examine the differences among SNe Ic with particular attention to SN 2004aw.
Figs 8–10 show a comparison of the spectra of SN 2004aw with those of SN 1994I (Filippenko et al. 1995) and the BL-SNe 1998bw (Patat et al. 2001), 2002ap (Kawabata et al. 2002; Foley et al. 2003), 1997ef (Mazzali et al. 2000; Matheson et al. 2001) and 2003jd (Valenti et al., in preparation) at maximum light, two weeks later, and six to nine weeks past maximum, respectively. At all three epochs SN 1998bw is an outstanding object, exhibiting comparatively broad and shallow features and strong line blending due to a large amount of ejected material at extremely high velocities. SNe 2002ap and 1997ef (and to a lesser degree SN 2003jd) are similar to SN 1998bw at early epochs (Fig. 8), but then evolve towards more typical (i.e. SN 1994I-like) Type Ic spectra (see Fig. 10). Compared with SNe 1994I and 2004aw around maximum light, SNe 1998bw, 1997ef and 2002ap show a clear flux deficit shortward of ∼5000 Å due to strong line blanketing. Worth mentioning is also the difference in the exact position of the broad emission feature lying between 5000 and 5500 Å in all maximum-light spectra. In SNe 2004aw, 2003jd and 1998bw its peak is located at ∼5120 Å (indicated by a vertical line in Fig. 8), whereas in SNe 1994I, 1997ef and 2002ap it is shifted by about 200 Å to the red.
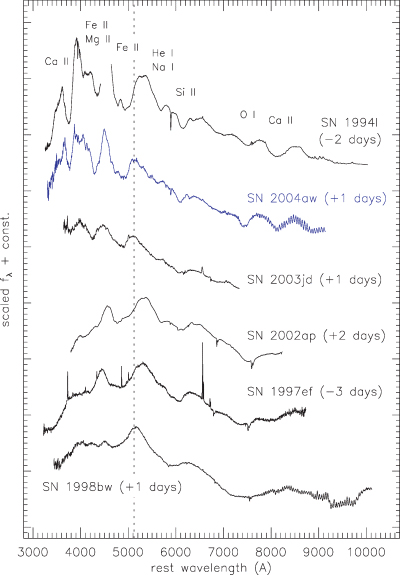
Comparison of spectra of SNe Ic close to maximum light. The spectra have been dereddened assuming B−V colour excesses of 0.30 mag for SN 1994I (Sauer et al. 2006), 0.37 mag for SN 2004aw, 0.14 mag for SN 2003jd (Valenti et al., in preparation), 0.04 mag for SN 1997ef (only Galactic extinction, Schlegel et al. 1998), 0.09 mag for SN 2002ap (Yoshii et al. 2003) and 0.06 mag for SN 1998bw (Galama et al. 1998). The order of plotting suggests increasing ejecta velocities from top to bottom.
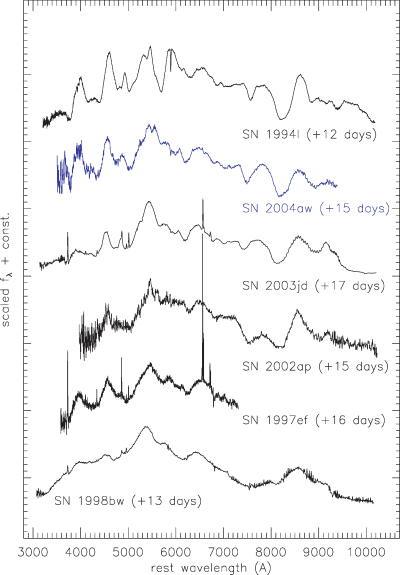
The same as Fig. 8, but two weeks after maximum light.
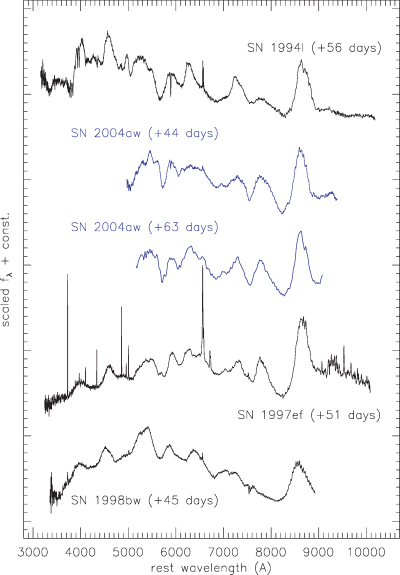
The same as Fig. 8, but six to nine weeks after maximum light.
By +12 d (see Fig. 9), Na i D (possibly blended with He i, see Filippenko et al. 1995; Clocchiatti et al. 1996) is one of the dominant features in the spectrum of SN 1994I, whereas it is still rather weak in all the other objects in the figure. At similar epoch, it is also weak in SNe 1983V (Clocchiatti et al. 1997) and 1987M (Filippenko et al. 1990) which are not shown here. Moreover, the emerging nebular emission features of [O i]λλ6300, 6364 and [Ca ii]λλ7291, 7323 are clearly seen in SN 1994I at +56 d, while at best only a hint of them can be detected in the spectra of the other SNe at comparable phases (see Fig. 10). This suggests that SN 1994I underwent relatively fast spectral evolution.
The spectrum of SN 2004aw shows similarities to both SN 1994I and the group of moderate BL-SNe represented by SNe 1997ef, 2002ap and 2003jd. At maximum (Fig. 8), the width of the lines of SN 2004aw is well matched by SN 1994I and is significantly smaller than in all BL-SNe except SN 2003jd. However, SN 2004aw does not follow the fast evolution of SN 1994I, and hence at later times (Figs 9 and 10) it bears a closer resemblance to the spectra of the BL-SNe 2003jd and 1997ef. Also, the Na i D feature is much weaker than that in SN 1994I at all epochs.
All nebular spectra shown in Fig. 11 have in common that [O i]λλ6300, 6364 is the strongest feature. However, the shape of this feature reveals important differences: in SNe 2004aw, 1998bw and 2002ap the line has a sharp, narrow core, whereas in SN 1994I its top is somewhat rounded. In SN 2003jd, the feature even exhibits a double-peaked structure. The impact that these differences have on our picture of the explosions is discussed in Section 6. In SN 2004aw, the [Ca ii]λλ7291,7323/[O ii]λλ7320,7330 emission shows a sharp peak, in contrast to the other SNe where the top of this feature is flat or rounded. Mg i]λ4571 is particularly strong in SN 2002ap, and rather weak in SN 2004aw. The [Fe ii] lines near 5000 Å are more prominent in SN 1998bw than in other SNe of this sample.
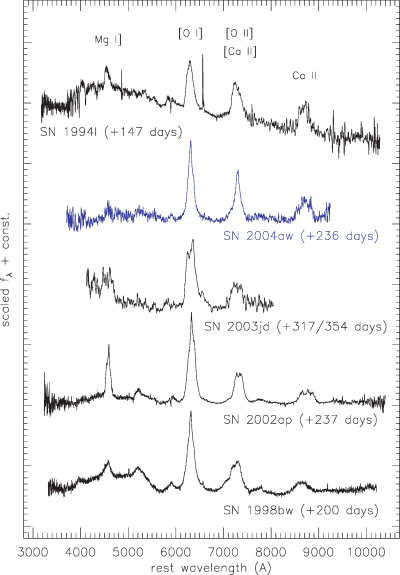
The same as Fig. 8, but five to 12 months after explosion. The spectrum of SN 2004aw was smoothed with a box size of 10 Å. The spectrum of SN 2003jd is a combination of two spectra taken 317 and 354 d after maximum, respectively. SN 1994I is heavily contaminated by light from the underlying galaxy.
5.3 Near-IR spectroscopy: identification of He i lines?
Few SNe Ic have been followed spectroscopically in the IR. Only for two of them are the data public: SN 1999ex (actually an object intermediate between Type Ib and Ic; Hamuy et al. 2002) and the highly energetic BL-SN 1998bw (Patat et al. 2001). However, near-IR spectroscopy may turn out to be a powerful tool for investigating important properties of the progenitor stars of stripped-envelope core-collapse SNe. Although it is commonly accepted that SNe Ic originate from massive stars that have lost most of their H and He envelope, several questions (e.g. concerning the exact mechanism of mass loss) are yet unresolved. Some of these issues may be effectively addressed by a possible detection of He in the spectra of SNe normally classified as Type Ic. Since the He i features in the near-IR are much stronger than those in the optical regime, IR spectroscopy may play a key role.
Fig. 12 shows a combination of an optical and two IR spectra of SN 2004aw 29 d past maximum, covering the spectral range 0.35–2.40 μm. Among the most prominent features is an absorption at 1.04 μm. The origin of this absorption, which is also seen in other SNe Ic, has been the subject of some debate. For SN 1994I, this feature was originally attributed to He i (Filippenko et al. 1995; Clocchiatti et al. 1996). However, Baron et al. (1999) disfavoured an identification with He i because it would require other optical lines from this ion to show up in the spectrum as well, which is not seen. Millard et al. (1999) discussed alternative origins for this feature such as Si i and C i, based on line identifications from the highly parametrized spectral synthesis code synow.
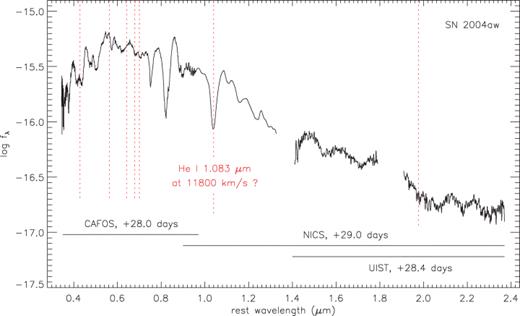
Combined optical and near-IR spectrum of SN 2004aw taken four weeks after B-band maximum. In the bottom of the figure the ranges of the three individual spectra are indicated. Vertical dotted lines mark the expected position of strong He i features for an expansion velocity of 11 800 km s−1.
Sauer et al. (2006) found that the absorption might be caused by a mix of some He i and C i. The consistent simulation of He i requires non-thermal excitation and ionization processes from fast electrons caused by Compton scattering of γ-ray photons from 56Ni and 56Co decay. Without those processes, the excitation of He i at the temperatures present in the ejecta is too low to cause any significant absorption (Lucy 1991). Sauer et al. (2006) used a simple estimate of these excitations by increasing the optical depth in He i by hand. Although this method does not provide a self-consistent description of the formation of the helium lines, their estimate shows that it is unlikely that He i alone can form such a broad absorption without showing a trace of other lines of this ion.
In contrast to SN 1994I, where no observation of the IR wavelength bands is available, SN 2004aw provides the opportunity to place a tighter constraint on the contribution of the He i 1.083-μm line to the 1.04-μm absorption, because the presence of significant amounts of He i should be detectable in the IR through the 2.058-μm line. The position of all strong He i lines at a velocity of 11 800 km s−1 is indicated in Fig. 12 by vertical dotted lines. There is no clear detection of a line at ∼1.98 μm, which provides strong evidence that the contribution of He i to the 1.04-μm absorption must indeed be small. In contrast to other helium lines, the wavelength region of this strong IR line is not crowded with lines from other ions. Mazzali & Lucy (1998) studied the formation of the proposed He i line in the spectra of the Type Ia SN 1994D using a full non-LTE description of this ion including the non-thermal excitations. They found that He i 2.058 μm clearly showed up as the second strongest line in their model spectra. Therefore, a detection should be possible if He i alone is responsible for the 1.04-μm feature. Based on IR observations of SNe 2000ew, 2001B and 2002ap, Gerardy et al. (2004) reached a similar conclusion.
Patat et al. (2001) dealt with the formation of the near-IR He i features in great detail, including a discussion of factors (intrinsic line strengths, level populations, non-thermal excitation and resonance scattering enhancement of the He i 1.083-μm line) which may influence the ratio of the EWs of He i 2.058 μm to He i 1.083 μm (hereafter  ). They conclude that a
  of less than 1 is not unexpected, consistent with a putative detection of He i in the near-IR spectra of SN 1998bw at an observed linewidth ratio of ∼1/3.
However, values of  close to 1 seem to be feasible, as confirmed by SN 1999ex, an intermediate case between SN Ib and SN Ic with weak He i lines visible in the optical part of the spectrum. For this SN, three near-IR spectra were obtained by Hamuy et al. (2002). The latest one, at an epoch of 13 d after B-band maximum, is shown in Fig. 13, together with the spectrum of SN 2004aw at +29 d, two spectra of the BL-SN 1998bw (Patat et al. 2001) and one of the Type Ia SN 2002bo (Benetti et al. 2004b). The spectrum of SN 1999ex is the only one in which the lines near 1.04 and 2.00 μm are almost equally pronounced, suggesting
  if the 1.04-μm absorption is purely He i, or
  if also other elements contribute to it. In SN 2004aw only the feature at 1.04 μm is visible, which could be interpreted in two ways. The feature being predominantly formed by He i would require basic physical conditions near the photosphere to be substantially different from SN 1999ex in order to explain the much lower value of
  . Models clearly disfavour this option (see Mazzali & Lucy 1998). Alternatively, the physical conditions are similar, but the 1.04-μm absorption in SN 2004aw is mainly formed by ions other than He i.
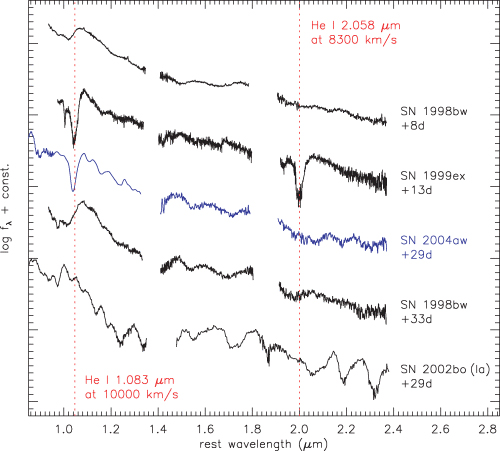
Near-IR spectra of SNe 2004aw (Type Ic), 1999ex (Type Ib/c), 1998bw (BL-SN) and 2002bo (Type Ia) at epochs from one to five weeks after B-band maximum. The position of the minima of two pronounced He i features in SN 1999ex is marked by vertical dotted lines. For references see text.
Apart from the overall narrower features in SN 2004aw, the near-IR spectrum of this object is quite similar to that of SN 1998bw at a comparable epoch. This especially holds for the H band. However, in the K band SN 2004aw is somewhat reminiscent of SNe Ia, although all features are much less pronounced than those in SN 2002bo. Based on near-IR spectra of the Type Ia SN 1999ee at similar epochs, Hamuy et al. (2002) attributed this group of bumps to blends of iron-group elements. By contrast, the few near-IR spectra of SNe Ib/c available so far seem to be clearly dominated by intermediate-mass elements, even during the nebular phase (Oliva 1987; Gerardy et al. 2004).
5.4 Ejecta velocities
Although already partially discussed in the previous sections, it is worth taking a more detailed and quantitative look at the expansion velocities of different chemical species in SN 2004aw. All velocities have been determined by fitting a Gaussian profile to the absorption component of the P Cygni features in the redshift-corrected spectra and measuring the blueshift of the minimum. The outcome of this procedure is a rough estimate of the expansion velocities of the shells where the individual lines predominantly form. The main caveat of this method is the fact that most features are actually blends of several lines, especially when the ejecta velocities are high. In that case, a shift of the absorption minimum with time could also be produced by a change in the relative strength of different lines contributing to the same feature, and hence does not need to be connected to real velocity evolution due to a receding photosphere.
Fig. 14 shows the velocity evolution of Si iiλ6355, Na i D, O iλ7774, and the Ca ii near-IR triplet in SN 2004aw. At all epochs, Si ii has the lowest and Ca ii the highest expansion velocities. The velocities of O i and Na i D are intermediate and always similar to each other but Na i D shows a faster decline in the early phases until 20 d past maximum. However, for this line possible contamination with He iλ5876 has to be considered. This may be particularly important at maximum and soon after when the feature is generally weak, and could partially be responsible for the apparently different velocity evolution at early times.
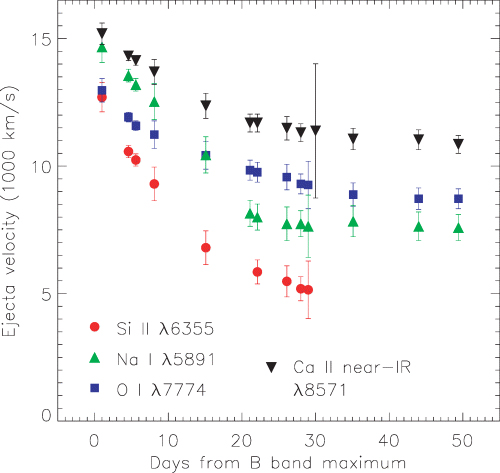
Velocity evolution of different spectral lines of SN 2004aw.
6 DISCUSSION
In Section 4.1 and Fig. 2, we noted that the delay of maximum light in the red with respect to bluer bands is one of the remarkable properties of SN 2004aw. The offset of 8.4 d between the B- and I-band maximum (Table 5) is significantly longer than that observed not only in the ‘prototypical’ Type Ic SN 1994I (1.88 d; Richmond et al. 1996), but also in the Type Ib/c SN 1999ex (6.1 d; Stritzinger et al. 2002) and the BL-SNe 1998bw (3.5 d; Galama et al. 1998) and 2002ap (5.59 d; Foley et al. 2003).
Light curves of all SNe Ic have in common that neither a plateau with constant luminosity as in SNe IIP, nor a rebrightening and secondary maximum in the near-IR bands as in SNe Ia, is present. Nevertheless, their exact shape, and in particular the early decline rate, varies a lot for the different SNe Ic. Some authors have proposed a bimodal distribution (e.g. Clocchiatti 1995; Clocchiatti et al. 2000, and references therein), dividing Type Ic SNe into slow and fast decliners. Accordingly, SNe 1987M (Filippenko et al. 1990) and 1994I (Yokoo et al. 1994; Tsvetkov & Pavlyuk 1995; Richmond et al. 1996) are prominent representatives of the fast declining group, whereas SNe 1983V (Clocchiatti et al. 1997) and 1990B (Clocchiatti et al. 2001), the Type Ib/c SN 1999ex (Stritzinger et al. 2002) and the BL-SNe 1998bw (Galama et al. 1998; McKenzie & Schaefer 1999; Patat et al. 2001; Sollerman et al. 2002), 2002ap (Foley et al. 2003; Pandey et al. 2003b; Yoshii et al. 2003; Tomita et al. 2006), 1997ef (Garnavich et al. 1997a, b, c; Mazzali et al. 2004) and 1997dq (Mazzali et al. 2004) belong to the class of slow decliners. However, Fig. 15, which compares the light curves of SN 2004aw with those of other SNe Ic, suggests instead that a continuous distribution of decline rates might be a more appropriate description (see also figs 4 and 6 of Richardson et al. 2006 for a larger sample).
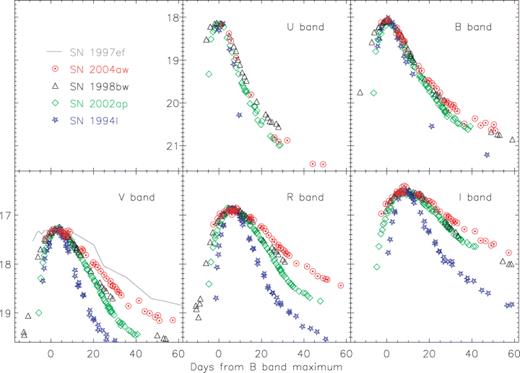
Light curves of SN 2004aw compared with those of SNe 1998bw, 2002ap, 1994I and 1997ef (see text for references). As in Fig. 3, the latter have been shifted in time and magnitude to match SN 2004aw at maximum.
SN 2004aw is one of the slowest decliners of all SNe Ic, slower than SN 1998bw and SN 2002ap. Only SN 1997ef and SN 1997dq (the latter is not included in Fig. 15) fade even more slowly, with a decline rate in the radioactive tail that follows the radioactive decay of 56Co, indicating little or no γ-ray escape (Mazzali et al. 2004). On the other hand, the much faster decline of SN 1994I in all bands is apparent, and quantitatively demonstrated by its larger Δm15[Δm15(B) = 2.07 for SN 1994I versus 1.09 for SN 2004aw; see Richmond et al. (1996) and Table 5]. Since the width of the light-curve peak is, assuming the same kinetic energy per unit mass for the two SNe, closely related to the ejecta mass (with the SN with higher ejecta mass declining more slowly), the comparison of SNe 2004aw and 1994I suggests that the progenitor of SN 2004aw was significantly more massive than that of SN 1994I. We address this topic in more detail in Section 6.2.
Interestingly, the strongly different decline rates of the light curves have no direct impact on the colour evolution of the four SNe included in Fig. 5. The differences between these objects, emphasized in Section 4.3, appear rather random, and no correlation between the light-curve decline rates and either the absolute values of the colours or their time-evolution can be established.
In general, diversity seems to be characteristic of SNe Ic. Correlations between observable parameters – if they exist – are subtle and hence difficult to establish from the small sample of objects available to date. For example, from the bolometric light curves in Fig. 6(a) we find no simple correlation between the brightness at peak and the decline rate as in Type Ia SNe (e.g. Phillips et al. 1999). Furthermore, we have no evidence that the expansion velocity of the ejecta and the peak luminosity of a Type Ic SN are related, i.e. BL-SNe might generally be no brighter than ‘normal’ SNe Ic. It is true that SN 1998bw not only has extremely high ejecta velocities, but also is one of the most luminous core-collapse SNe ever found. In contrast, however, as seen in Section 4.4, SNe 2002ap and 1997ef are comparatively faint and at maximum even less luminous than the normal low-velocity SNe 1994I, 1999ex and 2004aw.
A comparison of SNe 1994I and 1997ef could lead to the conclusion that the speed of the spectroscopic evolution of an SN Ic and the decline rate of its light curves might be somehow related. SN 1994I shows rapidly fading light curves and a comparatively fast spectral evolution (see Fig. 15 and Section 5.2), whereas in SN 1997ef a very slow light-curve decline comes along with an unusually persistent continuum in the spectra (Mazzali et al. 2004). However, hopes of a useful correlation are diminished by the Type Ic SN 1990B (Clocchiatti et al. 2001), which exhibited slowly declining light curves yet a fast spectroscopic evolution.
In Section 5.2, we showed that from a spectroscopic point of view SN 2004aw shares properties with both the group of so-called ‘normal’ SNe Ic (e.g. SNe 1983V, 1990B and of course 1994I) and the moderate BL-SNe 1997ef, 2002ap and especially 2003jd. This intermediate position – together with the wide variety of characteristics among BL-SNe themselves – gives rise to the question of whether BL-SNe actually form a distinct subclass, or if it is more appropriate to think of a continuity of properties from ordinary low-velocity SNe Ic to the most powerful events like SN 1998bw.
An idea to explain the origin of the observed diversity has been to assume that broad-lined SNe are highly aspherical, jet-driven events (some of them connected to a GRB), while ordinary SNe Ic represent more spherical explosions (Mazzali et al. 2005b). In order to verify this picture, the examination of nebular spectra is of particular interest, as they provide an insight into the innermost layers of the ejecta and the geometry of the explosion. Mazzali et al. (2005b) discussed what GRB-related SNe may look like when they are observed from directions almost perpendicular to the jet, so that the burst itself is not visible. Their prediction was that SNe seen along the jet axis have a narrow, sharp, single-peaked [O i]λλ6300, 6364 and strong and comparatively broad [Fe ii] emission features, while if viewed off-axis the [Fe ii] feature should be narrower and weaker, and the [O i] double-peaked. Finally, spherical explosions without a jet should produce a nebular [O i] line with a flat or rounded top.
As can be seen from Fig. 11, SN 1998bw fits well into the scenario of a GRB-SN viewed fairly along the jet axis, consistent with the detection of the spatially and temporally coincident GRB 980425. SN 2003jd exhibits a double-peaked [O i] line, indicating that it might be a GRB-SN viewed well off-axis (Mazzali et al. 2005b, but see also Soderberg et al. 2006). With its rounded tops of the emission peaks, SN 1994I might represent a rather spherical explosion. SN 2002ap and SN 2004aw show the same sharp [O i] line core as SN 1998bw, but in both cases no GRB was detected. Following the arguments of Maeda et al. (2002), Mazzali et al. (in preparation) and Tomita et al. (2006), the observed line profiles require both explosions to be strongly asymmetric, but maybe the jet was too strongly contaminated by baryons to trigger a GRB (Tominaga et al. 2004). However, this still does not explain the completely different kinetic energy per unit mass in the outer ejecta of SN 2004aw and SN 2002ap, as indicated by the significantly different linewidths at early phases.
6.1 Search for an associated GRB
In order to probe the possible association of SN 2004aw with a GRB the data of the InterPlanetary Network (IPN6) of high-energy satellites (see e.g. Hurley et al. 1999) were examined in the period ut March 2–17, i.e. from about 7 to 22 d prior to maximum light in B. At that time the IPN involved six spacecraft (Konus-Wind, HETE, Mars Odyssey, RHESSI, RXTE and INTEGRAL), securing nearly isotropic coverage and almost 100 per cent duty cycle.
A total of seven confirmed GRBs (i.e. events observed by at least two experiments, and having GRB characteristic), plus three unconfirmed events (observed by a single instrument, but likely being genuine GRBs and not particle-induced events) were identified (K. Hurley, private communication). For six out of these 10 candidates, the localization through triangulation was sufficiently precise to exclude a spatial association with SN 2004aw. For the remainder (two confirmed and two unconfirmed bursts), there was at best a very coarse localization (excluding only 30–85 per cent of the sky). Within this limited accuracy the four events are all consistent with SN 2004aw, although the probability that this is by chance is very large.
Hence, the result of the search remains rather inconclusive, as an association of SN 2004aw with a GRB can be neither firmly established nor definitely excluded. Assuming that none of the unconfirmed GRBs was associated with SN 2004aw, a rough upper limit of 10−6 erg cm−2 can be set on the fluence of a possible accompanying GRB in the energy range 25–150 keV. However, depending on the spectrum and time history of the burst, the fluence threshold could vary by an approximate factor of 5 in either direction.
6.2 Mass of the ejecta
In order to roughly estimate the total mass of the ejecta of SN 2004aw, we make use of an analytical description of the peak of the light curve developed by Arnett (1982). The model assumes spherical symmetry, a homologous expansion, no mixing of 56Ni, a constant optical opacity κopt, radiation-pressure dominance and the applicability of the diffusion approximation for photons, which restricts it to early phases when the density is sufficiently high to make the ejecta optically thick. In this model, the time-evolution of the SN luminosity is given by
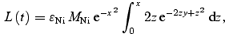
where x≡t/τm, y≡τm/2τNi and ɛNi=QNi/(mNiτNi).
Here QNi is the energy release per 56Ni decay (1.73 MeV, not taking into account the contribution of neutrinos, for which the environment is optically thin), and τNi is the e -folding time of the 56Ni decay (8.77 d). The effective diffusion time τm determines the width of the peak of the bolometric light curve and is given by
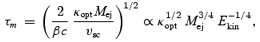
where vsc is the velocity scale of the homologous expansion and β is an integration constant. Given a certain light-curve shape (i.e. a certain value of τm), equation (3) allows for a family of photometrically degenerate models with different combinations of Mej and Ekin. By specifying Ekin or, alternatively, the velocity of the ejecta, this degeneracy can be broken, and an estimate of the total ejecta mass becomes feasible. For our mass estimate we make use of equation (3) and compare SN 2004aw to SN 1994I, for which the relevant parameters are well known from detailed modelling (Nomoto et al. 1994). We do not consider any differences in the mean optical opacities κopt.
The comparison to SN 1994I starts from the observation that the ejecta velocities of these two objects are quite similar (vsc,04aw≈vsc,94I), but that the widths of the bolometric light curves are significantly different. Taking τm as the time from peak of the bolometric light curve to the moment when the luminosity is equal to 1/e times the peak luminosity (which is equivalent to a decline of 1.1 mag), we find that τm,04aw/τm,94I≈ 2.0–3.0 (the large uncertainty arises from the unknown effect of the bolometric corrections when considering also the near-IR bands). Assuming vsc,04aw≈vsc,94I, we can solve equation (3) for Mej,04aw and obtain
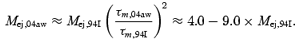
With Mej,94I= 0.9 M⊙ (Nomoto et al. 1994), the range of possible ejecta masses for SN 2004aw turns out to be 3.5–8.0 M⊙. The corresponding kinetic energy, computed via vsc,04aw≈vsc,94I with Ekin,94I≈ 1.0 × 1051 erg (Nomoto et al. 1994), would range from 3.5 to 9.0 × 1051erg. If instead Mej,94I= 1.2 M⊙ as suggested by Sauer et al. (2006) was adopted, both the inferred ejecta mass and the kinetic energy of SN 2004aw would increase by about 30 per cent.
Hence, this comparison suggests an ejecta mass for SN 2004aw of at least 3.5 M⊙. This value is substantially larger than that found for SN 1994I, and even larger than that for the BL-SN 2002ap (for a comparison of explosion properties see Table 6). At the same time the kinetic energy is less enhanced with respect to SN 2002ap, consistent with the ejecta velocities in SN 2004aw being significantly lower than those in SN 2002ap.
Comparison of parameters of SNe Ic.a
| SN | MV (mag) | Ekin (1051 erg) | Mej (M⊙) | MNi (M⊙) | References |
|---|---|---|---|---|---|
| 1994I | −17.62 | 1 | 0.9 | 0.07 | Richmond et al. 1996; Nomoto et al. 1994 |
| 2004aw | −18.02 | 3.5–9.0 | 3.5–8.0 | 0.25–0.35 | This paper |
| 2002ap | −17.35 | 4 | 3 | 0.08 | Foley et al. 2003; Mazzali et al. 2002; Tomita et al. 2006 |
| 1997ef | −17.14 | 19 | 9.5 | 0.16 | Mazzali et al. 2000, 2004 |
| 1998bw | −19.13 | 30 | 10 | 0.70 | Galama et al. 1998; Nakamura et al. 2000 |
For all SNe except SN 2004aw, the values for kinetic energy, ejecta mass and nickel mass have been inferred from light-curve and spectral models.
Equation (2) can also be utilized to estimate the mass of 56Ni synthesized in the explosion. For this purpose, the formula was resolved for MNi and evaluated at the time of peak brightness. The effective diffusion time τm was determined as described above, and for L the value from our quasi-bolometric (U through I) light curve was adopted. To account for the necessary corrections to the true bolometric luminosity and to ensure that the zero-point of the Arnett (1982) relation is properly fixed, we repeated these steps for SNe 1994I, 1998bw and 2002ap, and introduced an additional factor of 1.1 in equation (2) that enabled us to better reproduce the Ni masses reported in Table 6 for these objects. What we finally find for SN 2004aw is a 56Ni mass of about 0.30 ± 0.05 M⊙, well above the average for core-collapse supernovae.
Given the comparatively high ejecta mass and Ni production in SN 2004aw, it is interesting to discuss which physical parameters of the progenitor star are crucial for accelerating the ejecta to the high velocities observed in BL-SNe. If we assume that the ejecta mass is correlated with the total mass of the progenitor star just before core collapse (which is surely true if the compact remnant is a neutron star with a strict upper mass limit), then the progenitor of SN 2004aw was probably more massive than that of SN 2002ap. But even if the possibility of black hole formation in at least one of the two objects is taken into account, the probability that fall-back of matter is sufficiently strong to invert the progenitor mass versus ejecta mass relation is low. This almost certainly rules out the progenitor mass as the only criterion for producing broad-lined SNe. Since BL-SNe are supposed to be highly aspherical jet-like explosions, it is plausible that the angular momentum of the progenitor star (or the progenitor system in case of a binary) will also play an important role (see e.g. Woosley & Heger 2006, and references therein).
7 SUMMARY AND OUTLOOK
We have presented a comprehensive set of optical and near-IR data of the Type Ic SN 2004aw. The light curves of this object, both in the optical and the IR, show a peak broader than that observed in most SNe Ic so far. Also, the decline during the radioactive tail is rather slow, suggesting an enhanced trapping of γ-rays with respect to the majority of SNe Ic. Both findings require a relatively large ejecta mass, which in the previous section was determined to be 3.5–8.0 M⊙. With absolute peak magnitudes of about −18 in all optical bands, SN 2004aw seems to be a bit brighter than the average of all SNe Ic, but still more than 1 mag underluminous with respect to the very bright BL-SN 1998bw. The optical spectra show the typical lines found in most SNe Ic. Line blending is similar to that seen in spectra of SN 1994I and much weaker than in the BL-SNe, owing to normal ejecta velocities. The spectroscopic evolution is rather slow, making the moderate BL-SNe 1997ef and 2003jd a better match than SN 1994I a few weeks past maximum. The nebular [O i]λλ6300, 6364 line shows a sharp, narrow core, as would be expected for a highly aspherical explosion. Unfortunately, no final conclusion can be drawn concerning a possible association with a GRB, because the localization of some burst candidates is not sufficiently precise. Also the detection of He remains controversial, but we can at least say that in SN 2004aw the feature observed at 1.04 μm cannot be helium alone.
With the physical parameters computed in the previous section, SN 2004aw proves to be a fairly massive and energetic representative of the SN Ic class. About 0.3 M⊙ of synthesized 56Ni is a large amount for a core-collapse SN, and both ejecta mass and total kinetic energy are a factor of 4 to 9 larger than those in the prototypical Type Ic SN 1994I. This makes SN 2004aw one of the most energetic normal-velocity SNe Ic ever observed, lying in a parameter region so far almost exclusively populated by some BL-SNe.
These properties also confirm that the various definitions of ‘hypernova’ mentioned in Section 1 are not equivalent. We do believe that SN 2004aw was a highly aspherical explosion, but the ejecta velocities were normal and the total kinetic energy was fairly high, though still below 1052 erg. However, the latter also holds for SN 2002ap (see Table 6), which is by some authors referred to as hypernova owing to its high ejecta velocities and SN 1998bw-like spectra near maximum light (see e.g. Mazzali et al. 2002; Pandey et al. 2003a).
What we believe to see in both normal and broad-lined SNe Ic is a continuous range of the most relevant physical parameters such as nickel mass, ejecta mass and kinetic energy. A wide variety of combinations of these parameters is actually realized in nature, giving rise to the tremendous diversity in the Type Ic SN subclass.
This work has been supported by the European Union's Human Potential Programme ‘The Physics of Type Ia Supernovae’, under contract HPRN-CT-2002-00303. AVF's group at UC Berkeley is supported by National Science Foundation (NSF) grant AST-0307894, and by a generous gift from the TABASGO Foundation. AG and VS would like to thank the Göran Gustafsson Foundation for financial support.
This paper is based on observations collected at the 2.2- and 3.5-m Telescopes of the Centro Astronómico Hispano Alemán (Calar Alto, Spain), the Asiago 1.82-m Telescope (INAF Observatories, Italy), the Telescopio Nazionale Galileo, the Nordic Optical Telescope and the William Herschel Telescope (La Palma, Spain), the ESO Very Large Telescope (Cerro Paranal, Chile), the Katzman Automatic Imaging Telescope and the Shane 3-m reflector (Lick Observatory, California, USA), the 10-m Keck-I Telescope and the United Kingdom Infrared Telescope (Mauna Kea, Hawaii, USA), the 2.3-m Telescope (Siding Spring Observatory, Australia) and the Wendelstein 0.8-m Telescope (Bavaria, Germany). The W. M. Keck Observatory is operated as a scientific partnership among the California Institute of Technology, the University of California, and NASA; it was made possible by the generous financial support of the W. M. Keck Foundation. KAIT owes its existence to donations from Sun Microsystems, Inc., the Hewlett-Packard Company, AutoScope Corporation, Lick Observatory, the NSF, the University of California, the Sylvia & Jim Katzman Foundation and the TABASGO Foundation. The United Kingdom Infrared Telescope is operated by the Joint Astronomy Centre on behalf of the UK Particle Physics and Astronomy Research Council. The UKIRT data reported here were obtained as part of the UKIRT Service Programme. The Asiago 1.82-m Telescope is operated by the INAF – Osservatorio Astronomico di Padova.
Our thanks go to the support astronomers at the Telescopio Nazionale Galileo, the 2.2- and 3.5-m Telescopes in Calar Alto, the ESO Very Large Telescope and the United Kingdom Infrared Telescope for performing the follow-up observations of SN 2004aw. We are grateful to Roberto Nesci for his collaboration during the ToO observations of SN 2004aw with the Asiago 1.82-m Telescope, and to Mohan Ganeshalingam, David Pooley and Diane S. Wong for assistance with some of the observations at Lick and Keck. We also thank Kari Nilsson and Göran Östlin for giving up part of their time at the Nordic Optical Telescope, and Thomas Augusteijn, Tapio Pursimo, Erik Zackrisson and Daniel Arnberg for carrying out the observations. ST is indebted to Heinz Barwig for arranging the observations at the Wendelstein Observatory. Moreover, we are grateful to K. Hurley for the InterPlanetary Network information, and to the scientists of the Konus-Wind, HETE, Mars Odyssey (HEND and GRS), RHESSI, RXTE ASM and INTEGRAL (SPI-ACS) experiments for contributing their data to the network.
This research made use of the NASA/IPAC Extragalactic Database (NED) which is operated by the Jet Propulsion Laboratory, California Institute of Technology, under contract with the National Aeronautics and Space Administration, and the Lyon-Meudon Extragalactic Database (LEDA), supplied by the LEDA team at the Centre de Recherche Astronomique de Lyon, Observatoire de Lyon. This publication also used data products from the Two Micron All Sky Survey (2MASS), which is a joint project of the University of Massachusetts and the Infrared Processing and Analysis Center/California Institute of Technology, funded by the National Aeronautics and Space Administration and the National Science Foundation.
Last but not least we want to thank the referee of this paper for his constructive comments.
REFERENCES
Lyon-Meudon Extragalactic Data base, http://leda.univ-lyon1.fr/
iraf is distributed by the National Optical Astronomy Observatories, which are operated by the Association of Universities for Research in Astronomy, Inc, under contract to the National Science Foundation.
Written by F. Mannucci, http://www.arcetri.astro.it/~filippo/snap/
Author notes
Based on observations at ESO–Paranal, Prog. 074.D-0161(A).
