


Abstract
QU Car is listed in cataclysmic variable star catalogues as a nova-like variable. This little-studied, yet bright interacting binary is re-appraised here in the light of new high-quality ultraviolet interstellar line data obtained with STIS on-board the Hubble Space Telescope. The detection of a component of interstellar absorption at a mean local standard of rest velocity of −14 km s−1 indicates that the distance to QU Car may be ∼ 2 kpc or more — a considerable increase on the previous lower-limiting distance of 500 pc. If so, the bolometric luminosity of QU Car could exceed 1037 erg s−1. This would place this binary in the luminosity domain occupied by known compact-binary supersoft X-ray sources. Even at 500 pc, QU Car appears to be the most luminous nova-like variable known.
New intermediate dispersion optical spectroscopy of QU Car spanning 3800–7000 Å is presented. These data yield the discovery that C ivλλ5801,12 is present as an unusually prominent emission line in an otherwise low-contrast line spectrum. Using measurements of this and other lines in a recombination line analysis, it is shown that the C/He abundance as proxied by the n(C4+)/n(He2+) ratio may be as high as 0.06 (an order of magnitude higher than the solar ratio). Furthermore, the C/O abundance ratio is estimated to be greater than 1. These findings suggest that the companion in QU Car is a carbon star. If so, it would be the first example of a carbon star in such a binary. An early-type R star best matches the required abundance pattern and could escape detection at optical wavelengths provided the distance to QU Car is ∼ 2 kpc or more.
1 Introduction
QU Car was first described in the astronomical literature by Schild (1969), after it had been noted as a potentially interesting emission-line object by Stephenson, Sanduleak & Schild (1968). According to Schild, this variable resembled an old nova spectroscopically and exhibited irregular short-term brightness fluctuations not exceeding 0.2 mag in amplitude. Over a decade later Gilliland & Phillips (1982, hereafter GP82) presented high time resolution blue spectra of QU Car that they were able to analyse for radial velocity variation. They determined a period of 10.9 h from centroid motion in He iiλ4686 and Hβ line emission, thereby confirming the binary nature of the system. They also argued from the absence of detectable secondary star absorption lines and the implied apparent magnitude limit of the secondary star that QU Car was at a distance of at least 500 pc (see also Duerbeck 1999). The designation of QU Car as a nova-like variable in catalogues of cataclysmic variables (CVs) originates with GP82. Warner (1995, table 4.1) further qualifies this by placing it in the UX UMa subclass. The physical model for UX UMa systems is that these are white dwarf interacting binaries in which the mass transfer rate is high enough  to sustain the accretion disc in an opaque high state.
The blue spectrum of QU Car is quite remarkable in two respects. First, the contrast of all line features against the continuum is very low. The highest contrast emission lines peak at under 1.2 times the continuum level. Secondly, and uniquely among known CVs, emission in the carbon—nitrogen blend centred near 4650 Å is comparable in equivalent width to that of the He iiλ4686 emission. Impressed by this unusual property, GP82 deconvolved the 4650-Å emission and showed that it is dominated by carbon emission. This was an important finding because it consigned fluorescent excitation via the Bowen mechanism to a minor role, and pointed instead toward significant CN abundance enhancement as the explanation for the great relative strength of the feature.
QU Car was observed a number of times at ultraviolet (UV) wavelengths with the International Ultraviolet Explorer (IUE). In particular, a series of observations was obtained with a view to searching for orbital-phase-linked variability in the stronger UV resonance lines (Knigge et al. 1994), a phenomenon often apparent in high-state CVs. Nothing conclusive was found, but it was noted that O vλ1371 absorption was unusually prominent in the spectrum. As a relatively bright source at a visual magnitude of between 11.1 and 11.5 (see table 4.1 in Warner 1995), it was natural to include QU Car in a recent Hubble Space Telescope (HST) programme of high time- and spectral-resolution UV spectroscopy aimed at testing a model for the accretion disc winds seen in nova-like variables (and in QU Car — see Knigge et al. 1994). With the advantage of both the high spectral resolution and high signal delivered by the E140M echelle of the Space Telescope Imaging Spectrograph (STIS) on this target, it nevertheless became all too plain that the UV spectrum of QU Car deviates from the nova-like variable norm. The main peculiarities are the higher than usual ionization signalled by bright He iiλ1640 emission and the (already noted) strong O vλ1371 absorption, together with the weak mass-loss signatures in, for example, N vλ1240 and C ivλ1549. An in-depth discussion of the HST/STIS E140M data is to be found in Hartley et al. (2002).
The aim of this work on QU Car is to re-open the thus-far sparse discussion on the nature of this binary. Our conclusion will be that its bland classification as a nova-like variable has served to conceal an extraordinary binary: new evidence, derived both from the HST/STIS observations and from the first broad-band optical spectrum of QU Car to be obtained in the digital era, suggests instead that this object is unusually luminous (with a mass transfer rate perhaps as high as ≳10−7 M⊙ yr−1) and that the accreting material is also significantly carbon-enriched.
In Section 2, we present the interstellar line spectrum as it emerges from the co-adding of all the HST/STIS E140M data available (shown as Fig. 1). This is used to argue that the distance to QU Car could be ∼ 2 kpc or more. In Section 3 we estimate the bolometric luminosity both for the near distance of 500 pc and the representative longer one of 2 kpc. Then in Section 4 we compare and contrast the optical spectrum of QU Car with those of a selection of supersoft sources presented by Cowley et al. (1998). Finally, we begin the task of analysing the optical emission-line spectrum for element abundances and find, intriguingly, that carbon is significantly enhanced (Section 5). We close with a discussion in which we draw attention to the puzzle the apparent abundance peculiarity poses for the stellar content of this short-period binary.

The HST /STIS ultraviolet spectrum of QU Car. The data shown are the grand sum of all the echelle data obtained to date ( Hartley et al. 2002 ).
2 The Reddening, the Uv Interstellar Lines and the Distance to Qu Car
As bright CVs are usually nearby objects, the interstellar reddening towards them is normally negligible, and interstellar absorption lines in their spectra are weak. QU Car, however, is known to exhibit a measurable reddening even though, at mv∼ 11.4, only three nova-like variables are listed by Warner (1995) as brighter. On the basis of correcting the UV spectral energy distribution (SED) for the 2200-Å broad interstellar extinction feature, Verbunt (1987) determined EB−V= 0.1 ± 0.03 for this object. This makes QU Car one of only 11 out of Verbunt's sample of 51 CVs (observed with IUE) to be reddened by this amount or more. We have re-examined IUE archive data and can confirm this reddening estimate, noting that the quoted error bound is conservative (3σ).
The HST/STIS (1160–1700 Å) data now available to us provide the means to obtain an independent, if indirect, check on the reddening. We can measure the neutral hydrogen column density by comparing the shape of the observed Lyα damping wings with theoretical predictions. For this object, with its relatively high degree of ionization, it is reasonable to assume that the Lyα damping wings are interstellar in origin. The extraction of the data we used for this purpose was one that included corrections for echelle interorder scattered light, so that the flux minimum in the Lyα profiles is zero, as it should be. The results of our comparison are shown as Fig. 2. We conclude from this that the neutral hydrogen column density is (6 ± 1) × 1020 cm−2. For a standard gas-to-dust ratio of N(H i)/EB−V= 5.8 × 10²¹ mag−1 cm−2 (Bohlin, Savage & Drake 1978), this column converts to EB−V= 0.1 ± 0.015— in agreement with the pre-existing UV SED-based reddening determination. It seems EB−V= 0.1 towards QU Car can be regarded as a good working estimate.

A comparison between theoretical Lyα damping profiles and the normalized merged spectrum. Profiles are drawn for column densities N (H i )/(10 20 cm −2 ) = 5, 6, 7 and 8. A variety of continuum normalizations were tried. Here we show the result of the simplest normalization strategy: a local linear interpolation after fixing the continuum level at 1171 and 1262 Å. It is evident that an N (H i ) column of between 6 × 10²⁰ and 7 × 1020 cm−2 gives the best match to the data. If a quadratic or power-law continuum fit is used instead, the only difference is stronger favouring of N (H i ) = 6 × 10 20 cm −2. The excess flux relative to the fit at ∼1200 Å is because we have placed the continuum under the assumption that there is unidentified line emission at these wavelengths (cf. Fig. 1 ). This figure can be seen in colour in the online version of the journal on Synergy.
The higher than typical reddening for a CV is accompanied by a richer than usual interstellar line spectrum. Indeed, we have been able to identify and obtain measurements of 34 transitions in the sum of the HST/STIS echelle observations (Fig. 1, see also Hartley et al. 2002). The results of these measurements are presented as Table 1. For every line, an equivalent width is reported. In most cases we are also able to provide meaningful velocity measurements. The clearly saturated absorption lines are listed in the top part of the table. The velocities given (to the nearest km s−1) for all but two of these are intended to convey an impression of the range over which absorption occurs. Specifically, they are the ‘full width at half-flux’ points — the velocities where the observed flux is half that in the adjacent continuum. It is very noticeable that the absorption in these strong lines is displaced towards negative local standard of rest (LSR) velocities, suggesting the blending within them of more than one velocity component.

Equivalent width and velocity measurements of the interstellar lines in the ultraviolet spectrum of QU Car. Where the equivalent is quoted to the nearest 5 m Å, it was determined by approximate integration over the entire line profile; where it is quoted to the nearest 0.1 m Å, it has been determined by fitting one or more Gaussian components to the line profile. The velocity data given on heavily saturated line profiles, in the top part of the table, are the half-continuum points (where the profile passes through 50 per cent of the continuum level). Otherwise the given velocities and errors are derived from Gaussian fits to the line profiles. In the ‘appearance’ column, the label ‘s’ indicates a heavily saturated line, ‘∼s’ indicates close to saturation, while the labels 1 and 2, respectively, indicate unsaturated profiles presenting with one and two velocity components.
Fortunately, there are many weaker unsaturated interstellar lines present in the UV spectrum. These are listed in the lower part of Table 1. In these cases it is of value to fit one or more Gaussian components to the observed profile, thereby obtaining measures of mean component velocities and linewidths. The latter are of no physical interest since we can expect them to be dominated by instrumental broadening — indeed these widths are scattered within the range 12–14 km s−1 (implying an effective resolving power for the combination of STIS echelle grating and aperture used of approximately 23 000). Several of the weaker interstellar lines appear to comprise only one velocity component: these are always centred at an LSR velocity within 2 or 3 km s−1 of zero. However, many echo the saturated lines in that there is evidence in them of a second, distinctly blueshifted, velocity component. The best examples of these are shown in Fig. 3. The weighted mean velocity of this second blueshifted component is −14.5 ± 1.1 km s−1. If this mean is calculated including the blueshifted component velocities of the nearly saturated Fe iiλ1608 and S iiλ1250 lines, this figure decreases a little to −12.5 ± 0.5 km s−1.
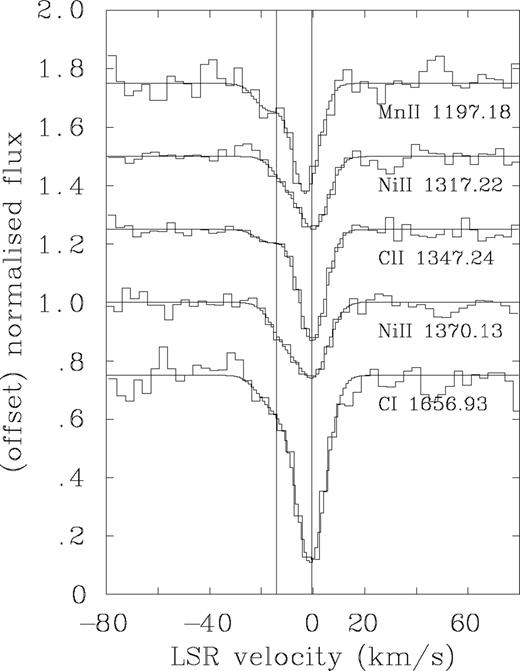
Ultraviolet interstellar lines from the co-added HST /STIS spectrum of QU Car. The lines shown here are unsaturated at the instrumental resolution of the E140M echelle grating (R∼ 23 000). In each there is clear evidence of a second blueshifted velocity component. The smooth lines superposed on the binned profile data are the Gaussian fits giving the velocities listed for these transitions in Table 1.
If QU Car is at ∼ 500 pc, we might expect only to detect interstellar absorption lines centred on the local standard of rest. However, since QU Car is located at a relatively low galactic latitude  and there is evidence of a second component of interstellar absorption at ∼ −14 km s−1, it is possible that the distance is significantly greater than 500 pc. Indeed, we can use the ∼ −14 km s−1 component to estimate a new lower limit on the distance by applying the assumption that this component is the result of a cloud where the velocity is determined by the general Galactic rotation law.
An earlier example of the use of this distance estimation method is to be found in Crawford & Barlow (1991), where the distance to a Wolf—Rayet star (just a few degrees away from QU Car) is shown to be large by assigning kinematic distances to components observed in the interstellar Na i D line absorption in its spectrum. If the same approach is used and we also adopt the Galactic rotation model favoured by Fich, Blitz & Stark (1989), we find that the projected Galactic rotation velocity shifts in the negative direction moving along the line of sight to QU Car, reaching a minimum of −18.3 km s−1 at a distance of 3.3 kpc. A velocity of −14 km s−1 is first reached at the lesser distance of 1.8 kpc. This suggests a distance for QU Car of approximately 2 kpc. At a distance of exactly 2 kpc and at  , QU Car would be located 250 pc south of the Galactic mid-plane. This is not problematic. At the extreme limit, it is clear that QU Car is in the Galaxy: using data from Dickey & Lockman (1990), we estimate that the total H i column through the Galaxy along the sightline of QU Car is 2.2 × 1021 cm−2, or approximately three times the column out to QU Car.
In the absence of supporting observations of interstellar lines in the spectra of stars of known distance in the same part of the sky as QU Car, it remains possible that the interstellar cloud responsible for the blueshifted component in the spectrum QU Car is not a perfect tracer of Galactic rotation. Accordingly, in the rest of this paper, the status of QU Car will be evaluated within the context of two possible distances: 500 pc and 2 kpc.
3 The Spectral Energy Distribution and Estimates of the Luminosity
To date, the only part of the spectral energy distribution to be defined well enough for quantitative scrutiny is the ultraviolet range. To begin to define the SED, we have gathered all the IUE observations obtained of QU Car during 1991 June (five long-wavelength and 12 short-wavelength spectra, see Knigge et al. 1994). These have been merged and then corrected for reddening assuming EB−V= 0.1. The resultant ultraviolet spectral energy distribution obtained in this way is shown in Fig. 4. It is compared with simple power laws in wavelength of the form, Fλ∝λγ, where γ is a constant. Each power law shown was normalized at a wavelength of 3000 Å. We find that γ=−2.25 runs through the dereddened energy distribution very convincingly and that the index only has to change by approximately 0.1 to produce a significantly worse match. This is not a very reddening-sensitive result either, given that the reddening is itself modest: if EB−V is lowered from 0.1 to 0.08, the best-fitting power-law index to the dereddened SED drops by just 0.1. The value of the power-law index is consistent with that expected of an optically thick accretion disc.

The ultraviolet spectral energy distribution after dereddening assuming EB − V = 0.1. The data are merged IUE low-dispersion spectra obtained in 1991 June. The solid curve superposed on the spectrum is a power law with a spectral index, γ = −2.25. fit to the data by eye. Also shown are power laws with indices 0.1 different from the best-fitting value.
At this point, we can ask whether the power law that works so well in the UV extrapolates satisfactorily into the optical. It does and is sufficient for our present purposes. The 1991 June merged IUE spectrum gives a dereddened flux at 3000 Å of 5.1 × 10⁻¹³ erg s−1 cm−2 Å−1. This extrapolates to 1.3 × 10⁻¹³ erg s−1 cm−2 Å−1 in the V band at 5556 Å. Reddening this by 0.31 mag and converting to a magnitude using Hayes' (1985) zero-point, we ‘predict’V= 11.4. Fortuitously, this is the same as the mean magnitude quoted for QU Car on the SIMBAD data base. In truth, and as one would expect for an object classified as a nova-like variable, there is photometric evidence of optical variability to within a few tenths of a magnitude (e.g. Schild 1969; GP82; Kern & Bookmyer 1986; Hartley 2002). Absolute photometric data suggest that QU Car has reached, at its brightest, mv= 10.9 and, at its faintest, mv≃ 12, tending to spend more time in the bright half of this range (Hiltner & Gordon 1971; Warner 1995; collected amateur observer data in Hartley 2002).
Using the γ=−2.25 power-law representation of the SED together with the two distance estimates, we have obtained estimates of the bolometric luminosity of QU Car. These are set out in Table 2. At this time there are no useful observations of this binary at FUV or EUV wavelengths. To deal with this lack of constraint our estimates are calculated on the basis of what are likely to be lower- and upper-limiting assumptions regarding the FUV/EUV SED. To represent an extremely conservative lower limit, Table 2 provides bolometric luminosities calculated on the assumption that the power law has a short-wavelength cut-off at the Lyman limit (912 Å). The alternative assumption we have made — that the power law continues on down to 228 Å (the He+ Lyman edge), can be viewed as a rough upper limit for the moment. In time we may discover that this ‘limit’ yields estimates not too different from the correct figures for the following reasons. We note that, while it is entirely credible that the SED has peaked at a wavelength longer than 228 Å, it also must persist into the He+ Lyman continuum: the presence of both N vλ1240 and O vλ1371 in absorption in the UV spectrum (Fig. 1) certainly demands a supply of photons in the He+ Lyman continuum capable of photoionizing N3+ and O3+ from either their ground or excited levels (Drew 1989). At the same time, the fact that QU Car was not detected by the soft X-ray sensitive Röntgen Satellite (ROSAT, Verbunt et al. 1997) gives some confidence that the 228-Å (54-eV) cut-off will not lead to a significant underestimation.

Estimates of bolometric luminosities and equivalent mass accretion rates for QU Car. Figures are given for the two distances discussed in Section 2. The SED adopted in the integration to obtain the bolometric luminosities was F λ = F3000 (λ/3000) −2.25 with F3000 = 5.13 × 10 −13 erg cm −2 s −1 Å −1 (see Fig. 4 ) with a short-wavelength cut-off at either 912 or 228 Å. The equivalent mass accretion rates,  were derived assuming accretion on to a 1-M⊙ white dwarf with a radius of 0.01 R⊙.
In order to give the luminosity estimates in Table 2 a more obvious physical meaning, they have been converted to mass accretion rates assuming a 1-M⊙ white dwarf accretor of radius 0.01 R⊙. These figures show how luminous QU Car is, even if, quite remarkably, no photons are emitted shortward of 912 Å and it is at the near distance of 500 pc. The equivalent mass accretion rate already exceeds 10−8 M⊙ yr−1, placing it a little higher than any accepted nova-like variable accretion rate (e.g. Warner 1995, p. 245). Another way of expressing this is to note that MV= 2.6 for QU Car placed at 500 pc is over a magnitude higher than the nova-like variable norm of MV∼ 4 (Warner 1995, table 4.16). If the distance to QU Car is closer to 2 kpc than it is to 500 pc, the data in Table 2 point to a luminosity within a factor of a few of 1037 erg s−1 and an equivalent mass accretion rate in the vicinity of 10−7 M⊙ yr−1. These orders of magnitude match those discussed in the context of mass transfer occurring on the thermal time-scale in close-binary supersoft sources (Kahabka & van den Heuvel 1997).
4 The Optical Spectrum of Qu Car
The potentially high luminosity and indeed the high ionization seen at UV wavelengths in QU Car (see fig. 8 in Hartley et al. 2002) suggests that an optical spectroscopic comparison with those of known close-binary supersoft sources might be enlightening.
The optical spectral characteristics of supersoft sources have been described by Cowley et al. (1998). The spectra of the six sources they studied are characterized by strong He iiλ4686 emission relative to Hβ, together with O vi line emission at 3811 Å and at 5290 Å. The equivalent widths of the He ii and H i line emission are up to an order of magnitude higher in these supersoft sources, compared with QU Car. Nevertheless, the (He iiλ4686)/Hβ equivalent width ratio for QU Car is not discordant with the supersoft norm: specifically, for the four objects listed in table 5 of Cowley et al. (1998), for which the ratio can be determined, it ranges from 1.9 up to 3.5 — as judged from the data of GP82, this ratio is ≳2 in QU Car. A number of supersofts also emit in the C ivλλ5801,12 doublet. The usual pattern at these longer wavelengths is rough equality between the O viλ5290 and He iiλ5411 emission, with C ivλλ5801,12 being somewhat weaker than the He ii lines (see fig. 1 in Cowley et al. 1998).
Hitherto, the only published optical spectra of QU Car have been those obtained by GP82, spanning the wavelength range 4300– 4900 Å. This does not cover the range needed to provide a comparison with the O vi and C iv lines. To rectify this problem, we have obtained intermediate dispersion spectra covering the much wider range, 3800–6800 Å. A log of the observations is given in Table 3. The data were obtained at the SAAO 1.9-m telescope, using the grating spectrograph and SITe CCD. To achieve the broad wavelength coverage, data were taken at two grating angles. The dispersion of the data obtained using grating 6 was close to 1 Å pixel−1, yielding a resolution of ∼ 2 Å. The only calibration observations obtained were arc spectra for determining the wavelength scale — our goal was limited to finding and identifying weak emission lines. The spectra were flat-fielded, wavelength-calibrated and sky-subtracted using routines within the NOAO/iraf package. Coincidentally, the two sets of blue spectra were obtained almost exactly two orbital periods apart — and indeed the details of the line profile shapes do not change significantly between the two observations. This has meant that it has been acceptable to directly co-add the two sets (five exposures) without correcting for radial velocity changes. The total count per pixel in the co-added blue spectrum ranges from 40 000 at 3800 Å to a maximum of 100 000 at 4800 Å. The one red exposure obtained yields a count that varies between 10 000 pixel−1 at 6800 Å and 17 000 pixel−1 at 5600 Å.

Journal of optical spectroscopy.
The spectra show no evidence of O vi emission. For O viλ5290, our upper limit on the equivalent width is of the order of 10 m Å. For O viλ3811, our limit is worse (∼ 50 m Å) owing to the declining count rate and the corrugation of the spectrum by very weak, converging Balmer series lines. In contrast, there is no difficulty at all in picking out the C ivλλ5801,12 blend — it could even be said to tower over the He iiλ5411 line in the same spectral region. An excerpt of the spectrum containing these two lines is shown as Fig. 5. This is quite unlike the Cowley et al. (1998) supersoft sources. The blue wing of the C iv line appears to be eroded both by a narrow absorption that is very likely to be the 5780-Å diffuse interstellar band, and possibly by a weak blueshifted P Cygni absorption component. Considering the lower level of the C iv transition lies 39 eV above the C3+ ground state, this is quite remarkable, if true.

The normalized counts between 5200 and 6000 Å. The separately obtained blue and red spectra overlap between 5200 and 5500 Å, giving a higher signal-to-noise ratio in this range. The prominent absorption at the red end of the range is interstellar Na i — this partially obscures He i λ5876 emission sitting shortward of it. The C ivλλ5801,12 emission is much stronger than He ii λ5411. Note the DIB at 5780 Å and the hint of weak broad blueshifted absorption component to the C iv line.
Since it is such a high-lying transition and unlikely to be fluorescently excited, it is possible that the observed emission in C ivλλ5801,12 forms mainly in the C4+→ C3+ recombination cascade. In view of the high degree of ionization already implied by the strong O vλ1371 absorption in the UV spectrum, it is likely that C4+ is the most abundant carbon ion (the ionization potentials for O3+ and C3+ are, respectively, 77 eV and 65 eV). Significant further ionization to C5+ can be ruled out, given that the threshold for C4+ ionization lies at 490 eV. This interpretation is consistent with the observation that the profile of the C ivλ1549 UV resonance transition is typically dominated by emission, rather than the P Cygni absorption that might signal C3+ as being more abundant than C4+ (see fig. 1 in Hartley et al. 2002).
In contrast to this, the optical spectrum contains no trace of the highly excited optical O vi lines and indeed O vλ5590 line, which would also form mainly by recombination (see, e.g., Kingsburgh, Barlow & Storey 1995). This may be an indication that oxygen is not ionized up to either O5+ or O6+ (the ionization potentials of O4+ and O5+ are, respectively, 114 and 138 eV). What of the N4+—N5+ ion balance? If optical N v recombination emission can be identified, we will then have learned that the SED of QU Car extends to high enough energies to present a photon flux in the vicinity of the N4+ ionization threshold at 98 eV. The analogous transition to C ivλλ5801,12 is N vλλ4604,20— this can be looked for, as can the even more highly excited N vλλ4945, 50 blend. Both blends are, in fact, weakly present. This is shown in the plot of the 4500–5000 Å part of the optical spectrum (Fig. 6). In the data of GP82, the N vλλ4604,20 blend was less evident. This difference is very probably related to the modest optical/UV variability exhibited by QU Car. Crudely, it would seem that the high-energy limit to the SED of QU Car falls at approximately 100 eV.

The normalized counts spectrum between 4500 and 5000 Å. Compared with GP82 data, the He ii λ4686 emission is now taller than the 4650-Å blend (which incorporates some hitherto unacknowledged C iv λ4658 emission). Conversely, the new data present with a stronger Hβ underlying absorption and He i λ4921 emission. Note also what may be N v recombination emission at λ λ4604,20 and at λ λ4945,50 (rest wavelengths of all four are marked).
In terms of the degree of ionization implied by the optical recombination lines, the environment of this binary is not quite as extreme as the supersoft sources. Empirically, detected X-rays and, now, optical O vi emission seem to be wanting.
5 Estimation of the Carbon Abundance and C/O Ratio
The strength of the C iv and He ii emission lines in the spectra of QU Car are remarkable. Responding to this, we sketch here the simplest quantitative model of the line emission that allows an estimate of the abundance of carbon relative to helium and helium relative to hydrogen. We assume, as discussed in the previous section, that C ivλλ5801,12 arises primarily from the C4++ e−→ C3+ recombination cascade and that C4+ is the most abundant carbon ion in the emitting region (wherever that is precisely). The C4+ ion undoubtedly co-exists with helium almost entirely ionized to He2+ and hydrogen ionized to H+. There is empirical support for part of this expectation in that a comparison of the red-wing velocity widths of the He iiλ4686 and C ivλλ5801,12 lines reveals them to be well-matched. If the He ii and H i emission arises from optically thin recombination, then we can use the observed C iv/He ii and He ii/H i line ratios to estimate the relative element abundances. Briefly, we also consider evidence regarding the oxygen abundance.
First, it is necessary to consider the relative strengths of accessible He ii and H i line emission in order to determine whether it is optically thin. To achieve this the optical/UV SED has to be treated as known, so that equivalent widths can be turned into line fluxes. In the absence of multicolour optical photometry or indeed flux calibration of our optical spectrum, we adopt the same simple power-law SED, normalized at 3000 Å that was derived from the fit to IUE data in Section 3. Measured He ii and H i equivalent widths and line fluxes derived with reference to this power-law fit are given in Table 4. The errors assigned to the derived line flux ratios in the table take into account the equivalent width error arising from continuum placement and the effect of an SED slope error of ±0.15 in the index. All the Balmer emission-line fluxes are superposed on broader underlying absorption profiles (although this is not directly apparent at Hα): the consequence of this for the emission-line flux ratios will be a systematic error of unknown bias, over and above the quoted random error. The He ii emission, in contrast, is relatively clean. In Table 4 we give theoretical recombination case B ratios for comparison (calculated using code due to Storey & Hummer 1995). As it is likely that the line emission has an origin in a hot dense accretion disc atmosphere (see the discussion in Hartley et al. 2002), the ratio ranges quoted are for 1011⩽ne⩽ 1012 cm−3 and for Te= 30 000 K (H i) or 30 000 ⩽Te⩽ 100 000 K (He ii).

Emission-line equivalent widths, fluxes and relevant recombination data. The continuum fluxes are calculated using the γ = −2.25 power-law SED derived in Section 3. The line fluxes are simply the product of these with the equivalent widths in the previous column. The effective recombination coefficients given in the final column are taken from table 14 in Kingsburgh et al. (1995).
The impression to be gained from the comparison in Table 4 is that the Balmer decrement is a little flatter than case B expectations, whilst the He ii ratios fit in quite well with them. These data indicate that we can expect a fair estimate of n(C4+)/n(He2+) from a recombination analysis of the C ivλλ5801,5812 and He iiλ5411 lines, but the same approach using e.g. He iiλ4686 and Hβ may overestimate n( He2+)/n( H+).


The error in the above expression is derived solely from the equivalent width uncertainties (Table 4). Because the recombination lines compared are close together in wavelength, the impact of the adopted SED on the derived relative abundance is negligible. Potentially greater sources of error arise from the adopted (ne, Te) that goes with the use of the Kingsburgh et al. (1995) effective recombination coefficients, and from the assumed recombination model for the λλ5801,5812 emission. Neither of these is easy to quantify. We suspect that the choices of density and temperature will not amount to more than a factor of ∼ 2 uncertainty — after all to a recombined electron in high-principal quantum number states, the C3+ and He+ ions do not seem very different (the fact lying behind the near-coincidences in wavelength between so many highly excited C iv and He ii lines).
The bigger systematic error may be more to do with the implied model for the level populations involved in the C ivλλ5801,12 doublet transition itself. The upper level of the transition, 1s23p(2Po) can be directly excited from the ground state via the resonant transition at 312-Å and populated by recombination. This fact also means that there may be non-negligible opacity in the 5801,12 Å doublet when the 312-Å resonance is very opaque — possibly explaining the hint of blueshifted absorption in the observed profile. These considerations show that it is not obvious whether the emission in this C iv transition is raised above or below the pure recombination value. Indeed, the experience of Kingsburgh et al. (1995) with this line for WO-star abundance determinations is that such complications can cause both over- and underestimation by a factor of a few.
For the present, we can check for consistency between the emission in λλ5801,12 and that in other C iv lines in the observed wavelength range. C ivλ4658 is undoubtedly present in the spectrum of QU Car, but of course it is blended into the ∼ 4650-Å emission feature along with C iii and some N iii. The effective recombination coefficient for this line is 8.32 × 10⁻²⁵ cm3 s−1— more than half that for C ivλλ5801,12 (Table 4). From a multiple Gaussian fit to the 4650-Å blend, which imposes the correct relative wavelengths of the contributing N iii, C iii and C iv multiplet components and the relative emission strengths (within each multiplet) expected for optically thin gas, we find that the C ivλ4658 multiplet could contribute as much as a third of the observed flux in the blend (i.e. an equivalent width of up to ∼ 0.9 Å). Based on the observed equivalent width of the λλ5801,12 doublet, we would have predicted half this much! So one might take from this that the n(C4+)/n(He2+) ratio is underestimated using the λλ5801,12 doublet. However, to counterbalance this, there is not a detection of the weak C ivλ5470 line when perhaps there should have been, just — this could imply an error of a factor of 2 or more in the opposite sense.
Accordingly, we recognize that the derived n(C4+)/n(He2+) may be wrong by a factor of 2–4. At the same time, it is possible that the He ii line emission forms in a larger volume than the C iv line emission, with the implication that the ratio given as expression (2) could be a lower bound on the C/He abundance ratio. For the moment, our conservative estimate is that C/He is at least∼ 0.015. As a comparison, we note that the solar value for this ratio is 0.004 (Sofia & Meyer 2001, for 10 per cent He by number relative to H). The reason why carbon line emission from a range of ion stages is so plentiful in the UV—optical spectrum of QU Car is now evident (see, e.g., fig. 9 in Hartley et al. 2002; GP82).
Over a wide range of temperatures and densities the ratio between case B effective recombination coefficients for the He iiλ4686 and Hβ lines is within 10 per cent of 9. Note that this means that a normal helium abundance of 1/10 by number relative to hydrogen converts to rough equality in the equivalent widths of He iiλ4686 and Hβ emission (if He2+ and H+ are the dominant ion stages). Table 4 (and Fig. 5) shows that in our optical spectrum the He iiλ4686 equivalent width is approximately 2.5 times higher than that of Hβ, implying a helium overabundance of a similar order. Indeed, for clear nucleosynthetic reasons, it could be a problem to find evidence of carbon enrichment without also some helium enrichment. If optical depth is implicated in the slight flattening of the Balmer decrement relative to recombination case B, or if case A is the better approximation to apply, this factor of ∼ 2.5 would have to be lowered. Putting this together with the estimated C/He ratio, [C/H] in QU Car could be anything between 4 and 40.


6 Summary and Discussion
In this study, two significant findings have emerged.
First, UV interstellar absorption-line data have revealed evidence of a blueshifted diffuse cloud components at an LSR velocity of −14 km s−1 (to within 2 km s−1). Interpreted in terms of a standard galactic rotation model, this tells us that the minimum distance to QU Car is ∼1.8 kpc, rather than ∼ 0.5 kpc as estimated by GP82. Nevertheless, the fact that the H i interstellar column towards QU Car is approximately a third the total for the Galaxy along the same siteline, reassures that it is located in the Galaxy. In fact, if the distance to QU Car actually is ∼ 2 kpc, it would be at a similar distance from the Sun as the Carina spiral arm at the same galactic longitude (Grabelsky et al. 1987).
Secondly, a newly obtained intermediate dispersion optical spectrum of QU Car has been found to contain no O vi line emission and, yet, unusually strong C ivλλ5801,12 emission is present. It has long been known that the ∼ 4650-Å emission feature is also very strong and appears to be dominated by carbon, rather than nitrogen, line emission (GP82). Starting from the strength of the C ivλλ5801,12 emission compared with He iiλ5411 emission, we have shown that there is very likely to be significant enrichment of carbon in the emission-line region of QU Car (with [C/H] in the range 4–40). Furthermore, the near absence of any oxygen line emission from the UV and optical spectrum suggests the C/O abundance ratio exceeds unity.
We now consider the implications for the status of QU Car if its distance from the Sun is ∼ 2 kpc or more. It was shown in Section 3 that this demands a high luminosity, Lbol∼ 1037 erg s−1, and hence a high mass accretion rate,  (assuming a white dwarf accretor).
Another way of visualizing this is to scale QU Car with respect to the most famous and brightest of dwarf novae, SS Cyg. This is a useful comparison because SS Cyg is a low-inclination binary, just as we believe QU Car to be (see Hartley et al. 2002). Parallax observations have recently led to an upward revision of the distance to SS Cyg placing it at a distance of 166 pc (Harrison et al. 1999). Schreiber & Gänsicke (2002) have re-evaluated the outburst mass accretion rate, using the revised distance: at V= 8.5, they associate with it the distinctly high mass transfer rate of (5.7 ± 2.4) × 10−8 M⊙ yr−1 (for the widely accepted white dwarf mass of 1.19 M⊙). After correcting for reddening, the apparent magnitudes of QU Car and SS Cyg imply that the former is 12 times fainter than the latter. This means QU Car is intrinsically 2.6D2 brighter in the V band, where D is the distance to QU Car expressed in kpc. Hence at ∼ 2 kpc, QU Car is 10 times more luminous than SS Cyg in the V band, and possibly powered by a mass transfer rate as high as ∼6 × 10⁻⁷ M⊙ yr−1 (scaling from Schreiber & Gänsicke's calculation).
The clear empirical restraint on relabelling QU Car as a supersoft source is that there is only an upper limit on the soft X-ray flux (Verbunt et al. 1997). A low X-ray luminosity is also consistent with the absence of O vi recombination lines in the spectra we have obtained. Nevertheless, given that ‘X-ray off’ states have been recorded for supersoft sources (e.g. RX J0513.9—6951, Reinsch et al. 1996; CAL 83, Greiner & Di Stefano 2002), this difference might diminish. A wavelength domain in which QU Car bears some resemblance to known supersofts is in the ultraviolet. Gänsicke et al. (1998) have described the UV spectra of RX J0513.9—6951 and CAL 83, and point out the presence of N vλ1240, O vλ1371 and He iiλ1640 emission in both objects. These are also prominent in QU Car, with the difference that the N v and O v features are in absorption — this might also signal less extreme ionization than in the supersoft sources. It is unlikely that orbital inclination is implicated here given that all three objects are believed to be at low inclination (Cowley et al. 1998; Hartley 2002). Finally, we note that for a distance of 2 kpc the absolute magnitude, MV=−0.4, of QU Car is fainter than that of these same two supersofts by 1.6 and 0.9 mag.
It remains possible that the interstellar line data mislead in indicating the longer siteline to QU Car, leaving the earlier proposed minimum distance of 0.5 kpc intact. At this nearer limiting distance, QU Car is still the most luminous nova-like variable known. Indeed, using the scaling to SS Cyg again, at D= 0.5 kpc, the mass transfer rate would be expected to be in the region of 4 × 10⁻⁸ M⊙ yr−1 (see also Table 2, Section 3).
Hitherto, on the rare occasions that deviations from cosmic abundances in CVs have been measured and documented, they have been in the sense of enhancements caused by CNO-cycle burning (i.e. mainly nitrogen enhancement, resulting from conversion of carbon and perhaps oxygen: see Marsh et al. 1995; Long 2000). QU Car appears to be the first recognized instance of enhancement caused by helium burning. This would not be remarkable if the line emission concerned could be associated with the accreting white dwarf. We are reluctant to propose this since the character of the UV emission-line spectrum of QU Car points towards an accretion disc origin (Hartley et al. 2002).
The carbon enhancement has then to be located in the envelope of the companion star. Could the companion star be a CO white dwarf? There can be two objections to this: (i) the published orbital period of 10.9 h (GP82) is too long and (ii) a doubly degenerate CV would not be expected to be so bright (even for the shorter minimum distance of 500 pc). To counter the first objection it can be proposed that the time series sampling of GP82 was too coarse to pick up the short (∼1000 s) periods expected for doubly degenerate systems. Certainly, a re-examination of the binary parameters of QU Car is warranted, given the extraordinary character of this binary and the ragged character of the phase-folded radial velocity curve (see GP82). The second objection currently has a simple empirical basis in that the absolute magnitude of the brightest of the known AM CVn systems (AM CVn itself) is thought to be MV∼ 9 (Warner 1995; see also Nasser, Solheim & Semionoff 2001.). A third problem for this scenario is the undeniable presence of hydrogen line emission and absorption in the optical spectrum of QU Car.
Accepting, for the moment, that the orbital period really is 10.9 h as determined by GP82, the implication from the period—mean density relation (e.g. Eggleton 1983) is that the companion star should have the mean density of a mid-F main-sequence star (or of a star evolving away from a later-type position on the main sequence). Near main-sequence stars cannot exhibit the pronounced carbon enhancement that has been discovered here. At higher luminosity, the abundance patterns that have been determined for barium and CH giants will not fit either, given that their carbon enrichment is against a backdrop of overall reduced metallicity, with the result that C/H or C/He is typically still less than in the Sun (see Barbuy et al. 1992; Vanture 1992).
Nevertheless, there is one class of not-so-bright giant that does come close to matching the abundance pattern deduced for QU Car — the early-type R stars. These are carbon stars now known to have absolute magnitudes that place them on the Hertzsprung—Russell diagram as red clump giants (MK≃−2, with V−K in the range from 2 to 4, Knapp, Pourbaix & Jorissen 2001). In the R-star sample of Dominy (1984), carbon enhancements up to ∼ 6 times solar are found with little change or a small drop in oxygen abundance. To accommodate such a companion within QU Car, the binary needs to be at or beyond the larger minimum distance discussed here. Specifically, at 2 kpc the absolute visual magnitude of QU Car is −0.4, to be compared with the same quantity for five R stars from Wallerstein & Knapp (1998) ranging from −0.25 up to 4.17. It would seem that the fainter half of this range is in accord with the non-detection of the companion star in the optical spectrum of QU Car. If further work can substantiate this concept, it could lend support to the growing opinion that the abundance patterns in early-type R stars have to do with outward mixing after the core helium flash (see the discussion in Knapp et al. 2001). The alternative idea that the failure to detect binary motion in these carbon-rich stars points to their being coalesced binaries (see, e.g., McClure 1997) sits awkwardly with the fact that QU Car remains apparent as a binary in which the mass transfer is away from the putative R star. However, work will have to be done to see whether an early-type R star in a high mass transfer rate system is a plausible consequence of binary star evolution. In this context, the 10.9-h orbital period may prove too short for comfort — unless the R star can have already shed much of its envelope.
If the distance to QU Car is closer to ∼ 500 pc, we are unable to suggest a plausible identity for the companion star. A dwarf carbon-star companion probably can be ruled out since the overall abundance pattern in such objects is that of a reduced-metallicity Population II star, such as the CH and Ba giants (see Wallerstein & Knapp 1998). It is also doubtful that pollution of the companion star by carbon-rich debris from unrecorded nova explosions in the past is a viable explanation — if the white dwarf has accreted from an unexceptional companion star, nucleosynthesis in the nova outburst will most likely yield nitrogen-enhanced ejecta with C/O < 1 (see Gehrz et al. 1998). Putting all the arguments together, we conclude that the apparent abundance peculiarity in QU Car has to be seen as favouring the picture in which this binary is distant and luminous.
We end with the remark that in carrying out this piece of work we have come to appreciate the paucity of published CV optical spectra (particularly outside the blue range). The only comprehensive optical spectroscopic survey of CVs that we have been able to draw on is the work of Williams (1983). Among the spectra presented there it can be seen that only T Pyx and V Sge bear a family resemblance to QU Car, particularly in terms of the strength of He ii lines relative to those of H i. Furthermore, in the case of V Sge one may, perhaps uniquely, just make out from the plot of its spectrum the C ivλλ5801,5812 blend in emission — certainly Williams did not find this feature often enough to consider quoting measurements of it in tables. Referring to the study of Herbig et al. (1965) on this well-known and perplexing binary, we find a report of data on the C iv transition giving an equivalent width 1.3 times that of the nearby He iiλ5411 line. In QU Car this ratio is close to 4! If V Sge is bizarre, QU Car is also. Objects such as these are testaments to the propensity that nature has to try out all the options — and in binary star evolution there appears to be especially many.
Acknowledgments
JED would particularly like to thank Mike Barlow for drawing attention to the carbon and oxygen recombination coefficients in the work of Kingsburgh et al. (1995) and for discussion in connection with their use. Thanks are also owed to Dave Kilkenny for putting JED and JvW in touch and helping set up the SAAO observations. LEH acknowledges the award of a studentship from the Particle Physics and Astronomy Research Council (PPARC) of the United Kingdom. Support for HST proposal number G0-8279 was provided by NASA through a grant from the Space Telescope Science Institute, which is operated by the Association of Universities for Research in Astronomy, Incorporated, under NASA contract NAS5-26555. In addition, this paper is based on data obtained from the South African Astronomical Observatory. Use was also made of the atomic line list () from Peter van Hoof. We thank the referee, Frank Verbunt, for his useful comments.
References
Author notes
E-mail: [email protected]
