


Abstract
Energy levels and radiative rates for transitions among the lowest 48 fine-structure levels belonging to the (1s22s22p6) 3s23p4, 3s3p5, 3s23p33d and 3p6 configurations of Fe xi have been calculated using the fully relativistic grasp code. Additionally, collision strengths for transitions among these levels have also been computed using the Dirac Atomic R-matrix Code (darc) of Norrington & Grant. Radiative rates and oscillator strengths are tabulated for all allowed transitions among the 48 fine-structure levels, while collision strengths are reported at three energies above thresholds, i.e. 8, 16 and 24 Ryd for a few representative transitions. Furthermore, excitation rates have been calculated in a wide electron temperature range below 5 × 10⁶ K, and the contribution of resonances has been included in the threshold regions. Comparisons are made with the earlier available theoretical and experimental rates, and it is concluded that the experimental rates are overestimated by up to a factor of 2.
1 Introduction
Emission lines of Fe xi have been observed in the ultraviolet (UV) and extreme-ultraviolet (EUV) range of the solar spectrum, as well as in late-type stars — see Gupta & Tayal (1999a) and references therein. Most of the observed lines lie in the 170–400 Å wavelength range, and arise from transitions among the fine-structure levels of the (1s22s22p6) 3s23p4, 3s3p5, 3s23p33d and 3p6 configurations. Additionally, many forbidden transitions of Fe xi lie in the 1000–3000 Å spectral range, and are observed in the spectra of solar-type stars and other astrophysical objects — see Bhatia & Doschek (1996) and references therein. Of particular interest among the Fe xi transitions is the 3P1−1S0 solar line at 1467.08 Å (Feldman 2001). The interpretation of the vast amount of observational data requires theoretical calculations of atomic parameters, such as energy levels, radiative rates, collision strengths and rate coefficients, because experimental data for these are generally not available. Therefore in this paper we attempt to report the values of these parameters for transitions in Fe xi.
Earlier calculations for Fe xi have been performed by many workers. The most notable among these are the ‘distorted-wave’ (DW) calculations of Bhatia & Doschek (1996) and the recent R-matrix results of Gupta & Tayal (1999a,b). Bhatia & Doschek have reported values of energy levels, radiative rates and collision strengths for transitions among the 48 fine-structure levels belonging to the above-noted configurations of Fe xi. However, Gupta & Tayal have also reported the values of effective collision strengths (ϒ), from which the corresponding values of excitation and de-excitation rate coefficients can easily be obtained. The calculations of the latter for Ω and ϒ have been performed for transitions among a subset (38 levels) of the above levels, but energy levels and radiative rates have been computed among the lowest 47 fine-structure levels. Since the remaining nine levels (5D0,1,2,3,4o, 3G3,4,5o and 1G4o) lie below the highest threshold of their calculations, they have clearly not included the resonances arising from these levels, and perhaps therefore have underestimated the values of ϒ for a majority of transitions. The other excluded (3p6 1S0) level is also just above the other remaining levels (see Table 1, later), and therefore its omission is not justified in any accurate calculation. Hence we strongly believe that there is scope to extend as well as to improve upon their results. Apart from this, Fe xi is one of the few iron ions for which experimental data for excitation rate coefficients are available in the literature (Wang, Datla & Griem 1984). Since the discrepancy between the theoretical and experimental rates is presently over a factor of 2 (see Table 7, later), we make here yet another effort on the theoretical side to explore these differences.
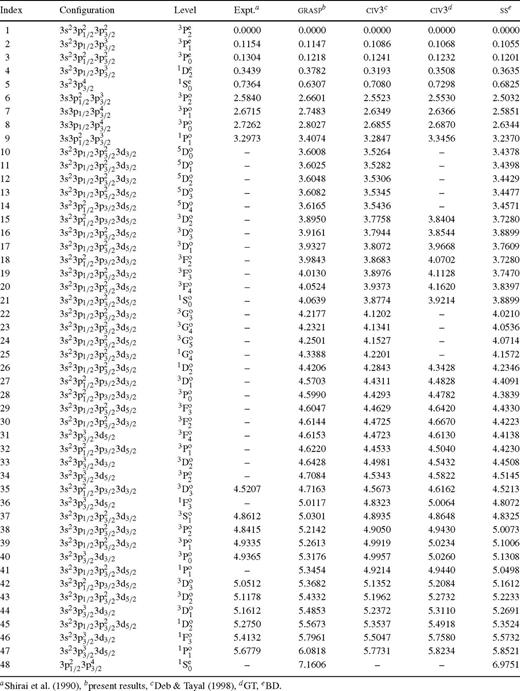
State definitions and energy levels (in Ryd) for S-like F xi.

Comparison of experimental and theoretical excitation rates (in units of 10−9 cm3 s−1 ) for transitions from the levels of the ground configuration (1s22s22p63s23p4) to excited levels of Fe xi at electron temperature 160 eV.
Bhatia & Doschek (1996) have employed the SuperStructure ( ss ) program of Eissner, Jones & Nussbaumer (1974) to generate their wavefunctions and the DW code of Eissner & Seaton (1972) to compute collision strengths. Their calculations are basically in the LS coupling scheme, and the results in the LSJ coupling scheme have been obtained through the jajom program of Saraph (1978). One-body relativistic operators have been incorporated through ‘term coupling coefficients’ (TCC). This approach gives reasonably satisfactory results if the fine-structure levels are not too far apart in energy, which is true in the case of Fe xi as seen in Table 1. However, this approach can only be applied when all channels are open, and this is the main reason why Bhatia & Doschek have produced values of Ω only at energies above thresholds. However, in doing so the important contribution of Feshbach (closed channel) resonances in the threshold region is omitted, and this may often enhance the values of ϒ by up to an order of magnitude depending on the transition and the temperature. To take account of the resonances, Gupta & Tayal (1999a,b) have employed the civ3 program of Hibbert (1975) to generate the wavefunctions, and the Breit—Pauli version of the R -matrix program of Scott & Taylor (1982) for the computations of Ω. This approach is similar to the one described above, but also allows the computation of Ω within the threshold region. However, in both of these approaches the calculations are semi-relativistic. In our calculations, the grasp program of Dyall et al. (1989) has been adopted for the generation of wavefunctions, and the recently developed Dirac Atomic R -matrix Code ( darc ) of Norrington & Grant (in preparation) for the computations of Ω. Both of these programs are fully relativistic and are based on the jj coupling scheme. Since all three sets of data for radiative rates and collision strengths are based on different independent programs, it will be interesting to make intercomparisons among them.
2 Energy Levels
The (1s22s22p6) 3s23p4, 3s3p5, 3s23p33d and 3p6 configurations of Fe xi give rise to 48 fine-structure levels, listed in Table 1. To calculate level energies, and oscillator strengths and radiative rates for allowed transitions among these levels, we have adopted the grasp (General purpose Relativistic Atomic Structure Program) code of Dyall et al. (1989). Thus relativistic effects have been fully taken into account, unlike earlier calculations which have neglected the two-body relativistic operators. However, Fe xi is an ion for which configuration interaction (CI) is equally important, in spite of its nuclear charge being comparatively quite high (Z = 26). Unlike the civ3 calculations, we cannot include too many configurations in our relativistic work. Therefore, based on our test calculations, we have also included CI among the additional 3s23p23d2, 3s23p34s, 3s23p34p and 3s23p34d configurations. These eight configurations in total give rise to 235 fine-structure levels of Fe xi, but all the 48 levels of the first four configurations lie below the levels of the last four configurations. Therefore there is no cross-over of the levels for which we are computing our results, and the role of the last four configurations is only to improve the wavefunctions. On the other hand, ss calculations of Bhatia & Doschek (1996) include CI among the first four basic configurations only, and hence confine the flux among the lowest 48 fine-structure levels arising from these configurations. However, the civ3 calculations of Deb & Tayal (1998) include elaborate CI involving all 4ℓ orbitals. We have excluded the 4f orbital from our calculations, because its inclusion results in an additional 40 levels, but makes a negligible difference to the values of transition energies and radiative rates.
In Table 1 we list our energy levels obtained with all eight configurations described above. The corresponding results obtained with the first four configurations differ negligibly (‼0.01 Ryd) from those listed in Table 1. Also included in this table are the civ3 energies obtained with a larger (1523 configurations and including up to 4f orbitals) and a limited (123 configurations and including 3ℓ and 4f orbitals only) set of configurations (Deb & Tayal 1998; Gupta & Tayal 1999b, respectively), and the ss energies of Bhatia & Doschek (1996). Available experimentally compiled energies of Shirai et al. (1990) are also included in Table 1. The energy orders of all the theoretical results are different for a few levels. Unfortunately, experimental values for all levels are not yet available, and therefore a correct energy order cannot be confirmed. However, among the available experimental energies, our level order differs only in one instance, namely for levels 37/38. For these two levels, the energy of the (3p33d) 3S1o level is below the 3P2o level in all theoretical work, and the difference between the two levels is only 0.02 Ryd. The agreement between our theoretical and available experimental energy levels is better than 10 per cent, except for 3s23p4 1S0, for which our energy is lower by 15 per cent. Energies of the larger civ3 calculations (Deb & Tayal 1998) are in better agreement with the measurements, but their energy order is different in a few instances, namely levels 21, 28, 32 and 41. civ3 results for the limited number of levels (Gupta & Tayal 1999b) agree within 5 per cent with the corresponding larger calculations, but the level order is different in the two calculations (see, for example, levels 21 and 37). Similarly, the level order of the ss calculations of Bhatia & Doschek (1996) is entirely different from both the theoretical and the experimental energy orders. However, the differences between various theoretical results are within ∼10 per cent, but future measurements of Fe xi spectral lines will perhaps be helpful in determining a correct energy order.
3 Radiative Rates and Oscillator Strengths

Transition energies (cm −1 ), oscillator strengths and radiative rates (s −1 ) for allowed transitions in S-like Fe xi.
In Table 3 we compare our oscillator strengths for a few representative transitions, the magnitudes of which are comparatively large, with those from the civ3 (Deb & Tayal 1998) and ss (Bhatia & Doschek 1996) calculations. Since all three calculations employ different amount of CI in the generation of the wavefunctions, differences among the three sets are expected. For the transitions listed in this table, all three sets of f-values agree to better than 50 per cent, but the ss values are the highest in general, although there are a few exceptions — see, for example, the 1–37 transition. This is because Bhatia & Doschek (1996) have included CI among the basic configurations only, as explained earlier. Therefore it is an expected result. However, for transitions involving levels 39 and 41 (3s23p33d 3Po1 and 1Po1), differences between our grasp and the civ3 and ssf-values are unexpectedly large. It appears that these two levels have been interchanged in the other two calculations. We have performed several test calculations, involving CI with different orbitals and configurations, and in each instance we obtain the same order of levels as given in Table 1. Therefore we are confident of the order of levels of our calculations. Nevertheless, if the civ3 and ssf-values for levels 39 and 41 are interchanged, then we obtain reasonably satisfactory agreement.
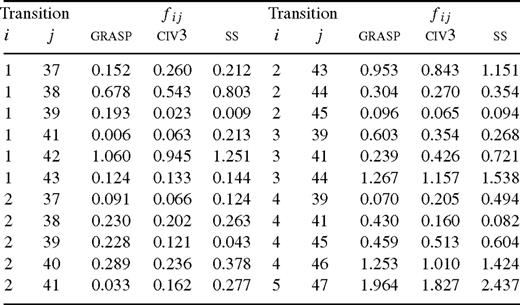
Comparison between our grasp, civ3 (Deb & Tayal 1996) and ss ( Bhatia & Doschek 1996 ) oscillator strengths for some transitions of Fe xi.
4 Collision Strengths
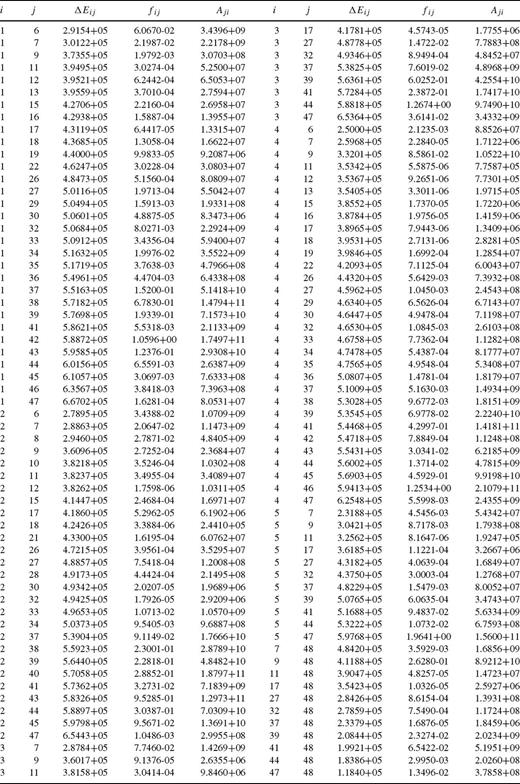
For the computations of collision strengths Ω, we have used the recently developed Dirac Atomic R-matrix Code (darc) of Norrington & Grant (in preparation). This program includes the relativistic effects in a systematic way, in both the target description and the scattering model. It is based on the jj coupling scheme, and uses the Dirac—Coulomb Hamiltonian in the R-matrix approach. However, because of the inclusion of fine structure in the definition of channel coupling, the matrix size of the Hamiltonian increases substantially, making the calculations computationally more expensive. The R-matrix radius has been assumed to be 5.4 au, and 25 continuum orbitals have been included for each channel angular momentum for the expansion of the wavefunction. This allows us to compute Ω up to an energy of 100 Ryd. The maximum number of channels for a partial wave is 228, and the corresponding size of the Hamiltonian matrix is 5921. In order to obtain convergence of Ω for all transitions and at all energies, we have included all partial waves with angular momentum J⩽ 40.5, although a higher range would have been preferable for the convergence of allowed transitions, especially at higher energies. Unfortunately, however, given the resources available to us, this was not possible. Nevertheless, to account for the inclusion of higher neglected partial waves, we have included a top-up, based on the Coulomb—Bethe approximation for allowed transitions and geometric series for forbidden transitions.
While computing Ω, the diagonal elements of the continuum Hamiltonian have been adjusted in accordance with the Breit- and QED-corrected threshold energies as listed in Table 1. This is acceptable because the differences between the two sets of threshold energies (with and without Breit and QED corrections) are small (⩽0.015 Ryd). However, this can only be performed if the energy ordering is the same in both sets of calculations, which is true in our case for the levels under consideration, as seen in Table 1. The procedure helps in correctly positioning the resonances in the threshold region.
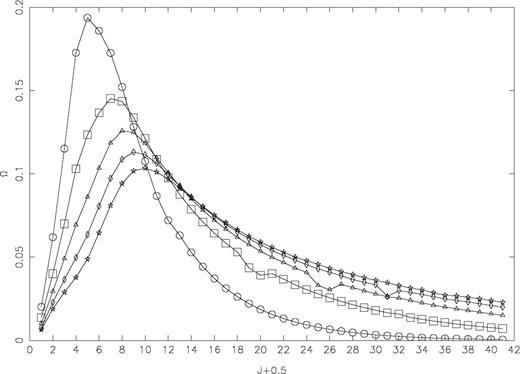
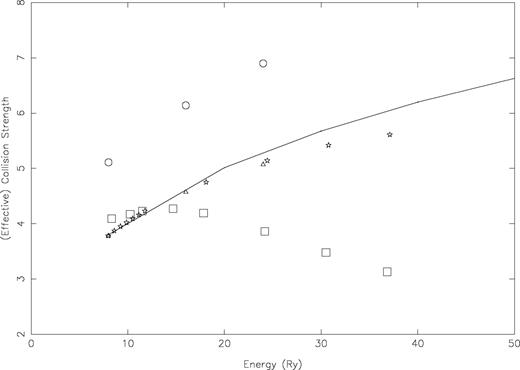
In Fig. 1 we show the variation of Ω with angular momentum J at three energies of 8, 16 and 24 Ryd, for the 1–37 (3s23p4 3P2−3s23p33d 3S1o) transition. The values of Ω have fully converged below J= 25.5. Both Bhatia & Doschek (1996, henceforth BD) and Gupta & Tayal (1999a,b, henceforth GT) have included the contribution of partial waves with J⩽ 17.5 before invoking the contribution of higher neglected partial waves from the Coulomb—Bethe approximation. Such a contribution of neglected partial waves will almost be negligible. However, for a few transitions, and particularly towards the higher end of our energy range, even this large set of partial waves is not sufficient for the convergence. We demonstrate this in Fig. 2 for the 4–9 (3s23p4 1D2−3s3p5 1P1o) transition.
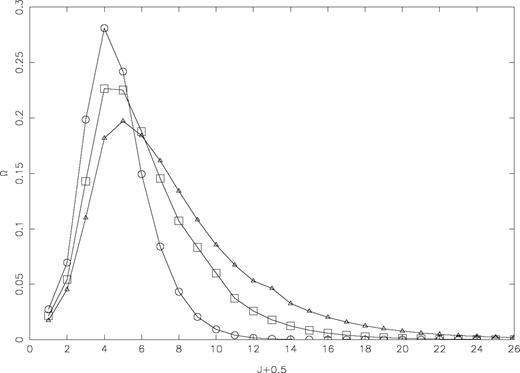
Partial collision strengths for the 3p4 3P2−3p33d 3S1o (1–37) transition of Fe xi. at three energies of 8 Ryd (circles), 16 Ryd (squares) and 24 Ryd (triangles).
Partial collision strengths for the 3s23p4 1D2−3s3p5 1P1o (4–9) transition of Fe xi. at five energies of 20 Ryd (circles), 40 Ryd (squares), 60 Ryd (triangles), 80 Ryd (diamonds) and 100 Ryd (stars).
The computed values of Ω for transitions from the levels of the ground configuration to higher excited levels are presented in Table 4 at three energies above thresholds, i.e. 8, 16 and 24 Ryd. Both BD and GT have reported their values of Ω at these three energies, and hence facilitate an easy comparison. Additionally, these transitions are the most relevant to our discussion of rates in Section 6. In Table 5 we compare our Ω-values, for a few representative transitions (including those within the levels of the ground configuration) with those of BD and GT. Most of these transitions are allowed, and hence have comparatively large magnitude. The differences among the three sets of Ω are up to a factor of 7 for some transitions, such as 1–41 and 2–41. While comparing the different sets of Ω, we are assuming an interchange of levels 39 and 41 in the calculations of BD and GT, as discussed above. Otherwise the differences between various calculations are much larger (up to a factor of 30). However, our darc and earlier DW values of Ω agree within 50 per cent for all transitions listed in this table, whereas the GT results do not agree with any of the other two calculations for a few transitions, such as 1–39, 2–45 and 3–5.
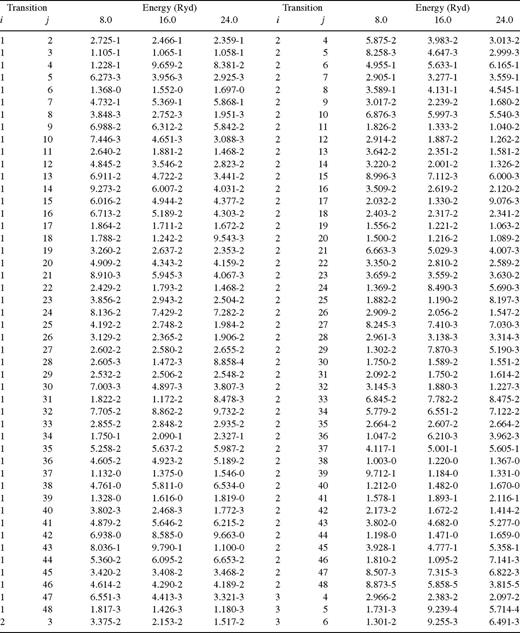
Collision strengths for transitions in Fe xi. a ± b ≡ a × 10 ± b.
Comparison between our present darc, DW (BD: Bhatia & Doschek 1996 ) and BPRM (GT: Gupta & Tayal 1999a,b ) collision strengths for some transitions of Fe xi. a ± b ≡ a × 10 ± b.
Differences between our present R-matrix and the earlier DW calculations are less than 50 per cent, and are in accordance with the corresponding f-values, i.e. if the f-value is higher then so is the value of Ω and vice versa. However, the reported values of Ω from GT are incompatible with their known f-values. This is because the f-values listed in Table 3 are those that have been obtained from a larger CI including 1523 configurations (Deb & Tayal 1998), whereas those used in their computations of Ω have been obtained from a limited set of CI including only 123 configurations (GT). This drastic reduction in the number of configurations (by over an order of magnitude) has perhaps significantly altered the f-values, especially for those transitions for which their magnitude is comparatively smaller. Therefore the Ω-values of GT are comparatively less accurate than their energy levels or radiative rates.
A transition for which the GT values of Ω are higher by up to a factor of 40 is 3P0−1S0 (3–5). This is a spin-forbidden 0-0 transition of the same parity, and hence its Ω-value is not expected to be significantly large, which is further confirmed by an agreement of better than 5 per cent between our darc results and the DW results of BD. Furthermore, the variation of GT's Ω is less than 5 per cent in a wide energy range of 16 Ryd, whereas in our darc and earlier DW calculations it is reduced by a factor of 3 in the same energy range. Therefore it appears that the GT values of Ω have some inherent error, and certainly for the 3–5 transition. Incidentally, this is the same type of transition for which Griffin et al. (1999a,b) also reported an enhanced effect in the values of Ω for transitions in Fe xv— see Aggarwal et al. (2000) for details and examples. This was because of errors in the version of the R-matrix program that they used, which have subsequently been corrected (Griffin & Badnell 2000). We suspect that the version of the R-matrix program adopted by GT may have similar problems, hence resulting in unexpectedly large values of Ω, especially for those weaker transitions the magnitudes of which are comparatively small.
5 Effective Collision Strengths

Since the threshold region is dominated by numerous resonances, Ω need to be computed in a fine mesh of energy. Close to thresholds our energy mesh is 0.001 Ryd, and it is 0.002 Ryd in the remaining range. In total, values of Ω have been computed at 4487 energies in the threshold region below 7.16 Ryd. This fine energy mesh ensures to a large extent that we do not miss the majority of resonances and that the exceptionally high resonances do not have unreasonably large width. In Fig. 3 we show resonances for only one transition, namely 3P2−3P1 (1–2). These resonances give enough idea of their density as well as their importance. Additionally, resonances for this (and many other) transitions have fully converged up to an energy of ∼5.5 Ryd.
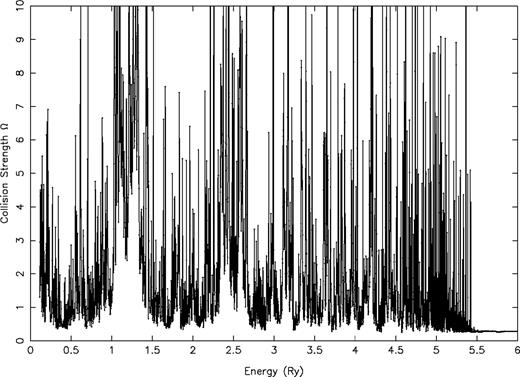
Collision strengths (Ω) for the (3s23p4) 3P2−3P1 (1–2) transition of Fe xi.
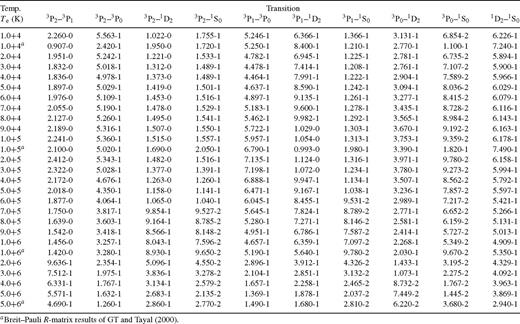
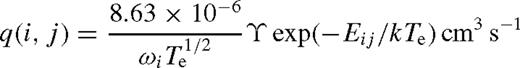
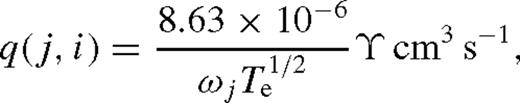
In Table 6 we list our values of ϒ for 10 fine-structure transitions within the levels of the 3s23p4 configuration of Fe xi in a wide temperature range of 104 to 5 × 10⁶ K, suitable for applications in a wide variety of astrophysical, laser and fusion plasmas. This is also the temperature range in which GT (and Tayal 2000) have reported their results. For the first two transitions (1–2 and 1–3) our values of ϒ are higher than those of GT by over a factor of 2 at the lowest temperature. This large difference in the two sets of ϒ quickly disappears as temperature increases. This is demonstrated in Fig. 4 for the 1–2, 1–3 and 1–4 transitions in a temperature range below 5 × 10⁵ K. Clearly our results are not only significantly different from those of GT but also show the opposite behaviour at lower temperatures for all three transitions. This is because of near-threshold resonances as seen in Fig. 3. However, our ϒ results are higher only for the 1–2 and 1–3 transitions; they are lower by nearly the same factor of 2 for the 1–4 (3P2−1D2) transition. For this transition the two sets of Ω agree within 10 per cent at all three energies as seen in Table 5, and the threshold energy of the 1D2 level also agrees within 7 per cent as seen in Table 1. Additionally, we observe the same near-threshold resonances (but to a lesser extent) for this transition (not shown) as seen in Fig. 3. One explanation for this anomaly could be the slightly higher values of the GT results for Ω as seen in Table 5, but this does not fully explain the large difference between the two calculations. The real reason, in our opinion, could be the lower 1D2 level energy (by 0.0274 Ryd) of their calculations, which may result in additional near-threshold resonances and hence enhance the values of ϒ particularly at lower temperatures. In view of the many near-threshold resonances, the uncertainty in the GT calculations could be higher, because the resolution of their data is coarser, i.e. 0.005 Ryd in comparison with our better than 0.002 Ryd. They have computed their values of Ω at 1130 energies in the threshold region in comparison with our ∼ 4500 energies as stated above. This coarser mesh can obviously affect the results significantly by either omitting many of the resonances or accounting for their larger widths.
Effective collision strengths for transitions among the levels of the 1s 2 2s 2 2p 6 3s 2 3p 4 configuration of Fe xi. a ± b ≡ a × 10 ± b.
Comparison of effective collision strengths (ϒ) for the (3s23p4) 3P2−3P1, 3P0, 1D2 (1–2, 3, 4) transitions of Fe xi. Continuous curve: present R -matrix results; broken curve: Breit—Pauli R -matrix results of GT and Tayal (2000) ; circles: 1–2; triangles: 1–3; and line with no symbol: 1–4 transition.
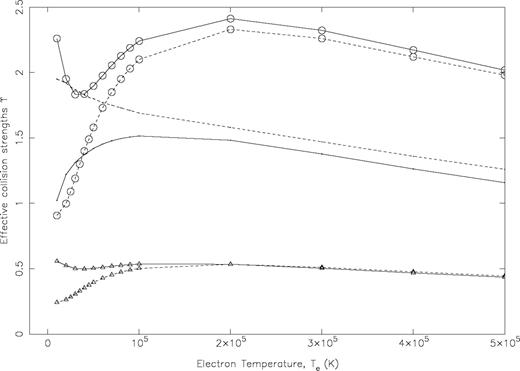
In Fig. 5 we show the variation of ϒ with temperature for four more transitions, namely 2–3, 2–4, 2–5 and 3–4. Differences between the two sets of ϒ for these transitions are not as striking as observed for those from the ground level, and are restricted to less than 50 per cent. However, the differences persist in the entire temperature range and are due to our better resolution of resonances and a higher range of energy for Ω, i.e. 100 Ryd in comparison with only 40 Ryd in the GT calculations. The other transition for which the two calculations consistently differ in the entire temperature range is 3P0−1S0 (3–5). For this transition the GT results are higher by a factor of 2. The possibility of error in the GT calculations of Ω for this transition in particular has already been discussed in Section 4.
Comparison of effective collision strengths (ϒ) for the (3s23p4) 3P1−3P0, 1D2, 1S0 (2–3, 4, 5) and 3P0−1D2 (3–4) transitions of Fe xi. Continuous curve: present R -matrix results; broken curve: Breit—Pauli R -matrix results of GT and Tayal (2000) ; circles: 2–3; squares: 2–4; triangles: 2–5; no symbol: 3–4 transition.
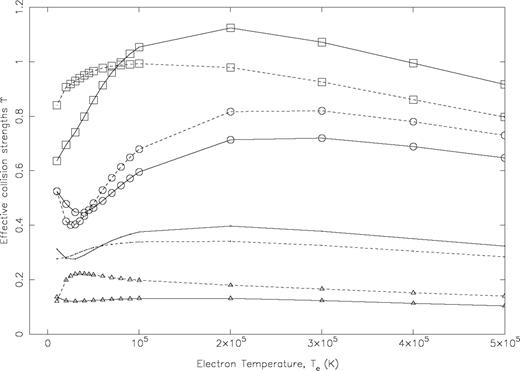
Finally, in Figs 6 and 7 we show the variation of our ϒ-values for two representative transitions, namely 1–42 (3p4 3P2−3p33d 3D3o) and 2–43 (3p4 3P1−3p33d 3D2o), respectively, in a limited temperature range of ∼4 × 10⁵−5 × 10⁶ K. However, the temperatures are shown here in rydberg units, in order to facilitate comparison with the corresponding values of Ω, which are also shown in these figures. The available results of GT are also shown in these figures for both Ω as well as ϒ. Additionally, the other available values of Ω by BD are also included for comparison. For these transitions there is complete agreement between our results and the GT values of Ω, but those of BD are larger because of their higher f-values. However, with increasing energy all sets of Ω-values increase, as expected, as these are allowed transitions. Correspondingly, our values of ϒ also increase with increasing temperature (energy), whereas those of GT are (unexpectedly) decreasing. At the highest temperature of 5.0 × 10⁶ K, the GT values of ϒ are underestimated by over a factor of 2. This is because GT have performed their calculations for Ω up to an energy of 40 Ryd only, and this is not sufficient for the convergence of the integral in equation (2). This is the main reason that we have performed our calculations up to an energy of 100 Ryd, so that values of ϒ can be safely determined up to a temperature of ∼5 × 10⁶ K, suitable for applications in astrophysical, laser and fusion plasmas.

Comparison of collision strengths (Ω) and effective collision strengths (ϒ) for the 3p4 3P2−3p33d 3D3o (1–42) transition of Fe xi, as a function of energy. Continuous curve: present R -matrix results for Ω; circles: Ω of BD; triangles: Ω of GT; squares: ϒ-values of GT; stars: our present ϒ-values.
Comparison of collision strengths (Ω) and effective collision strengths (ϒ) for the 3p4 3P1−3p33d 3D2o (2–43) transition of Fe xi, as a function of energy. Continuous curve: present R -matrix results for Ω; circles: Ω of BD; triangles: Ω of GT; squares: ϒ-values of GT; stars: our present ϒ values.
6 Excitation Rate Coefficients
In Table 7 we compare the experimental (Wang et al. 1984) and our theoretical values of excitation rates at an electron temperature of Te= 160 eV. The rates presented in this table are the statistical average of the levels (3P2,1,0, 1D2 and 1S0) of the ground configuration (1s22s22p63s23p4) to the four excited levels of the 3p33d (1F3o, 3D1o, 1D2o and 3P2o) and two levels (3Po1 and 1P1o) of the 3s3p3 configurations. Also included in this table are the corresponding rates of GT and those calculated from the Ω data of BD at an energy of 16 Ryd, which is close to the temperature of 160 eV.
The difference between the experimental and theoretical rates is over a factor of 2 (see, for example, the 3P1o level). Rates derived from the Ω data of BD are in closest agreement with the corresponding experimental rates, and the differences are within 50 per cent except for the 3P1o level. However, this close agreement is misleading as the dominant contribution in these rates comes from the strong allowed transitions [for example, the 4–46 (3s23p4 1D2−3s23p33d 1F3o) transition for the 1F3o level rates], for which the f-values and subsequently the Ω-values of BD are clearly overestimated, as discussed above and shown in Tables 3 and 5. The discrepancy between our theoretical and available experimental rates is also ∼50 per cent, except for the 1Do2 level for which our rates are lower by a factor of 2. However, Wang et al. (1984) have estimated that their experimental determination of average rates may be overestimated by a factor of 1.5–2.0. Taking this assessment into account, we can state that the theory and experiment agree well, and the presently determined experimental rates are indeed overestimated by up to a factor of 2.
7 Conclusions
In this paper we have reported a consistent set of results for energy levels, radiative rates, collision strengths and effective collision strengths for transitions among the 48 fine-structure levels of Fe xi. Relativistic effects and CI have been included while generating the wavefunctions, and a large range of partial waves has been included to ensure the convergence of Ω. Furthermore, resonances have been included in a fine energy mesh in order to determine the effective collision strengths. Different theoretical results provide slightly different level ordering. We are confident of our level order, but, in the absence of corresponding experimental energies for all levels, scope remains for adjustment. Differences among various sets of oscillator strengths are within a factor of 2 for a majority of strong allowed transitions, because of different amounts of CI included in the various calculations. Our results have included CI among 235 configurations to determine radiative rates among the lowest 48 fine-structure levels, but scope remains for further improvement. The differences between our present R-matrix and the earlier available DW values of Ω are in accordance with the differences in wavefunctions, whereas the similar results of Gupta & Tayal (1999a,b) appear to be incompatible with their known values of oscillator strengths. Additionally, their calculations for ϒ are underestimated by up to a factor of 2, especially for the allowed transitions. This is because of the limited energy range included in their calculations of ϒ-values.
We do not see any apparent deficiency in our calculations, but past experience shows that accuracy estimates can easily be in error. Nevertheless, our calculated values of collision strengths are expected to be accurate to better than 10 per cent at energies below 25 Ryd (because of convergence of all transitions), but may be inaccurate by up to 20 per cent at higher energies for a few allowed transitions. This estimate is based on the presently determined values of oscillator strengths. As scope remains for improvement in our wavefunctions (by including additional CI), the present values of Ω may easily differ by a factor of 2, especially for weaker transitions. However, the corresponding values of Ω for stronger transitions are unlikely to vary by more than 20 per cent, as has been confirmed by our test calculations including additional CI.
Our calculations should represent an improvement over the latest available results of Tayal and co-workers (Gupta & Tayal 1999a,b; Tayal 2000), who have (i) included CI among only 123 configurations in comparison with our 235, (ii) included only one-body relativistic operators in the Breit—Pauli R-matrix approach in comparison with our fully relativistic calculations in the jj coupling scheme, (iii) included resonances among only 38 levels in comparison with our 48, and (iv) adopted a coarse energy mesh of 0.005 Ryd in comparison with our better than 0.002 Ryd. Additionally, their calculations for Ω are restricted to electron energy up to 40 Ryd and partial wave range up to 17.5, whereas we have extended the energy range up to 100 Ryd and the partial wave range up to 40.5. Therefore the presently reported results are probably the most reliable available to date and are expected to be accurate to better than 10 per cent, especially at temperatures above 105 K. Owing to the presence (or absence) of many near-threshold resonances, accuracy estimates at lower temperatures are insecure. However, in spite of the above-noted improvements in the calculations of excitation rates, the discrepancy of a factor of 2 between theory and experiment remains, and it is concluded that the experimental results are indeed overestimated. Additionally, in the present work we have reported and discussed results for a few transitions only, whereas calculations have been performed for all 1128 transitions among the 48 fine-structure levels of Fe xi. A complete set of results for both Ω and ϒ in a wider energy/temperature range will be reported in a future communication.
Adopting the earlier available ϒ data of GT, Pinfield et al. (2001) have analysed many EUV lines of Fe xi, which is formed in the temperature range of 6 × 10⁵ to 3 × 10⁶ K. Since the GT values of ϒ are underestimated for many of the observed lines (see table 1 of Pinfield et al.), especially at higher temperatures as discussed in Section 6 and demonstrated in Figs 6 and 7, the presently reported results should be of considerable significance for astrophysical applications. We hope to investigate the effect of present improved atomic data in our future work.
Acknowledgments
This work has been financed by the EPSRC and PPARC of the United Kingdom, and we thank Dr Patrick Norrington for making his code available to us prior to publication.
References
Author notes
E-mail: [email protected]
