


Abstract
The internal properties of the neutron star crust can be probed by observing the epoch of thermal relaxation. After the supernova explosion, powerful neutrino emission quickly cools the stellar core, while the crust stays hot. The cooling wave then propagates through the crust, as a result of its finite thermal conductivity. When the cooling wave reaches the surface (age 10–100 yr), the effective temperature drops sharply from 250 eV to 30 or 100 eV, depending on the cooling model. The crust relaxation time is sensitive to the (poorly known) microscopic properties of matter of subnuclear density, such as the heat capacity, thermal conductivity, and superfluidity of free neutrons. We calculate the cooling models with the new values of the electron thermal conductivity in the inner crust, based on a realistic treatment of the shapes of atomic nuclei. Superfluid effects may shorten the relaxation time by a factor of 4. The comparison of theoretical cooling curves with observations provides a potentially powerful method of studying the properties of the neutron superfluid and highly unusual atomic nuclei in the inner crust.
1 Introduction
Neutron stars are natural astrophysical laboratories of superdense matter. In their cores, at densities above the nuclear matter density  , the properties of matter, such as equation of state and even composition, are largely unknown (e.g. Lattimer & Prakash 2000, and references therein). In the absence of an exact theory of superdense matter, different theoretical models predict different equations of state and compositions (neutrons, protons and electrons; hyperons; pion or kaon condensates; deconfined quarks).
One of the potentially powerful methods used to probe the internal structure of isolated neutron stars is modelling their cooling (e.g. Pethick 1992; Page & Applegate 1992; Page 1998a,b). The theoretical cooling curves depend on the adopted physical models of the stellar interior, especially the neutrino emission and heat capacity, as well as the superfluidity of neutrons and protons in the core. Confronting theory and observations allows one, for example, to constrain the range of the critical temperatures of the superfluidity (e.g. Yakovlev et al. 1999).
Observing the thermal emission of the very young neutron stars, with  , opens a possibility of studying the properties of the neutron star crust. Soon after a supernova explosion, the young star has large temperature gradients in the inner parts of the crust. While the powerful neutrino emission quickly cools the core, the crust stays hot. The heat gradually flows inward on a conduction time-scale, and the whole process can be thought of as a cooling wave propagation from the centre towards the surface. During this thermal relaxation the effective temperature stays almost constant at about 250 eV. When the cooling wave reaches the surface, the effective temperature drops sharply by as much as an order of magnitude in the fast-cooling scenario, and by a factor of
  in the slow-cooling scenario. The duration of the relaxation epoch depends mainly on the heat capacity and the thermal conductivity of the inner crust (Lattimer et al. 1994).
Although the equation of state of matter at subnuclear density is known accurately enough (Negele & Vautherin 1973; Pethick & Ravenhall 1995), the properties of atomic nuclei are not. The nuclei become unusually neutron-rich, with the smooth proton and neutron distributions. At the bottom of the crust  , the nuclei can be non-spherical and form clusters (Lorenz, Ravenhall & Pethick 1993; Pethick & Ravenhall 1995). The liquid of neutrons dripped from the nuclei may be superfluid, with critical temperatures that are very model-dependent. The thermodynamic and transport properties of this matter are subjects of large theoretical uncertainty.
In this paper we make improved models of the young neutron stars. We obtain the new values of the electron thermal conductivity in the inner crust, based on a realistic treatment of the shapes of atomic nuclei. Using a new numerical code, we calculate the cooling models and determine the duration of the thermal relaxation epoch. We extend the analysis of Lattimer et al. (1994) and derive the dependence of the relaxation time on the microscopic parameters of the crust. Our preliminary results have been summarized by Yakovlev et al. (2001a).
2 Cooling model
2.1 Equations of thermal evolution
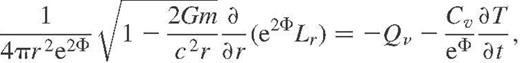
Neutron stars are born very hot in supernova explosions, with the internal temperature  , but gradually cool down. About 20 s after birth, they become fully transparent for the neutrinos generated in numerous reactions in stellar interiors. We consider the cooling in the following neutrino-transparent stage. The cooling is realized via two channels, by neutrino emission from the entire stellar body and by heat conduction from the internal layers to the surface resulting in thermal emission of photons. For simplicity, we neglect the possible reheating mechanisms (frictional dissipation of the rotational energy, Ohmic decay of the internal magnetic field, or the dissipation associated with weak deviations from the chemical equilibrium; see, e.g., Page 1998a).
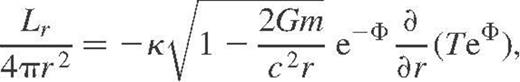
 becomes constant throughout the interior.
It is conventional (Gudmundsson, Pethick & Epstein 1983) to subdivide the calculation of heat transport in the neutron star interior  and in the outer heat-blanketing envelope
  , where R is the stellar radius, and the boundary radius Rb corresponds to the density
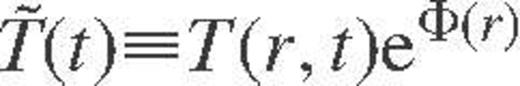
  (∼100 m under the surface). The thermal structure of the blanketing envelope is studied separately in the stationary, plane-parallel approximations in order to relate the effective surface temperature Ts to the temperature at the inner boundary of the envelope Tb. We use the
  relation obtained by Potekhin, Chabrier & Yakovlev (1997) for the envelope, which is composed mostly of iron.
The effective temperature determines the photon luminosity;  . Both L and Ts refer to the locally flat reference frame on the surface. A distant observer would register the ‘apparent’ luminosity as
  and the ‘apparent’ effective temperature as
  , where
  is the gravitational radius. Typically,
  per cent.
We have developed a new evolutionary code based on the Henyey-type scheme on a grid of spherical shells (Kippenhahn, Weigert & Hofmeister 1967). The hydrostatic model of the neutron star with a given equation of state is calculated separately and is fixed throughout the calculation. In the initial configuration the star has a constant redshifted temperature throughout the interior,  , and no heat flux,
  . Also, to improve numerical convergence, the thermal conductivity in the core is boosted for the initial epoch
  . As the crust is thermally detached from the core at such a small age, this correction has no effect on the cooling curves. Full details of the new code are available on the Internet (http://www.ast.cam.ac.uk/,ognedin/ns/ns.html).
2.2 Physics input
We use the equation of state of Negele & Vautherin (1973) in the stellar crust with the smooth composition model of ground-state matter to describe the properties of atomic nuclei (Kaminker et al. 1999). We assume that the nuclei are spherical throughout the entire crust. The core–crust interface is placed at  . For simplicity, we consider the neutron star cores to be composed of neutrons (n), protons (p) and electrons (e) and use the moderately stiff phenomenological equation of state of Prakash, Ainsworth & Lattimer (1988) (in the simplified version proposed by Page & Applegate 1992), in agreement with our previous work (Yakovlev et al. 1999 and references therein).
The parameters of the models are summarized in Table 1. It shows the stellar masses, radii, central densities, crust masses and crust thicknesses for a number of models. The maximum mass of the stable neutron stars with this equation of state is 1.73 M⊙. We define the crust thickness as  , while the proper geometrical thickness (for
  is
is  . As we increase the mass M, the radii and crust masses of the stable configurations get smaller, i.e. the stars become more compact.
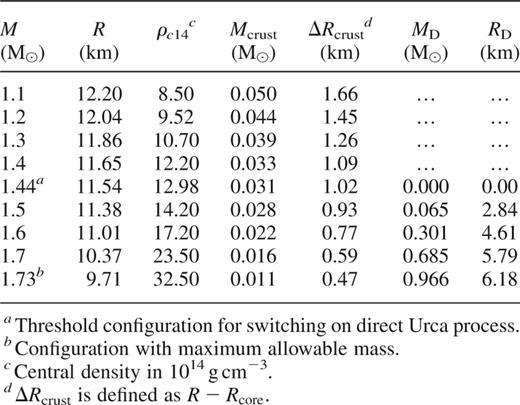
Neutron star models.
Free neutrons in the inner crust and both neutrons and protons in the core of a neutron star are likely to be superfluid. We assume the singlet-state pairing of the protons in the core. The superfluidity of the free neutrons in the crust and of the neutrons in the outermost part of the core is known to be of the singlet-state type, but at higher densities it switches to the triplet-state type. Various microscopic theories predict a large scatter of the critical temperatures of the neutron and proton superfluids, Tcn and Tcp, depending on the nucleon–nucleon potential model and the many-body theory employed (see Yakovlev et al. 1999 for references).
As an example we will use two models, a weak and a strong superfluidity (Fig. 1). The model of strong superfluidity corresponds to the higher Tc. It is based on the rather large energy gaps calculated by Elgarøy et al. (1996) for the singlet-state pairing (with the maximum gap of about 2.5 MeV) and by Hoffberg et al. (1970) for the triplet-state pairing. The weak superfluid model makes use of the smaller gaps derived by Wambach, Ainsworth & Pines (1993) (with the maximum gap of about 1 MeV) for the singlet-state superfluid and by Amundsen & Østgaard (1985) for the triplet-state neutron superfluid. For simplicity, we use the same function Tc(n) to describe the singlet pairing of free neutrons in the crust  and of the protons in the core
  .
.
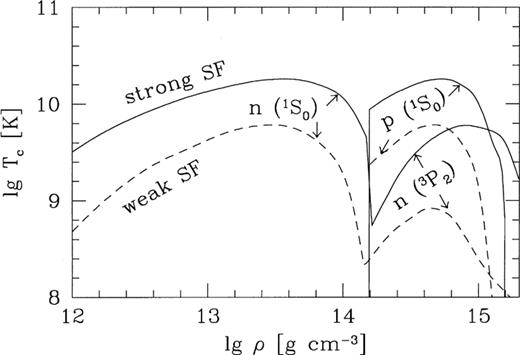
Density dependence of the critical temperatures of superfluidity (SF) of free neutrons in the inner crust, and neutrons and protons in the core for the strong (solid lines) and weak (dashed lines) superfluid models (see text for details).
The cooling of neutron stars is mainly determined by the neutrino emissivity, specific heat capacity and thermal conductivity. We include all the relevant sources of neutrino emission (Yakovlev et al. 1999, 2001b): the direct and modified Urca processes, nn, pp and np bremsstrahlung in the core; and plasmon decay,  pair annihilation, electron–nucleus (eZ) and nn bremsstrahlung in the crust. The emissivity of the proton branch of the modified Urca process derived by Yakovlev & Levenfish (1995) has been corrected by Yakovlev et al. (2001), which has almost no effect on the cooling curves. We include the proper reduction of the neutrino reactions by superfluidity and also an additional neutrino emission that is a result of Cooper pairing of superfluid nucleons. The effective nucleon masses in the core and the crust are set equal to 0.7 of their bare masses.
A very important cooling effect is produced by the powerful direct Urca process (Lattimer et al. 1991). For our equation of state, this process is allowed at densities above the threshold,  . If the central density of the model exceeds the threshold,
  , the stellar core has a central kernel where the direct Urca process leads to fast cooling. The masses and radii of these kernels, MD and RD, are given in Table 1. The mass of the central kernel increases rapidly with M. In addition, we show the threshold configuration with
  . It separates the low-mass models, where the direct Urca process is forbidden, from the high-mass models, where the direct Urca is allowed.
For illustration, Fig. 2 shows the emissivity of various neutrino processes versus density at  . The plasmon decay is a powerful neutrino emission mechanism in a hot crust at not very high densities, but it fades away quickly when the temperature decreases below 109 K. The electron–nucleus bremsstrahlung is efficient throughout the entire crust. In superfluid crusts, the Cooper pairing neutrino emission switches on at temperatures
  , reaches maximum at T slightly below Tcn, and fades away exponentially for
  . In the neutron star core, a large jump of the neutrino emissivity at
  is associated with the direct Urca process.

Density dependence of the neutrino emissivity at  . Solid lines: partial emissivities due to electron–nucleus bremsstrahlung (e-brems) and plasmon decay (plasma) in the crust and the total emissivity produced by direct and modified Urca processes and by nucleon-nucleon (NN) bremsstrahlung in the nonsuperfluid core. Dashed and dash-dot lines: the emissivity due to Cooper pairing of neutrons for the models of strong and weak superfluidity in the crust. Vertical dotted lines indicate the neutron drip density and the boundary of the core.
The heat capacity is contributed to by neutrons, protons and electrons in the core, and by electrons, free neutrons and atomic nuclei (vibrations of ions in Coulomb lattice) in the crust. The superfluid effects on the heat capacity of nucleons in the core and of free neutrons in the crust are incorporated according to Levenfish & Yakovlev (1994). In the absence of superfluidity, the neutrons would have the dominant contribution in the core and the inner crust. The effects of neutron superfluidity are illustrated in Fig. 3 in the case of crust superfluidity. When T falls only slightly below Tcn, the superfluidity increases the neutron heat capacity caused by the latent heat released at the phase transition. However, for  the superfluidity exponentially reduces the heat capacity. If the stellar crust was sufficiently colder than in Fig. 3, any neutron superfluid would reduce the contribution of free neutrons to negligibly small values, and the heat capacity would be determined by the ions and electrons. These effects are analogous in the core. The heat capacity in the superfluid core at
  and
and  would be determined by the electrons.
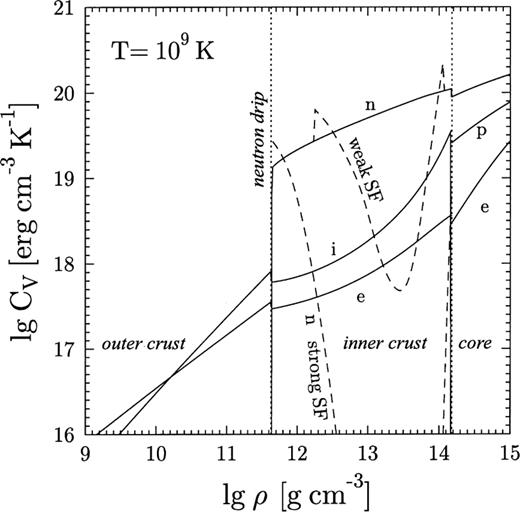
Density dependence of the specific heat capacity at  . Solid lines: partial heat capacities of ions (i), electrons (e) and free neutrons (n) in non-superfluid crusts, as well as of neutrons, protons (p) and electrons in nonsuperfluid cores. Dashed lines: heat capacities of free neutrons in the crust modified by weak or strong superfluidity.
The thermal conductivity in the core is taken as a sum of the conductivities of the electrons (Gnedin & Yakovlev 1995) and neutrons (Baiko, Haensel & Yakovlev 2001). The electron contribution usually dominates. The conductivity in the crust is assumed to be as a result of the electron scattering off atomic nuclei. In the outer crust the finite size of the proton charge distribution within a nucleus can be neglected. We use the recent results of Potekhin et al. (1999), which include the multiphonon processes in electron–nucleus scattering in a Coulomb solid and incipient long-range nucleus–nucleus correlations in a strongly coupled Coulomb liquid of atomic nuclei. In the inner crust, we have performed original calculations using the same formalism but have taken into account the finite size of the proton core of atomic nuclei (finite-size nuclei). Details of the calculations and the numerical fits are given in the Appendix.
The results are illustrated in Fig. 4, which shows the density profiles of the electron thermal conductivity for  , 108 and 109 K. The conductivity in the core is several orders of magnitude higher than in the crust, because there are not as efficient electron scatterers in the core as atomic nuclei. In the crust we plot the thermal conductivity for finite-size nuclei (solid lines) and for point-like nuclei (dashed lines). The finite-size effects are negligible near the neutron drip point but increase the conductivity at the crust base
  by a factor of
  .
.
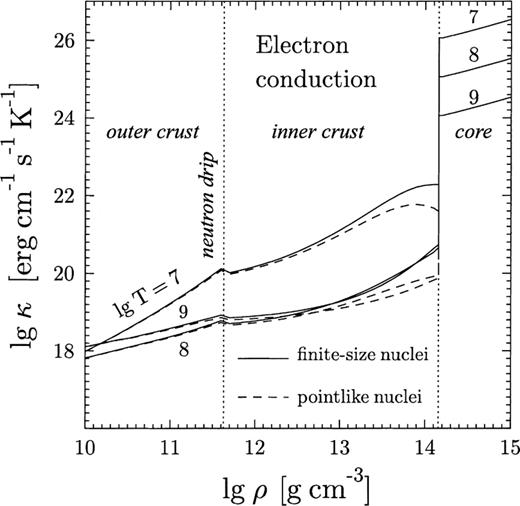
Density dependence of the electron thermal conductivity at  , 108 and 109 K in the core and the crust.
Another contribution to the thermal conductivity in the crust may come from the scattering of electrons off charged impurities, which are the randomly distributed nuclei of different elements. However, the most important temperature interval for neutron star cooling is ∼ . We have verified that the thermal conductivity is almost unaffected by the impurities in this temperature interval (for a not very impure matter,
  , where Qimp is the impurity parameter as defined in the Appendix), although they can noticeably decrease the conductivity at lower T. Therefore, we neglect the effects of impurities in the present calculations.
3 Thermal relaxation in non-superfluid neutron stars
First, consider thermal relaxation in a young non-superfluid neutron star. The main features of the process are known from previous cooling simulations (Page & Applegate 1992; Lattimer et al. 1994; Page 1998a,b; and references therein).
Fig. 5 shows some cooling models of neutron stars with different masses. In the low-mass models,  , the direct Urca process is forbidden. These stars follow the standard cooling scenario and the cooling curves are almost independent of M. The high-mass models go through the fast-cooling scenario and demonstrate a spectacular drop in surface temperature at the end of the thermal relaxation epoch,
  , as a result of the emergence of the cooling wave on the surface. The same, although much less pronounced, effect takes place in the case of slow cooling.
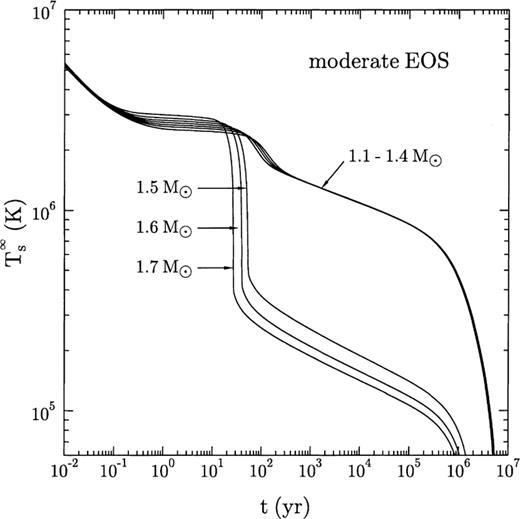
Cooling curves for non-superfluid neutron star models with 1.1, 1.2 …, 1.7 M⊙.
As the neutrino emissivity of the direct Urca process is several orders of magnitude larger than that of the modified Urca processes, the fast-cooling regime is established even if the central kernel, where the direct Urca process is allowed, occupies a small fraction of the stellar core (Page & Applegate 1992). For the high-mass stars  , the cooling curves again depend weakly on the mass. The change of the slope of the cooling curves at
  manifests the transition from the neutrino to the photon cooling stage.
The surface temperature at the initial cooling stage (the first 100 years) is rather independent of the equation of state, the stellar mass or the core neutrino luminosity. The surface temperature is mainly determined by the physical properties of matter in the crust. The core and the crust are thermally decoupled, and the effective surface temperature does not reflect the thermal state of the stellar core.
In contrast, the evolution of the central temperature, T(0, t), is drastically different for the slow- and fast-cooling scenarios. In all low-mass models,  throughout the neutrino cooling era,
  , with a small offset in normalization. This follows from the simple power-law temperature dependence of the heat capacity
  and the standard neutrino emissivity
  . In the models with fast cooling, where the dominant neutrino process is the direct Urca
  , the scaling relation is
  for the initial period
  . However, until
  the central temperature remains almost constant at 108 K as the heat flows from the warmer outer core, in which direct Urca process is prohibited, into the inner core. During the thermal relaxation epoch,
  , the central temperature falls again by a factor of several. After the thermalization until the end of the neutrino era, once again
  .
.
Figs 6 and 7 illustrate the effects of thermal relaxation on the internal temperature profiles in the slow- and fast-cooling scenarios, respectively. Until the age of about 1 yr, the neutron star core and the inner and outer crusts form almost independent thermal reservoirs. The region around  , where free neutrons appear in the crust, seems to be the most effective at cooling, owing to the powerful neutrino emission (see below). The outer crust cools to 109 K in less than a month, while the inner parts remain much hotter. The core also cools independently but is unable to affect the inner crust because of the slow thermal conduction. During the first years the central kernel of the 1.7 M⊙ model in Fig. 7 remains much colder than the outer core. This is because the kernel is cooled by the powerful direct Urca process and thermal conduction is still unable to establish thermal relaxation throughout the core. Almost full core relaxation is achieved in 10 yr.
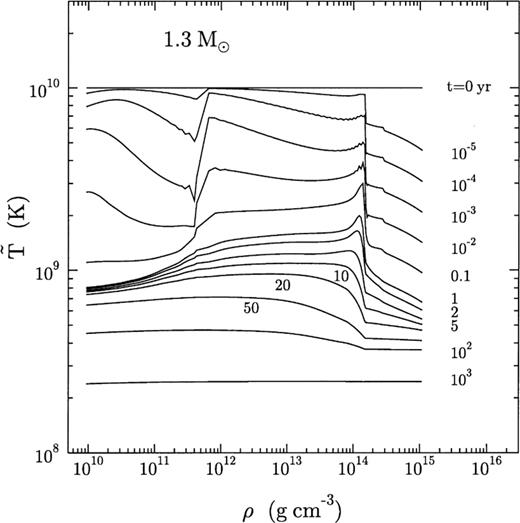
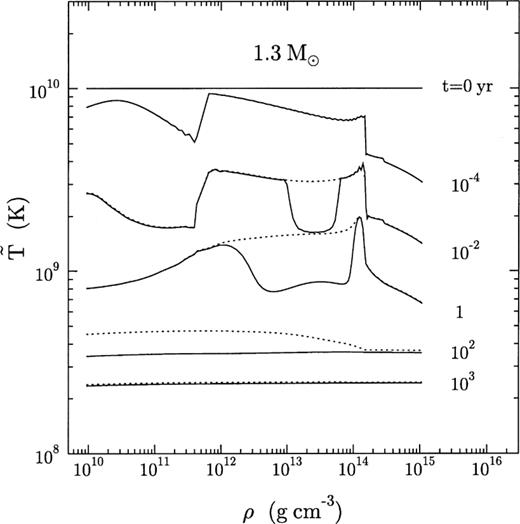
Temperature profiles in the 1.3-M⊙ neutron star without superfluid effects. The numbers next to the curves show stellar age. Contours are at 0, 10−5, 10−4, 10−3, 10−2, 10−1, 1, 2, 5, 10, 20, 50, 100 and 1000 yr.
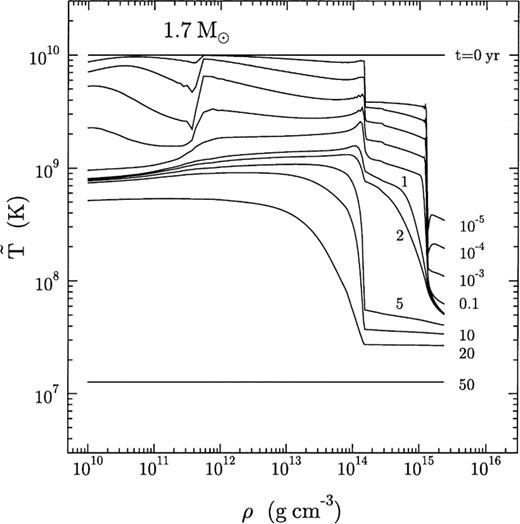
Temperature profiles in the 1.7-M⊙ neutron star without superfluid effects. The contours are at 0, 10−5, 10−4, 10−3, 10−2, 10−1, 1, 2, 5, 10, 20 and 50 yr.
After the first year, the crust temperature profiles of the slow- and fast-cooling scenarios start to differ. In the former, the temperature gradient between the core and the crust is slowly eroded, as the cooling wave from the centre reaches the surface. In the latter, the temperature gradient continues to grow until it reaches a maximum at  . Then a huge amount of heat is released from the crust and leads to a spectacular drop in the surface temperature by an order of magnitude (which lowers the photon luminosity by four orders of magnitude). At
  , the entire star is already isothermal. Note that, despite larger temperature gradients, thermal relaxation proceeds more quickly overall in the fast cooling scenario.
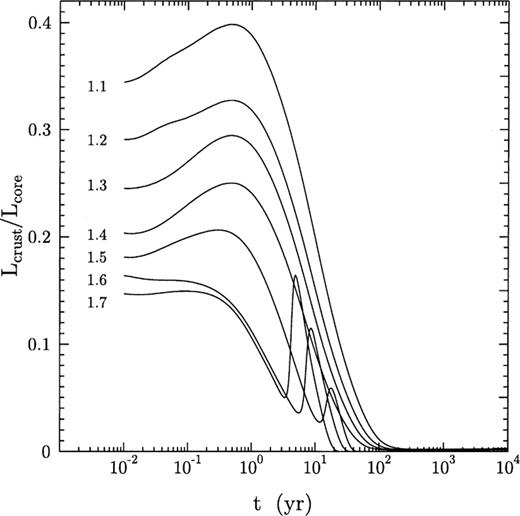
Prior to thermal relaxation, the contributions of the neutron star crust to the integrated heat capacity and neutrino luminosity are significant (Figs 8 and 9). In the slow-cooling models, the heat capacity in the crust ranges from 10 to 20 per cent of that in the core, with the larger fraction in the low-mass models (where crusts occupy a larger fraction of the volume). In the fast-cooling models, the ratio of the crust to core heat capacities reaches a maximum of 55 per cent at  before dropping to under 10 per cent after the relaxation. Similarly, the integrated neutrino luminosity of the crust is about
  per cent of that of the core at
  , and then it drops to a tiny fraction at later times.

Ratio of the integrated heat capacities in the crust and the core for the neutron star models of masses 1.1, 1.2, …, 1.7 M⊙.
Ratio of the neutrino luminosities in the crust and the core for the neutron star models of masses 1.1, 1.2, …, 1.7 M⊙.
The importance of the individual neutrino mechanisms for the crust cooling varies at different epochs. First, for  in the fast-cooling scenario or for
  in the slow-cooling scenario, the
  pair emission controls the crust temperature. As the temperature drops below
  , this process quickly fades away. The next epoch is controlled by plasmon decay. It dominates for
  (fast cooling) or
  (slow cooling). The last epoch of thermal relaxation lasts for a period of
  (fast cooling) or
  (slow cooling), where either electron–nucleus or neutron–neutron bremsstrahlung is important. In fact, both neutrino processes give almost identical cooling curves in the absence of superfluidity. However, free neutrons in the crust are thought to be in a superfluid state which strongly suppresses nn bremsstrahlung. Therefore, electron–nucleus bremsstrahlung is likely to be the dominant neutrino mechanism in this last epoch.
4 Relaxation time
The duration of the thermal relaxation epoch is potentially interesting from the observational point of view. This problem has been studied in a number of papers, with the most detailed and thorough work by Lattimer et al. (1994, and references therein). Those authors considered thermal relaxation for the fast cooling and defined the relaxation time tw as the moment of the most negative slope of the cooling curve,  , of a young neutron star. This is a typical time for the cooling wave to reach the surface. We will focus mainly on the case of rapid cooling, where the relaxation effects are more pronounced.
Here, t1 is the normalized relaxation time which depends solely on the microscopic properties of matter, such as the thermal conductivity and heat capacity. In superfluid neutron stars, t1 is sensitive to the magnitude and density dependence of the critical temperature of neutron superfluidity in the crust, as we discuss later. It is important that t1 appears to be almost independent of the neutron star model, its mass M and radius R. We have verified that this scaling holds also for the slow-cooling non-superfluid models.
For the non-superfluid stars with the core–crust interface placed at  , which is close to our value
  , Lattimer et al. (1994) obtained
  . Our rapidly cooling models show similar scaling,
  , whereas in the slowly cooling models
  .
.
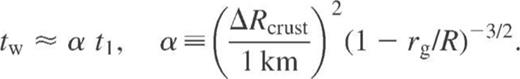
The proper width of a thin crust  , taking into account the effects of general relativity, is
  . This gives
  in equation (3). An additional factor of
  accounts for the gravitational dilation of time intervals.
The parameter t1 can be roughly estimated using equation (4) with the values of the specific heat capacity and thermal conductivity in the crust near the crust–core interface, for instance, at  . Fig. 7 shows that the relevant temperature at the interface is
  . At those temperature and density values, according to our physics input,
  and
and  . This gives
  , which is in qualitative agreement with the model value.
Fig. 10 shows the sensitivity of the relaxation time to test variations of physical properties of the neutron star crust in the fast cooling scenario of the 1.5-M⊙ star. The corresponding values of tw and t1 are listed in Table 2. They may differ from the mean values (Table 3) within the error-bars. We present also the results for the superfluid models discussed in the next section. The solid (‘real’) curve is taken from Fig. 5. It is calculated using the best available physics input for a non-superfluid neutron star model.
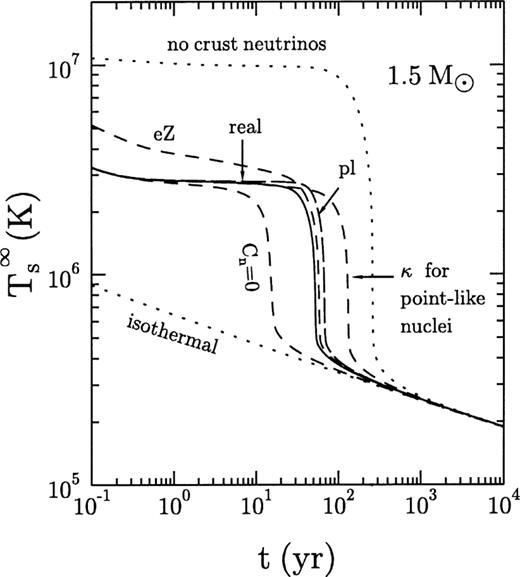
Thermal relaxation for the 1.5-M⊙ model without superfluid effects (see also Table 2). Solid line: cooling curve for the best values of the thermal conductivity, heat capacity, and neutrino emissivity. Dotted lines: switched-off neutrino emission from the crust (upper) or infinite thermal conductivity at  (lower). The dashed curve
  removed neutron heat capacity in the crust. The dashed curve κ: the thermal conductivity in the crust for point-like nuclei. Two other dashed lines: removed all neutrino mechanisms in the crust except either plasmon decay (pl) or electron–nucleus bremsstrahlung (eZ).
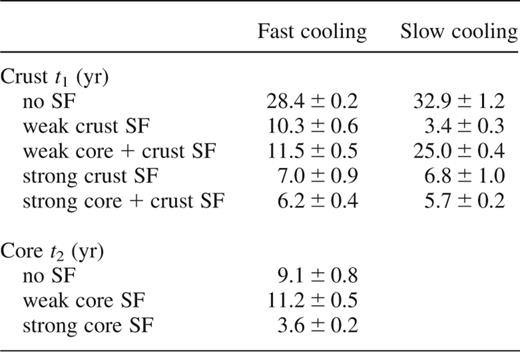
Relaxation time tw and normalized time t1 for neutron stars with different crust models.
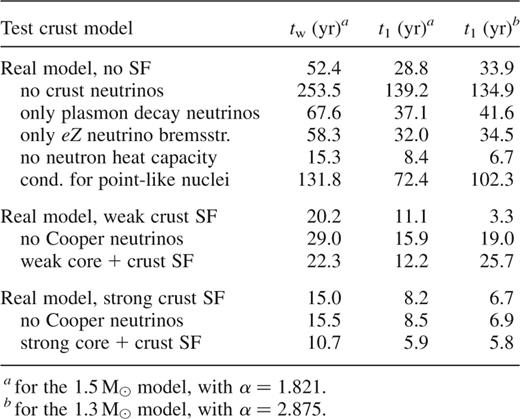
Normalized relaxation times in the crust t1, equation (3), and in the core t2,, equation (5).
Switching off the neutrino emission from the crust, while keeping the heat capacity, slows down the thermalization epoch by almost an order of magnitude, from 50 to 250 yr. Turning on the plasmon decay alone would lead to the cooling curve not very different from the real one, although the thermalization epoch would be delayed by about 30 per cent  . Turning off the plasmon decay and switching on the electron–nucleus bremsstrahlung instead would give a hotter neutron star before the relaxation but almost correct relaxation time,
  . Combined together, plasmon decay and electron–nucleus bremsstrahlung would accurately reproduce the real cooling curve.
Restoring the neutrino emissivity in the crust but switching off the heat capacity of crustal neutrons  we obtain much faster relaxation, which lasts about 15 yr. This numerical experiment imitates the suppression of the neutron heat capacity by strong neutron superfluidity (discussed in Section 5). On the other hand, had we neglected the quantum suppression of the heat capacity of the nuclei below the Debye temperature, the latter heat capacity would have become important in older neutron stars,
  , strongly delaying the cooling.
Finally, the relaxation time depends on the thermal conductivity in the inner crust. For instance, a neglect of the finite sizes of atomic nuclei in the electron–nucleus scattering rate would lower the electron thermal conductivity at the crust base  by a factor of
  (cf. Fig. 4). Using that less realistic thermal conductivity we would have had much longer relaxation (about 130 yr). If the thermal conductivity were infinite in the stellar interior (at
  , we would have obtained an isothermal cooling scenario. In this case a sharp drop of the surface temperature associated with the relaxation disappears.
We have run additional cooling models with  , varying the heat capacity and thermal conductivity within the crust (at
  by a fixed factor of 1/8, 1/4, 1/2, 2, 4 or 8. The results confirm that tw and t1 are indeed quite sensitive to the variations of Cv and κ, in agreement with the qualitative estimate, equation (4), and the results of Lattimer et al. (1994). It is important that these variations do not invalidate the scaling relation for the relaxation time; see equation (3). Moreover, if Cv is increased and κ is decreased, the dependence of t1 on the values of the heat capacity and thermal conductivity is described by a simple scaling relation
  .
.
We have also done sensitivity tests of the relaxation time, analogous to those performed by Epstein et al. (1983). In each density region, 0.2 dex of log ρ, either the heat capacity, thermal conductivity, or neutrino emissivity have been changed by a factor 1/8, 1/4, 1/2, 2, 4 or 8. Fig. 11 shows the variations of tw when Q and κ are reduced by a factor of 8, and Cv is enhanced by a factor of 8. The relaxation time depends mostly on the values of Cv and κ in the crust in the density range  near the crust–core interface, being rather insensitive to the variations of Q. Variations of the physical parameters in the core affect the crustal relaxation much less strongly (at least for non-superfluid models). The density range where tw is most affected by the variations of κ is narrower than the density range where it is affected by the variations of Cv. The most important temperature range which influences tw is
  . The properties of matter in these ‘sensitivity strips’ of ρ and T are very model-dependent. For instance, the nuclei may be strongly non-spherical (rods, plates, etc.) at
  , which is not included in our calculations. Note that the thermal conductivity has not been calculated so far for the phase of non-spherical nuclei.
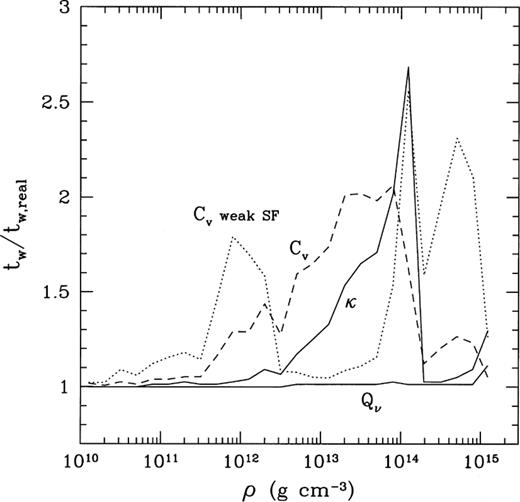
Sensitivity of the crust relaxation time to the variations of the heat capacity, thermal conductivity, and neutrino emissivity in various density regions of the 1.5-M⊙ neutron star model with the non-superfluid core. In each 0.2 dex of log ρ, Q and κ are reduced by a factor of 8 (solid lines, no superfluidity), and Cv is enhanced by a factor of 8 without superfluid effects (dashes) and with weak superfluidity (dots).
However, if Cv were noticeably lower, or κ were noticeably higher than in our basic non-superfluid models, the decrease of the crust relaxation time would saturate at  . This is the time it takes the inner core with the direct Urca emission to equilibrate thermally with the outer core (cf. Fig. 7). More generally, this is a core relaxation time tcore, which is almost independent of the parameters of the crust. It can be estimated using the same formalism of heat diffusion as in equation (4) through a slab of material between the direct-Urca-allowed kernel and the boundary of the core, with
  . The relativistic factors appear as
  , where Φcc is the metric function at the core–crust interface.
 . The least-squares fit gives
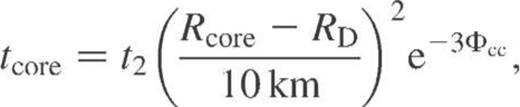
 . Thus, the fast-cooling models may have two distinct relaxation times, in the core and in the crust, and the latter is typically longer, at least for non-superfluid models.
The normalized crustal relaxation time t1 shows very small variations with the neutron star mass, ±0.2 yr for fast cooling and ±1.2 yr for slow cooling (see Table 3). Even combining the models with all masses we find that the scaling relation, equation (3), holds remarkably well, and  . Therefore, the cooling of the crust prior to thermal relaxation is indeed insensitive to the thermal evolution of the core. The slow cooling makes the relaxation much less pronounced but it does not change its basic features. This property is a result of the very high thermal conductivity in the core (Fig. 4), which makes the core-relaxation time typically much shorter than the crust one. Accordingly, the cooling curves do not depend on the exact value of the conductivity in the core as long as it is much higher than in the crust.
Among earlier works on thermal relaxation in young neutron stars we would like to also mention the papers by Nomoto & Tsuruta (1981, 1987). These authors used a different definition of tw, defining it as the time when the real cooling curve differs by 0.5 per cent from the isothermal one. Naturally, this definition yields a longer tw than the ‘physical’ relaxation time, during which departures from isothermality can be important. Thus, contrary to Nomoto and Tsuruta's conclusion, most neutron stars from the  old supernova remnants can be described quite accurately by isothermal models.
Nomoto & Tsuruta (1987) correctly noticed the dependence of the relaxation time on the equation of state for the fixed stellar mass of 1.4 M⊙: tw is longer for the stiffer equation of state (with a thicker crust). This dependence was quantified later as equation (3) by Lattimer et al. (1994). Unfortunately, we cannot make a quantitative comparison with those earlier results because the physics input has changed significantly from the 1980s. Nomoto and Tsuruta also observed that superfludity in the core and the crust plays an important role in regulating thermal relaxation. We consider the superfluid effects next.
5 Effects of superfluidity
Free neutrons in the crust and both neutrons and protons in the core of a neutron star are likely to be in the superfluid state. We implement the effects of superfluidity as discussed in Section 2.2. It turns out that superfluidity in the crust affects the cooling curves at the thermal relaxation stage, while superfluidity in the core affects cooling at later stages. First, consider the effects of neutron superfluidity in the crust. If the temperature T falls much below the critical temperature Tcn, the superfluidity strongly reduces the neutron heat capacity and nn neutrino bremsstrahlung. While the latter is compensated by electron–nucleus bremsstrahlung, the former effect leads to a faster thermal relaxation. In addition, a new neutrino process is allowed in the superfluid state: the neutrino emission as a result of Cooper pairing of free neutrons. It further accelerates cooling and thermal relaxation of the crust.
Fig. 12 illustrates how the weak neutron superfluidity in the crust carves out the temperature profiles in the standard cooling scenario,  . For the first 10−4 yr, when the temperature is above Tcn, the thermal structure is identical to that of the non-superfluid model. Later, the region where the critical temperatures are the highest cools much faster than the neighboring layers. The acceleration of cooling is mainly as a result of the reduction of the heat capacity and the switching on of the Cooper-pairing neutrino emission. A sequence of points in Fig. 12, in which solid lines start to deviate from the dotted ones, can reproduces the density profile of Tcn shown in Fig. 1. As the temperature falls further, wider density regions become affected, producing shells of cool matter surrounded on both sides by hotter layers. After the cooling wave from the core reaches the outer crust, the star settles into almost the same isothermal state as the non-superfluid model, but at a greater rate.
Temperature profiles in the interior of the 1.3 M⊙ model with (solid lines) and without (dots) weak crust superfluidity of free neutrons. The core is not superfluid. Numbers next to curves show the stellar age. The contours are at 0, 10−4, 10−2, 1, 100 and 1000 yr.
The effects are much stronger if the superfluidity is allowed for inside the stellar core. Fig. 13 shows the combined effect of the strong superfluidity in the core and crust. Both neutrons and protons are superfluid in the core of this 1.5-M⊙ neutron star. In addition to the trough in the crust layers, the core develops a complex structure. All the sources of neutrino emission and the nucleon heat capacity in the core are affected by the superfluidity, while the electron heat capacity is not and becomes dominant in highly superfluid cores. As soon as the temperature drops significantly below the critical temperatures Tcn or Tcp, Cooper-pairing neutrino emission comes into play. It starts in the inner part of the core and drives the temperature down. At  that region is even cooler than in the non-superfluid model, while the other parts of the core are slightly hotter. By the age of 1 yr, this cool region includes all of the core except the inner kernel. As a result, thermal relaxation proceeds on a shorter time-scale, and at
  the stellar interior is isothermal. Thus, for the large assumed values of Tcn and Tcp the neutrino emission caused by Cooper pairing becomes so strong that, instead of slowing down, the presence of the core superfluidity accelerates the cooling.
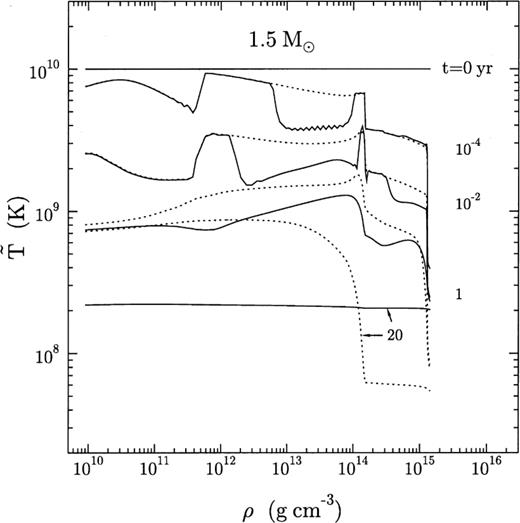
Temperature profiles (solid lines) in the interior of the 1.5-M⊙ model with strong superfluidity both in the crust and the core. The numbers next to the curves show the stellar age. The contours are at 0, 10−4, 10−2, 1 and 20 yr. The dotted lines show the temperature profiles of the non-superfluid star.
Fig. 14 demonstrates the aforementioned effects on the thermal relaxation time in the 1.5 M⊙ neutron star. The stellar core is assumed to be non-superfluid. The thermal relaxation stage occurs about 2.6 times faster in the case of weak crust superfluidity and about 3.5 times faster in the case of strong crust superfluidity, compared to the non-superfluid crust. And also, while the inclusion of the neutrino emission caused by Cooper pairing leads to faster cooling for  , most of the accelerating effect is a result of the reduction of the crust heat capacity. Therefore, the relaxation time is greatly reduced by the effect of superfluidity on the heat capacity of free neutrons in the stellar crust.

Superfluid effects in the crust of the 1.5-M⊙ neutron star model with the non-superfluid core. The dashed line is for the case of weak neutron superfluidity, while the dash-and-dot line is for the case of strong superfluidity. The dotted line is obtained neglecting the Cooper-pair neutrino emission for the weak-superfluid model. The solid line is the cooling curve for the non-superfluid crust.
Still, the relaxation time of the superfluid crust satisfies the same scaling relation, equation (3), as for the non-superfluid crust. Table 3 summarizes the results, taken as the mean of  , and 1.7-M⊙ models for fast cooling, and
  , and 1.4-M⊙ models for slow cooling. In case of the fast-cooling models, crust superfluidity reduces the relaxation time by up to a factor of four;
  for the strong superfluidity. In case of the slow-cooling models with strong crust superfluidity the effect is similar, but with the weak superfluidity it is much different, by almost a factor of 10. The inclusion of superfluidity in the core does not affect the relaxation time significantly. The values of t1 change by about ≈1 yr and are within the error-bars of the results for the non-superfluid cores. Again the notable exception is the weak superfluidity in the slow-cooling models.
Superfluidity in the core changes the core relaxation time, although it still scales as in equation (5). Weak core superfluidity only increases the core heat capacity and delays the relaxation by a few years,  , while the strong superfluidity suppresses the heat capacity and gives much faster relaxation, by a factor of 2.5.
The large difference of the values of t1 for the slowly and rapidly cooling stars with weakly superfluid crusts indicates that, generally, superfluidity may violate the simple scaling relations for the relaxation time as well as the strict thermal decoupling of the crust and the core prior to the relaxation. This happens because superfluidity makes the heat capacity (and other properties of matter) a strong function of density.
The shortening of the thermal relaxation phase in a rapidly cooling star, as a result of the superfluid reduction of the crustal heat capacity, was emphasized by Lattimer et al. (1994). Using a model of superfluidity, which is closer to our model of strong superfluidity in the crust, Lattimer et al. found that the relaxation time becomes three times as short,  , in qualitative agreement with our results. Our calculations indicate that the effect is sensitive to the model of neutron superfluidity in the crust and thus it can be used to test such models.
When thermal relaxation is over, the cooling is mainly regulated by the neutrino luminosity and heat capacity of the core. The processes in the crust cease to play a significant role except for the very low-mass neutron stars with large crusts. We find, however, that for some superfluid models the neutrino luminosity of the crust may affect the cooling for a short period of time during the transition from the neutrino cooling era to the photon era. For instance, cooling of superfluid neutron stars after the thermal relaxation is discussed in detail by Yakovlev et al. (1999).
6 Conclusions
We have studied thermal evolution of young neutron stars using a new cooling code and updated physics input. The effective surface temperature of isolated neutron stars in the first 100 yr is determined by the properties of the crust. After the cooling wave from the core reaches the surface, the effective temperature drops from 250 eV to 50 eV or lower. We confirm the conclusion of Lattimer et al. (1994) that the duration of the relaxation epoch in a fast cooling scenario depends sensitively on the heat capacity and thermal conductivity of the crust. The relaxation time scales with the size of the crust, equation (3), and the normalization is  without superfluid effects or
  with strong superfluid effects. We find that the same conclusion holds in the case of slow cooling, in which thermal relaxation is less pronounced.
We also investigate the effects of various neutrino emission mechanisms in the crust, superfluidity of free neutrons, heat capacity, and thermal conductivity on the relaxation time (as summarized in Table 2 and Fig. 11). The relaxation time is most sensitive to the variations of κ and Cv in the density range  near the crust–core interface.
Young cooling neutron stars can serve as astrophysical laboratories of matter at subnuclear densities. The sensitive dependence of the relaxation time on the microscopic properties of matter in the deep inner crust provides a possibility to study these properties by observing the emergence of the cooling wave. In order to realize this method, one needs to detect thermal emission from a very young neutron star in the range from 50 to 250 eV. Such stars have not been found so far, but may be detected in young supernova remnants by Chandra and XMM.
To improve the cooling theory of young neutron stars, it would be desirable to continue theoretical studies of microscopic properties of matter in the inner crust, in particular, the possible unusual phases of nonspherical nuclei at  , as well as the thermal conductivity, heat capacity and neutrino emission of such matter. The evolution of a possible magnetic field in the crust needs to be addressed, as a strong field may alter the electron conductivity and other transport phenomena. It is also important to refine our knowledge of matter containing spherical nuclei at
  . In this paper (see the Appendix) we present and use the results of new calculations of the electron thermal conductivity determined by the scattering of electrons off spherical atomic nuclei, taking into account the effects of finite sizes and smoothed shapes of proton nucleus cores.
Acknowledgments
We are grateful to P. Haensel and A. D. Kaminker for stimulating discussions and useful suggestions, to D. Page for his suggestion to optimize the performance of the cooling code, and to the referee, U. Geppert for helpful suggestions. This work was supported in part by RFBR (grant No. 99-02-18099), INTAS (grant No. 96-0542), NSF (grant No. PHY99-07949), and PPARC.
References
Appendix
Appendix A: Electron conductivity of the inner crust
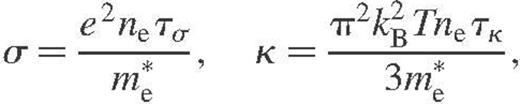
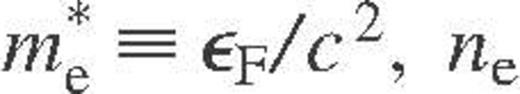 , ne is the electron number density, kB is the Boltzmann constant and τ and τ are the effective relaxation times. In the presence of several electron scattering mechanisms, the cumulative relaxation time is determined by the Matthiessen rule (e.g. Ziman 1960). In the envelopes of neutron stars, one traditionally considers the electron–ion (ei), electron–electron, and electron–impurity scatterings. We focus on the main mechanism, the ei scattering, which is electron scattering off strongly correlated ions – atomic nuclei – (if they form a Coulomb liquid) as well as scattering off ions which oscillate around their equilibrium positions (in a Coulomb solid). In the latter case, the adequate quantum-mechanical description is provided by the electron–phonon scattering formalism – cf. Baiko et al. (1998).
A modern theoretical treatment of the conductivities due to the ei scattering in strongly coupled Coulomb plasmas of ions has been proposed by Baiko et al. (1998) and applied to the outer envelopes of neutron stars by Potekhin et al. (1999). In the latter work, practical formulae for σ and κ incorporating all three scattering mechanisms have been derived; the corresponding fortran code is available electronically at http://www.ioffe.rssi.ru/astro/conduct/.
For the inner crust these expressions must be modified. First, the atomic nuclei cannot be considered as point-like. Secondly, the ei scattering in the inner crust at temperatures much below 108 K changes its character: so-called umklapp processes cease to dominate and the normal processes (with electron-momentum transfer within one Brillouin zone) become more important.
A1 Effects of the finite size of ions
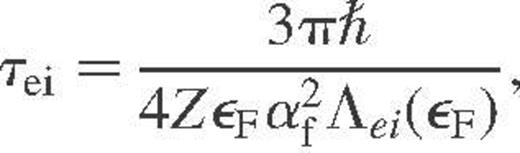
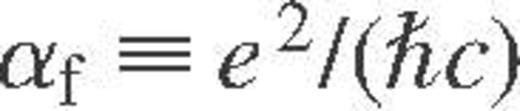 is the fine-structure constant, and Λei is the Coulomb logarithm. For a classical plasma of ions in the Born approximation (e.g. Potekhin et al. 1999),
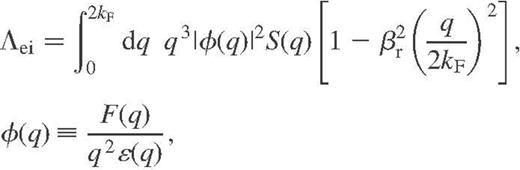
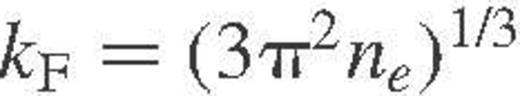 is the electron Fermi wave number,
  ,
,  is the Fermi velocity, ɛ(q) is the static dielectric function, S(q) is the static structure factor of the ions (more precisely, its inelastic part – see Baiko et al. 1998) and F(q) is the form factor of the ions. The latter three functions allow for the electron polarization, ion–ion correlations, and the finite size of the ions, respectively.
The quantization of ionic motion becomes important at  , where
  is the ion plasma temperature,
  is the ion number density,
  is the ion mass, and mu is the atomic mass unit. In this case, in equation (A3) one should use an effective structure factor, different for σ and κ. These effective factors have been derived by Baiko et al. (1998) and fitted by Potekhin et al. (1999) for the case where the umklapp processes dominate.
Uniform charge distribution in atomic nuclei
 , a good approximation for the charge density within a nucleus is a step function. The corresponding form factor is
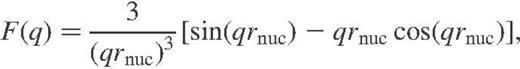
In general, Λei depends on ρ, T, Z, A and rnuc, and it appears to be almost independent of the type of Coulomb lattice. It is convenient, however, to introduce dimensionless parameters: the electron relativity parameter  the ion size parameter
  , where
  is the ion-sphere radius; the Coulomb coupling parameter of ions
  the inverse ion quantum parameter
  and the electron screening parameter
  , where kTF is the electron screening wave number. In accordance with the previous results, it is also convenient to introduce an auxiliary parameter
  , where
  is the Debye screening length for the ideal plasma of ions. Finally, the basic parameters that characterize the Coulomb lattice are the normalized first- and second-negative moments of the phonon frequency,
  and
and  .
.
 for approximately 100 pairs (ρ, T), varying over orders of magnitude in the domain of strongly degenerate electrons and strongly coupled ions, for eight ion species from
  to
to  , and for five values of xnuc (from 0 to 0.4). We have included the non-Born corrections in the same manner as Yakovlev (1987). The results can be fitted using the effective screening function
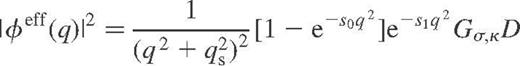
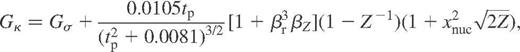
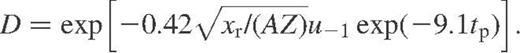
 in equation (A3). Here, the first term corresponds to the Debye screening with the effective screening wave number qs, the factor in square brackets corrects for the ion correlations, and the functions G and D describe ionic quantum effects, as in Potekhin et al. (1999). An additional factor
  plays a role of the effective form factor. The numerical values of Λ obtained from the accurate theory are reproduced (within several per cent in the most important
  range) if we use the effective screening function (A5) with the following parameters:


If  , these equations reduce to those presented in Potekhin et al. (1999).


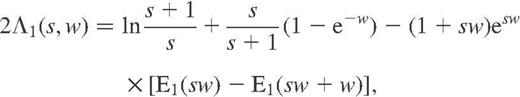
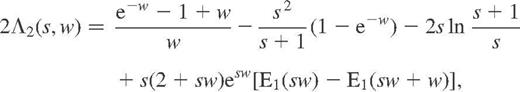
 is the standard exponential integral. Note that using equations (A14) and (A15) directly may result in large numerical round-off errors in the limiting cases
  ,
,  , or
, or  . In these cases, explicit asymptotic expressions of Potekhin et al. (1999) should be used.
Realistic charge distribution
 (at
(at  , where the power index b controls the ‘sharpness’ of the charge profile. The parameters b and rm have been described by the simple functions of mass density in the smooth composition model of crust matter (Kaminker et al. 1999). Using that model we have calculated the electrical and thermal conductivities for
  and
and  , and compared the results with the fitting formulae (A12–A15). We have found that the electrical conductivity is reproduced (within ≈
 per cent), if we define xnuc in equation (A8) so as to reproduce the same mean-square proton-core radius as in the approximation of uniform charge distribution:
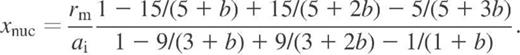
In equation (A10), which determines the thermal conductivity at  , one should additionally multiply xnuc by a factor of
  . The maximum-fit error of κ does not exceed 13 per cent.
A2 Normal processes at very low temperatures
 . The effect of gaps is most significant if the deviation of the electron momentum from the intersection line between the Fermi surface and the Brillouin zone boundary does not exceed
  . However, with decreasing temperature the strips of the Fermi surface, between which the umklapps proceed effectively, become narrower and closer to these intersection lines. When the widths of the strips [∼
 become smaller than Δk, the umklapp processes are frozen out and the normal processes prevail. The above estimates indicate that this happens when the temperature falls below
 have been obtained by Raikh & Yakovlev (1982). In our notation, they yield
 is the value of the Riemann zeta function.
 given by equation (A12) and the low-temperature asymptote
  given by equation (A18):
Fig. A1 shows the thermal conductivities for three values of the temperature. In the neutron star envelope, the plasma is in the solid phase except for the segment to the left of the asterisk at the highest  . At the lowest
  , the change in the scattering from umklapp to normal processes leads to a significant increase in the conductivity shown by the hatched region. However, this increase can be compensated by the scattering off impurities. For example, the dashed line shows the conductivity for
  , where nimp and Zimp are the impurity number density and charge number, respectively. For comparison, dashed lines show the thermal conductivity in the smooth-composition model with smooth proton charge profile.
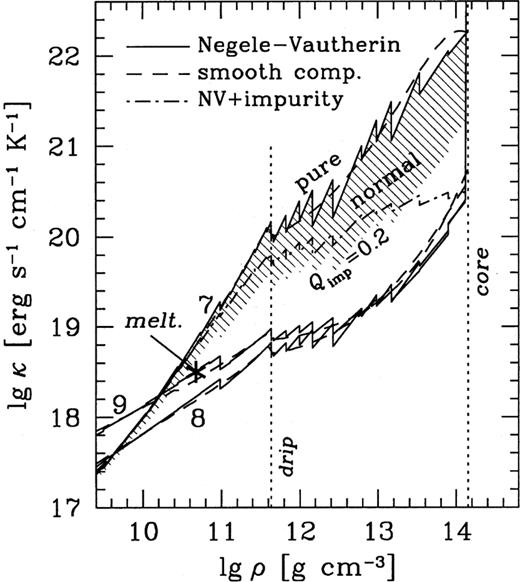
Density dependence of the electron thermal conductivity at  , 108 and 109 K in the neutron star crust. Solid and dot-dashed lines: ground state composition (Negele & Vautherin 1973), rectangular profile of nuclear charge (solid lines: pure crystal or liquid; dot-dashed line: including impurities; bottom of the hatched region: neglecting freezing of umklapp processes at
  dashed lines: smooth-composition model, realistic profile of nuclear charge, no impurities.
