


ABSTRACT
Over the last two decades, the conflicts in Iraq and Afghanistan have cost the United States significantly in terms of lives lost, disabling injuries, and budgetary expenditures. This manuscript calculates the differences in costs between veterans with combat injuries vs veterans without combat injuries. This work could be used to project future costs in subsequent studies.
In this retrospective cohort study, we randomly selected 7,984 combat-injured veterans between February 1, 2002, and June 14, 2016, from Veterans Affairs Health System administrative data. We matched injured veterans 1:1 to noninjured veterans on year of birth (± 1 year), sex, and first service branch. We observed patients for a maximum of 10 years. This research protocol was reviewed and approved by the David Grant USAF Medical Center institutional review board (IRB), the University of Utah IRB, and the Research Review Committee of the VA Salt Lake City Health Care System in accordance with all applicable Federal regulations.
Patients were primarily male (98.1% in both groups) and White (76.4% for injured patients, 72.3% for noninjured patients), with a mean (SD) age of 26.8 (6.6) years for the injured group and 27.7 (7.0) years for noninjured subjects. Average total costs for combat-injured service members were higher for each year studied. The difference was highest in the first year ($16,050 compared to $4,135 for noninjured). These differences remained significant after adjustment. Although this difference was greatest in the first year (marginal effect $12,386, 95% confidence interval $9,736-$15,036; P < 0.001), total costs continued to be elevated in years 2-10, with marginal effects ranging from $1,766 to $2,597 (P < 0.001 for all years). More severe injuries tended to increase costs in all categories.
Combat injured patients have significantly higher long-term health care costs compared to their noninjured counterparts. If this random sample is extrapolated to the 53,251 total of combat wounded service members, it implies a total excess cost of $1.6 billion to date after adjustment for covariates and a median follow-up time of 10 years. These costs are likely to increase as injured veterans age and develop additional chronic conditions.
INTRODUCTION
Since the global war on terror began in 2001, 7,056 US service members have died and 53,251 have been wounded in action.1 In addition to these human costs, there are significant budgetary implications to these conflicts. One recent estimate put the overall cost of the wars in Iraq and Afghanistan at $6.4 trillion, $1 trillion of which included future costs for disability and health care for veterans.2 These future cost impacts on the health care system are likely to be because of more than the direct sequelae of trauma. Emerging evidence indicates that an acute traumatic episode can increase the risk of a variety of conditions, such as hypertension (HTN), cardiovascular disease, diabetes (DM), and mental health diagnoses.3–7
Although some studies have documented the health care costs associated with civilian gunshot wounds,8 traumatic brain injury (TBI),9,10 and burns,11 few have focused on the specific costs related to health care for combat-injured veterans. One study by Dalton and colleagues compared combat-injured service members with service members injured as a result of noncombat trauma.12 The authors reported that median overall costs over 3.3 years of follow-up were $142,214 and $50,741 in the combat injured and noncombat injured groups, respectively. After adjustment for injury severity, Elixhauser score, age, race, rank, sex, amputation, ostomy, tracheostomy, and feeding tube, combat injury was associated with a 30% increase in costs. Of note, this work was limited to data from the Military Health System. However, since many of the long-term conditions associated with trauma can take years to manifest, the majority of future costs will likely be borne by the Veterans Affairs (VA) Healthcare System. To our knowledge, there have been no published studies documenting the health care utilization costs of combat-injured service members in the VA Healthcare system.
We sought to quantify the long-term health care costs among service members physically injured in combat in the VA Healthcare System compared to a matched cohort of patients who deployed to Iraq or Afghanistan but were not injured.
METHODS
This research protocol was reviewed and approved by the David Grant USAF Medical Center institutional review board (IRB), the University of Utah IRB, and the Research Review Committee of the VA Salt Lake City Health Care System in accordance with all applicable Federal regulations.
The injured cohort was derived from a random sample of 10,000 patients from the Department of Defense Trauma Registry (DoDTR) who were injured in combat in Iraq or Afghanistan between February 1, 2002, and June 14, 2016. We then obtained a control group of 1,048,976 subjects who deployed to Iraq or Afghanistan, but were not injured, from the VA/ Department of Defense (DoD) Identity Repository (VADIR). These control subjects were then matched 1:1 to injured subjects on the basis of year of birth (± 1 year), sex, and first service branch. The index date was the end date of a given veteran’s last deployment.
Data on injury characteristics were obtained from DoDTR. Injury severity was quantified using the Injury Severity Score (ISS), an anatomically based scoring system for trauma severity, which ranges from 1 to 75.13 ISS was categorized as mild (1-9), moderate (10-15), severe (16-24), and critical (25-75). We obtained race and ethnicity data from several sources, including the Defense Manpower Data Center (DMDC), the Military Health System Data Repository (MDR), and VADIR. Race/ethnicity was preferentially taken from DMDC. If missing from DMDC, they were obtained from MDR. If missing in both DMDC and MDR, data on race/ethnicity were derived from VADIR. Marital status was obtained from MDR. Rank was categorized as junior enlisted, senior enlisted, and officers. Data on education and discharge status were derived from VADIR, and VA enrollment priority was obtained from the VA Corporate Data Warehouse. Finally, health care cost outcomes included inpatient, outpatient, pharmacy, and total and were obtained from the VA Managerial Cost Accounting data. Cost values were converted to 2017 US dollars using the Personal Consumption Expenditures Health price index.14 These costs represent the expenditures paid by the VA to provide care to the veteran. We used the Strengthening the Reporting of Observational Studies in Epidemiology guidelines in the reporting of this manuscript.
We constructed a longitudinal dataset with one observation per veteran per year for up to 10 years and assessed the impact of a combat injury on health care cost during each of these 1-year periods. Year one started at the end date of a given service members last deployment. Data were described using means and standard deviations for VA costs categorized as: (1) inpatient VA costs, (2) outpatient VA costs, (3) pharmacy VA costs, and (4) total VA costs. We used multivariable regression models chosen to match the particular characteristics of the outcome variable in each model. These models adjusted for age, sex, race/ethnicity, marital status, year, discharge status, service branch, education, post-traumatic stress disorder (PTSD), and VA enrollment priority. Because most veterans in our cohort had outpatient VA costs in the first year of the study, we used a multivariable generalized linear model (GLM) with a gamma distribution and a log link function in this case as well as for total VA costs. For years 2-10 for outpatient and total cost and for years 1-10 for inpatient and pharmacy VA costs, we used a multivariable two-part model that is appropriate for semicontinuous data. Part 1 of these two-part models was a logistic regression in which the dependent variable was a dichotomous indicator for whether the veteran had any cost in that year or not. Part 2 was a GLM with a gamma distribution and a log link function conditional on the veteran having positive VA costs in that year. In all cases, we report estimated effects of combat injury on VA costs as marginal effects (MEs), which can be interpreted as the adjusted absolute difference in costs between veterans with and without combat injuries. If subjects died before the end of the study period, they were included in the analysis until their year of death after which they were excluded. Since the data were not normally distributed and not all subjects had a cost in each category in a given year, we performed a sensitivity analysis using nonparametric methods. In this analysis, we examined unadjusted VA costs for each category conditional on a veteran receiving a cost in a given category in a given year and compared differences by means of Kruskal–Wallis tests.
RESULTS
Of the 10,000 subjects randomly selected from DoDTR, 9,654 could be matched to DoD administrative records. Of these, 1,601 did not have documented care in the VA health system. This left 8,053 injured subjects to be matched to uninjured subjects. Of these 8,053 pairs of subjects, 69 pairs were excluded because the uninjured subject died before the index date. The final number of subjects included for analysis was 15,968 (Fig. S1). Among patients in the injured group, 60.6%, 18.0%, 11.4%, and 10.0% were in the mild, moderate, severe, and critical categories of injury, respectively. The characteristics of the study cohort are shown in Table S1. Patients in the injured cohort were younger (26.8 ± 6.6 vs 27.7 ± 7.0 years), more likely to be non-Hispanic White (76.4% vs 72.3%), more likely to be senior enlisted (33.9% vs 26.2%), more likely to be married (47.9% vs 44.9%), less likely to be dishonorably discharged (1.0 vs 1.4%), and less likely to be a college graduate (10.2% vs 12.2%). Differences in VA enrollment priorities were also observed. A full explanation of VA enrollment priorities is available online15 and shown in Table S2. The biggest difference between the groups was seen for enrollment priority 1, with 68.5% and 27.3% of subjects in the injured and noninjured group, respectively. To be classified as enrollment priority 1, a veteran must (1) have >50% service-connected disability, (2) have a service-connected disability that does not allow them to work, or (3) be a recipient of the Medal of Honor. During the follow-up period, significantly more patients died in the injured group compared to the noninjured group (2.5% and 1.3%, respectively). Median (interquartile range [IQR]) follow-up times were 10 years (7-10) and 9 years (7-10) in the combat injured and noninjured group, respectively.
Mean inpatient, outpatient, pharmacy, and total VA costs stratified by injury status and injury severity are shown in Figures 1 and 2, respectively. Table S3 displays costs, with means and standard deviations for these groups, for the first 10 years after the index date. Inpatient VA costs were higher in each year examined. The difference in inpatient VA costs was primarily driven by the most severely injured patients, which was most pronounced in the first year after injury (Fig. 2A). Outpatient VA costs in the first year were $6,635 ± $10,284 in the injured group and $3,261 ± $4,997 in the noninjured group. These costs slowly decreased through time. As shown in Figure 2B, there was evidence for a positive relationship between severity and health care costs, with greater disease severity associated with higher costs. Differences in pharmacy VA costs between the injured and noninjured groups were most pronounced at year 1 and year 10, but were higher in the injured group for each year studied (Fig. 1C). When examining pharmacy VA costs stratified by injury severity, the highest average costs were in the most injured patients (Fig. 2C). Differences in total VA costs between the groups were most pronounced in the first year. However, injured patients continued to have higher VA costs throughout the study period. More severe injury was associated with higher VA costs (Fig. 2D).
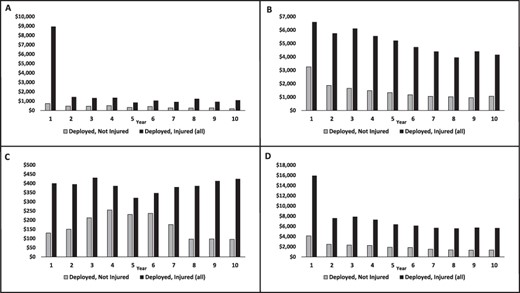
Mean costs stratified by combat injury. Inpatient costs (A), outpatient costs (B), pharmacy costs (C), and total costs (D). P < 0.001 for all comparisons between injured and not injured subjects for each year examined.
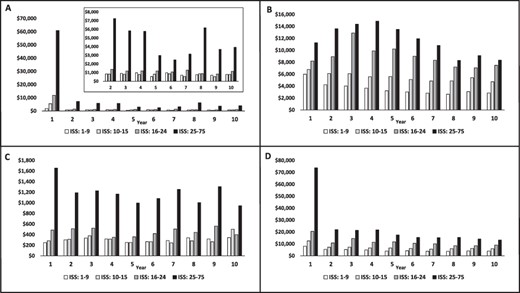
Mean costs stratified by injury severity in the combat injured cohort. Inpatient costs (A), outpatient costs (B), pharmacy costs (C), and total costs (D). The inset in (A) shows the results for year two forward on a rescaled Y axis.
Models adjusting for age, sex, race/ethnicity, marital status, year, discharge status, service branch, education, PTSD, and VA enrollment priority stratified by injury status and injury severity are shown in Figure 3, Figure 4, and Tables S4–7. After adjustment, injured patients had higher inpatient VA costs compared to noninjured patient only at year 1 (ME $8,422, 95% confidence interval [CI] $6,166-$10,677; P < 0.001) and year 10 (ME $892, 95% CI $54-$1,730; P = 0.037). When stratified by injury severity (Fig. 4A), inpatient VA costs were higher for severely injured patients for each year examined compared to noninjured patients. Outpatient VA costs were significantly higher for each year examined for both the injured group compared to the noninjured group and all injury severities (except for mildly injured subjects at year 8) compared to noninjured. When considering injury severity, there was a general trend for increased outpatient VA costs with increasing injury severity (Fig. 4B). After adjustment, pharmacy VA costs were only higher for injured patients in 3 years compared to noninjured patients (Fig. 3C). The most severely injured patients tended to have higher pharmacy VA costs (Fig. 4C). After adjustment, total VA costs for injured patients were highest at year 1 compared to noninjured patients (ME $12,386, 95% CI $9,736-$15,036; P < 0.001). However, injured patients consistently had higher VA costs compared to noninjured patients (Fig. 3D). In general, VA costs increased as a function of injury severity (Fig. 4D). In addition, odds ratios from part one of the two-part regression models and the relative differences in cost between injured and noninjured Veterans from the GLM regressions or part two of the two-part regression models are seen in Tables S8–10. These results show that combat injury is associated with an increase in the odds of having any health care costs as well as the amount of health care costs. Although our regression models yielded negative MEs (implying that injured service members incurred fewer health care costs than their noninjured counterparts) for some years, none of these estimated effects were statistically significant (defined as a 95% CI that does not include 0). It is important to note that, unlike the simple mean cost estimates reported in Table S3, the MEs represent differences in costs between the groups and were generated using multivariable regression analyses, which controlled for observable confounding variables. Rather than implying that injured service members incur less costs compared to those who were not injured, these results should be interpreted as saying that there was no significant difference health care cost between these groups after adjustment for confounders.

Results from multivariable regression models comparing combat injured to noninjured. Inpatient costs (A), outpatient costs (B), pharmacy costs (C), and total costs (D). Dots represent the point estimate of the ME, and error bars represent 95% CIs.
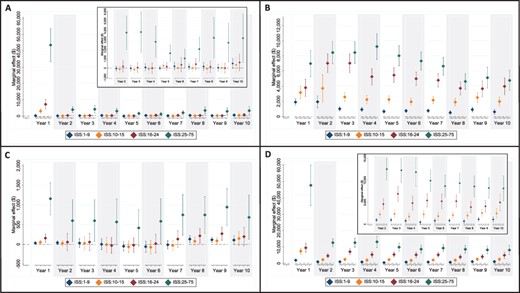
Results from multivariable regression models stratified by injury severity compared to noninjured. Inpatient costs (A), outpatient costs (B), pharmacy costs (C), and total costs (D). Insets in (A) and (D) show the results for year two forward on a rescaled Y axis. Dots represent the point estimate of the ME, and error bars represent 95% CIs.
The results for our sensitivity analysis, which utilized nonparametric methods and only considered subjects with a cost in a given category in a given year, are reported in Tables S11 and 12. Data are reported as medians and IQRs and compared utilizing Kruskal–Wallis tests. Median inpatient VA costs were only higher in year 1 for injured compared to noninjured subjects. Differences were also seen by injury severity during several years; however, the numbers of patients who received inpatient care were relatively low. Median outpatient VA costs were consistently higher for injured subjects throughout the 10-year period. Consistent differences were also seen by injury category for median outpatient VA costs. Median pharmacy VA costs were also higher for injured subjects in each year examined. Although differences in median pharmacy VA costs were observed by injury severity, this appeared to be predominantly driven by the most severely injured subjects. Median total VA costs were $4,716 (IQR $2,092-$9,899) in the injured group and $2,840 (IQR $1,229-$5,989) in the uninjured group at year 1 (P < 0.001). Median total VA costs remained significantly higher for injured subjects in each year studied. At year 10, median total VA costs were $3,540 (IQR $1,211-$9,346) and $2,377 (IQR $896-$5,916) in the injured and noninjured groups, respectively. Consistent differences were also seen by injury category for median total VA costs, with costs going up as a function of injury severity.
DISCUSSION
Our study estimates the attributable cost of combat injury as a way of quantifying the economic burden of combat injury to the VA health system and describes the differences in costs before and after adjustment for sociodemographic, military service factors, and PTSD. These adjusted differences ranged from $12,386 in the first year to $2,424 in the 10th year. Increased VA costs shortly after injury are expected given that these patients require care to recover from the acute impacts of their injuries. What is less intuative are the increased long-term VA costs, which our work demonstrates continue to at least 10 years after the initial insult. These continued costs may have a significant, and unexpected, impact on the VA health care system. Over the full 10-year time period of the study, the total adjusted excess cost of the injured cohort was $234 million. If this random sample is extrapolated to the 53,251 total population of combat wounded service members, it implies a total excess cost of $1.6 billion to the VA Healthcare System. Importantly, however, because some subjects were injured within the last 10 years, only 54% of injured service members in our cohort were followed for the full 10 years, implying that VA costs would be higher had more subjects been observed for the full period. These VA costs are separate from indirect costs, such as long-term disability, that were estimated to be $2 billion as of 2008.16 Furthermore, the mortality rate during the follow-up period was higher for injured subjects, implying that these early deaths may have decreased long-term VA costs compared to the noninjured group.
In addition to the work of Dalton and colleagues,12 some other studies suggest an increased cost burden in combat casualties. However, the majority of this work has focused on patients with amputations.16–18 One study of 265 casualties with amputations from the United Kingdom projected 40-year costs of $444 million.17 Although not directly applicable to combat casualties, there is also evidence from the civilian population to suggest that trauma increases costs. Average costs in the first year after TBI have been shown to be $3,395 after a mild TBI and $21,379 after a moderate or severe TBI.10 Mean 1-year costs following an episode of moderate to severe civilian trauma have been estimated to be $75,210.19 In a study of patients with burn injury that examined repeat hospital admissions, median costs were $AUS 11,959 in the burn group compared to $AUS 6,061 in the control group.11 The economic impact of gun violence has also been studied. One recent analysis demonstrated that health care costs in the first 6 months after a firearm injury are $17,806 and $92,151 for patients who are seen in the emergency department and admitted to the hospital, respectively.8 Although these studies demonstrate increased costs after various forms of injury, the strength of our current study lies in the long follow-up of the study subjects. The majority of patients in the injured group (54%) were followed for a full 10 years. In comparison, the follow-up times of prior work have ranged from 1 to 5.3 years, with many having only 1 year of follow-up.8,10,19
Although we have demonstrated that injured patients incur higher VA costs compared to noninjured patients, we do not have sufficient data to comment on the specific pathways by which this occurs. We hypothesize that costs are increased because of (1) rehabilitation, (2) mental health, and (3) chronic medical conditions. The first potential pathway for increased costs is the one that is associated with rehabilitative care. One study that examined VA costs for combat casualties with limb injuries found that patients with amputations had double the costs after 3-5 years.18 The majority of these costs were due to appointments for prosthetics. Consistent with our observations of increased VA costs in the most severely injured patients, rehabilitation costs were correlated with the severity of injury.18 The second potential pathway for increased costs is mental health diagnoses. Injured service members are more likely to have mental health conditions, such as depression, PTSD, and insomnia than their uninjured counterparts.7,20 For example, 45.1% of injured service members have depression compared to 28.3% of uninjured service members.7 In 2018, total costs for depression were estimated to be $326.2 billion annually.21 Notably, the majority of this expense (61%) was for indirect costs, resulting from absenteeism and decreased productivity. PTSD has been shown to have a prevalence of 64.0% in combat injured service members compared to 32.5% for controls.7 Attributable costs for PTSD are even higher than those for depression, with one study demonstrating 4.2%-9.3% more on an annual per patient basis.22 However, even after adjusting for a PTSD diagnosis in our multivariable regression models, we still found a large and statistically significant effect of combat injury on VA costs in many instances. Poor sleep has also been associated with combat injury, with insomnia diagnosed in 36.6% of injured patients compared to 14.7% in those without injury.20 There is evidence to suggest that poor sleep presents a significant cost burden in the United States, with estimated direct and indirect costs of over half a trillion dollars yearly.23 A third potential underlying etiology for increased costs is the development of chronic medical conditions. Previous studies have demonstrated that combat injured veterans are at a higher risk for a broad array of chronic medical conditions, including HTN, DM, and coronary artery disease (CAD).5,6 Consistent with the higher VA costs seen in the present study in the most severely injured patients, this prior work demonstrates that the greatest risk for developing chronic medical conditions is in severely injured patients. This is also consistent with the high-cost burden seen in the civilian population. The combined direct and indirect cost of HTN in the United States was estimated to be $79 billion in 2017.23 DM and CAD have also been associated with significant costs in the United States, with annual direct and indirect costs of $327 billion and $219.6 billion, respectively.23 Furthermore, PTSD has been associated with increased prosthetic costs18 and mental health conditions have been associated with HTN, DM, and CAD.24,25 This implies that these mechanisms may be self-reinforcing.
Although our study has several strengths, including the broad focus on combat casualties as a group and long follow-up times, there are some limitations. First, the data are retrospective and have all the limitations inherent to that study method. This includes differences between the cohorts at baseline, which we attempted to adjust for in the multivariable models. However, there may be residual confounding because of other unmeasured covariates (such as homelessness and substance abuse). Second, we did not have access to costs that were outside the VA system. Therefore, costs from the Military Health System and the civilian health care system are not included. Although the costs in the Military Health System have been previously described,12 it is not known how injury might impact private health care insurance costs. It is also likely that injured patients sought more of their care in the VA than noninjured patients given that they are more likely to have service-connected disability. This could bias the analysis toward higher VA costs for injured veterans. However, this limitation was mitigated somewhat by our inclusion of VA enrollment priorities in our multivariable models, which has been shown to be associated with VA utilization.26 Furthermore, although veterans are not required to utilize the VA for health care, utilization rates are quite high for the recent conflicts. The most recent review performed in 2015 indicated that 61% of eligible Iraq and Afghanistan veterans had received care in the VA.27 Since the VA is funded by American tax dollars, even if care was provided in the VA to combat injured service members, which that was not a direct or indirect result of their injury, these data are still useful for budgetary and planning purposes. Lastly, it should be noted that the subjects in this study were a specific population of combat casualties. Therefore, these results may not be generalizable to civilian populations with noncombat injury.
CONCLUSION
We quantified the excess costs incurred for injured service members compared to matched service members without a combat injury. Although total VA costs were highest in the first year, the difference remained significant through year 10 after adjustment. If the excess VA costs observed in our cohort are extrapolated to the total population of injured service members, it implies a total burden of $1.6 billion over the 10-year study period. Given that total excess VA costs for injured veterans after adjustment were relatively consistent between years 2 and 10, it is likely that these excess costs will continue. Furthermore, given the associations between combat injury and both mental health as well as chronic comorbidities, these costs may increase as veterans age, particularly if they are not optimally treated. Taken together, this suggests that the costs of VA care for injured service members will continue in the years and decades to come. These future costs will be borne by every taxpayer and should be considered when formulating VA budgets and policy. Although these findings may not be generalizable to the civilian population, the results imply that a similar cost burden may exist in civilian trauma patients. Further work is required to describe long-term costs in this population.
ACKNOWLEDGMENTS
The authors would like to gratefully acknowledge the staff of the DoD Trauma Registry, the Defense Health Agency, the Defense Suicide Prevention Office, the VA Informatics and Computing Infrastructure, and the Department of VA for providing data for this study. Data from the VADIR were provided by the DMDC under agreement between the DoD and VA.
SUPPLEMENTARY MATERIAL
Supplementary Material is available at Military Medicine online.
FUNDING
This work was funded by the U.S. Air Force Headquarters, Office of the Surgeon General and supported by VA Center of Innovation Award #I50HX001240 from the Health Services Research and Development of the Office of Research and Development of the U.S. Department of VA.
CONFLICT OF INTEREST STATEMENT
None declared.
INSTITUTIONAL REVIEW BOARD/ETHICS COMMITTEE APPROVAL
This research protocol was reviewed and approved by the David Grant USAF Medical Center IRB, the University of Utah IRB, and the Research Review Committee of the VA Salt Lake City Health Care System in accordance with all applicable Federal regulations.
AUTHOR CONTRIBUTION STATEMENT
I.J.S., R.E.N., J.T.H., and J.C.J. contributed to conception and design; I.J.S., R.E.N., A.G., and W.P. contributed to data collection;E.P. and R.E.N. contributed to data analysis and interpretation;I.J.S. contributed to writing—original draft;I.J.S., S.A., J.T.H., J.C.J., L.E.W., E.P., K.C.A., J.W., A.G., W.P., Y.S., and R.E.N. contributed to writing—review and editing; I.J.S. and A.G. contributed to funding acquisition;I.J.S. contributed to supervision.
DATA AVAILABILITY
Deidentified data from this study may be available from the corresponding author upon request. Additional approvals may be required, and the data are not publicly available because of privacy or ethical restrictions.
INSTITUTIONAL CLEARANCE
Institutional clearance approved.
CLINICAL TRIAL REGISTRATION
None declared.
REFERENCES
Author notes
The opinions and assertions expressed herein are those of the author(s) and do not necessarily reflect the official policy or position of the Uniformed Services University, the Department of Defense, or the Department of Veterans Affairs. This work was prepared by a military or civilian employee of the U.S. Government as part of the individual’s official duties and therefore is in the public domain and does not possess copyright protection.

