


ABSTRACT
The purpose of this quality improvement project was to develop and evaluate the use of an electronic medication request dashboard to reduce the amount of time required for medication processing and decrease time lost to workflow interruptions during patient discharge. Delayed discharges are associated with increased health care costs and adverse patient outcomes. Processing of medication requests at discharge contributes to these delays and to workflow interruptions for nursing and pharmacy staff at the project site. Electronic dashboards have been successfully implemented in multiple medical settings to streamline patient processing and enhance communication.
The Human Protections Office at Carl R. Darnall Army Medical Center (Fort Hood, TX) reviewed and approved the project with a non-human research determination. A multi-disciplinary workgroup with representatives from nursing, pharmacy, and health information technology (HIT) was formed to develop the dashboard. Based on a logic flow diagram of the desired communication, HIT created a medication request form and status dashboard using SharePoint and Nintex workflows. The dashboard was implemented for a 30-day pilot on a 25-bed medical/surgical nursing unit. The time required for medication processing, the time from discharge order to patient exit, the number of phone calls between nursing and pharmacy, and the usability of the medication request process were measured before and after implementation. The results were analyzed with descriptive statistics and evaluated for statistical significance with a P value ≤.05.
With implementation of the dashboard, the average medication processing time decreased from 125 minutes to 48 minutes (P < .0001), and the average patient discharge time decreased from 137 minutes to 117 minutes (P = .002). The usability score of the medication request process increased from 40 to 87 for nursing (P < .0001) and from 62 to 85 for pharmacy (P = .003). The total number of voice calls between nursing and pharmacy decreased from 1,115 to 434, while the total time on voice calls decreased from 33 hours and 50 minutes to 13 hours and 19 minutes (P < .0001).
The electronic dashboard is an effective method to enhance interdisciplinary communication during patient discharge and significantly reduces medication processing times. However, despite the medication processing time decreasing by over an hour, the discharge time only decreased by 20 minutes. Additional investigation is needed to evaluate other contributors to delayed discharge. A key limitation of this study was the convenience sampling used over a 30-day pilot on a single unit. The process has since been adopted by the entire hospital, and additional analysis could better reveal the impact to the organization. This communication system shows high usability and reduces phone call interruptions for both nursing and pharmacy staff. Additionally, this technology could easily be applied to other communication pathways or request processes across military medicine.
INTRODUCTION
Delayed hospital discharge is a prevalent health care problem that has been linked to longer length of stay, increased hospital costs, and adverse patient outcomes.1 Requesting and processing discharge medications is vital to a successful care transition, but the time required to do so is a contributing factor to delayed discharges. Furthermore, delayed or incomplete communication among the interdisciplinary team members during this transition is both a primary barrier to timely discharge2 and a contributor to adverse medication events.3 Traditional hospital communication strategies based on voice calls cause workflow interruptions that have been associated with increased medication errors, increased stress at work, and decreased satisfaction with performance.4–8 More specifically, interruptions concerning closed patient cases that divert a provider’s attention from their current patient are associated with low ratings of care from patients.9 Such interruptions can include voice calls between nurses and pharmacists regarding the status of discharge medications and can contribute to further discharge delays.
Electronic dashboards are utilized in various medical settings to enhance communication and streamline processes such as radiology reporting,10 management of bed capacity,11 and discharge status.3 For the Carl R. Darnall Army Medical Center (CRDAMC) at Fort Hood (TX), the medication request process was a significant source of delays and interruptions during patient discharge. The time-consuming process included the submission of hard copy requests and utilizing voice calls to confirm receipt, clarify any questions, and determine status updates. The goal of this quality improvement project was to develop and evaluate the use of an electronic medication request dashboard to reduce the amount of time required for medication processing and decrease the time associated with workflow interruptions during patient discharge.
MATERIALS AND METHODS
The CRDAMC Human Research Protection Office reviewed and approved this project with a non-human research determination. A multi-disciplinary work group was established to develop the communication dashboard with representatives from nursing, pharmacy, and health information technology (HIT). The work group developed a logic chart detailing the desired workflow for medication requests (Fig. 1). Based on this chart, HIT used SharePoint and Nintex Workflows to produce both a communication dashboard (Fig. 2) and a medication request form (Fig. 3) that allowed for two-way communication between the nursing and pharmacy departments. Nursing would initiate the request form and route it to pharmacy. Pharmacy would receive the request and either process the medications or re-route the form back to nursing if there are any concerns. Both parties could make comments on the form for clarification and each leg of the process was recorded for time, which can be exported to a spreadsheet for digital analysis. At any time, nursing and pharmacy personnel can view the main dashboard to show the overall status of all medication requests. To protect patient information, the dashboard site is locked using Active Directory Groups to limit access.
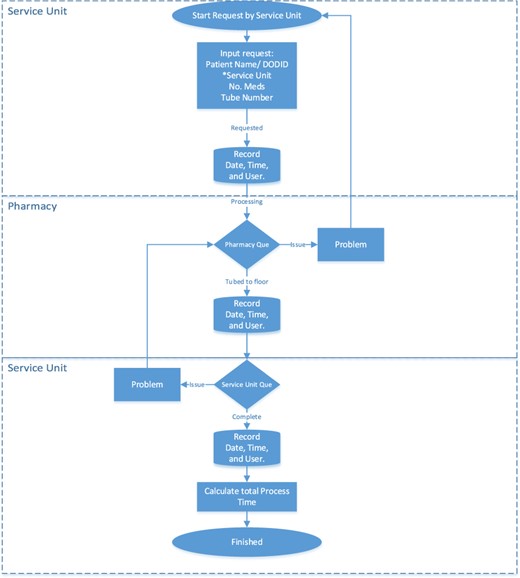
Logic chart of SharePoint workflow.
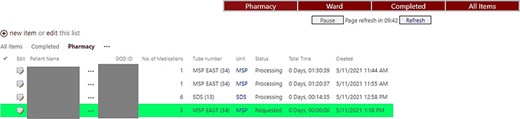
Image of dashboard showing status of medication requests.
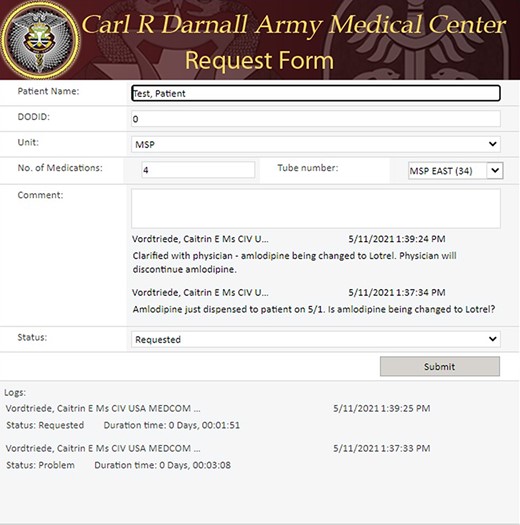
Medication request form with comments showing communication between team members.
The medication request dashboard was implemented for a 30-day trial on a 25-bed Adult and Pediatric Medical Surgical Unit (MSU). The MSU nursing and pharmacy personnel were trained on the process using educational in-service trainings with real-time demonstrations of the process and hands-on training via simulated patient scenarios. Pre-dashboard data were collected for a 30-day period to include the number and total time for voice calls between nursing and pharmacy, the processing time for discharge medications, and the total time of the discharge process. Prior to implementation, nursing and pharmacy personnel completed a survey comprised of the System Usability Scale (SUS) and open-ended questions regarding the perceived quality and time spent on communication during the medication request process at discharge. The SUS is a valid and reliable tool for assessing perceived usability of processes across many industries.12,13 It includes 10 items, each with a Likert-type response that provides an overall score on scale from 0 to 100. A higher score is associated with increased perceived usability and a score greater than 68 is considered “above average.”13 Overall communication was assessed with a single item “yes/no” question: “Was there effective communication between nursing and pharmacy?” This item is similar to the Joint Commission’s Targeted Solution Tool for Hand-off Communication, which uses a single-item question to identify whether or not the communication met the needs of the sender and receiver.14
The total time of discharge was calculated from the time of entry of the discharge order into the electronic health record until the time that the patient was documented by the nursing staff as having left the facility. For the pre-dashboard data, medication time was calculated from the time that nursing staff documented submission of a paper request to pharmacy until the time that pharmacy documented in the electronic health record the dispensing of the medications. Post-dashboard, the medication time was exported from the dashboard, which recorded the overall time for the process from initiation of the request until pharmacy annotated that the medication had been dispensed. The total number of calls and total time for calls between nursing and pharmacy was provided in a computer-generated report from HIT.
Following the trial implementation, the staff repeated the SUS and survey to assess the medication request dashboard process. The same data points (required time for medication processing, patient discharge, and phone conversations) were collected for a 30-day period.
The data collected pre-dashboard and post-dashboard are presented as means and standard deviations for discharge time, medication time, and SUS score. The data were examined using histograms and Q–Q plots and appeared compatible with being from a population having a normal distribution.15 The number of measures were large enough that parametric tests would be appropriate if the normality assumption was not met.16 The pre–post comparison was made using the Welch t-test as the variances differed during the pre- and post-time periods.
The total voice calls over the 30 days pre- and 30 days post-implementation of the dashboard were assumed to be counts that followed a Poisson distribution with equal mean and variance. With this assumption, the pre- and post-counts collected over 30 days were compared using a Poisson two-sample Z test with formula Z = (cX − Y)/sqrt(c2X + Y) where c = 30 days/30 days = 1 (https://ncss-wpengine.netdna-ssl.com/wp-content/themes/ncss/pdf/Procedures/PASS/Tests_for_the_Difference_Between_Two_Poisson_Rates.pdf). For the effective communication measure, Fisher’s exact tests were used to compare pre- and post-responses for pharmacy and nursing. All analyses were performed using R version 4.1.2, and significance defined as P < .05.
RESULTS
Discharge and Medication Processing Time
A comparison of the pre- and post-dashboard data from the MSU during a 60-day period is presented in Table I. The pre-dashboard data collection included 237 patient discharges with an average time of 137 minutes between receipt of the discharge order by nursing and the patient’s actual exit from the facility. Following implementation, 256 patient discharges were analyzed, with an average discharge time of 117 minutes. A Welch’s two-sample t-test showed a statistically significant reduction in discharge time after dashboard implementation (P = .002). During same pre-dashboard collection period, pharmacy received 111 discharge medication requests, and medications were dispensed with an average processing time of 125 minutes. The pharmacy standard to process medications within 2 hours was met on 48 requests (43%). When the dashboard process was implemented in the MSU, there were 146 discharge medication requests with an average processing time of 48 minutes, showing a significant time reduction (P < .0001), with 100% of requests being completed within the 2-hour standard.
Data Summary
| Pre-dashboard | Post-dashboard | t (df)a | P-value | |
|---|---|---|---|---|
| Discharge time in minutes | 137 (83) | 117 (65) | 3.0 (446) | .002 |
| Total discharges (n) | 237 | 256 | ||
| Medication time in minutes | 125 (79) | 48 (22) | 9.9 (123) | <.0001 |
| Total requests (n) | 111 | 146 | ||
| Usability (SUS) score | ||||
| Pharmacy | 62 (17.7) | 85 (13.9) | −3.4 (20) | .003 |
| Total responses (n) | 14 | 9 | ||
| Nursing | 40 (17.3) | 87 (10.7) | −9.4 (29) | <.0001 |
| Total responses (n) | 19 | 12 | ||
| Voice callsb | ||||
| Total calls | 1,115 | 434 | Z = 17.3 | <.0001 |
| Calls per day | 37 | 14 | ||
| Total time (hr:min) | 33:50 | 13:19 | ||
| Time per day (minutes) | 68 | 26 | ||
| Effective communicationc | ||||
| Pharmacy f (%yes) | 2 (14%) | 8 (89%) | – | .0007 |
| Total responses (n) | 14 | 9 | – | |
| Nursing f (%yes) | 1 (5%) | 8/12(66%) | – | .0005 |
| Total responses (n) | 19 | 12 |
Abbreviation: SD = standard deviation.
Values are mean (SD) except where indicated.
Welch’s two-sample t-test.
The test statistic is Z = (cX − Y)/sqrt(c2X + Y); https://ncss-wpengine.netdna-ssl.com/wp-content/themes/ncss/pdf/Procedures/PASS/Tests_for_the_Difference_Between_Two_Poisson_Rates.pdf.
Fisher’s exact test—“Was there effective communication?” Yes/no.
SUS Survey
Nurses (n = 19) completed the pre-survey with an average SUS score of 40, 100% of respondents reporting that the medication request process contributed to delays in patient discharge, and only one nurse (5%) reporting effective voice communication with pharmacy. Following dashboard implementation, 12 nurses completed the survey with an average SUS score of 87 (P < .0001), only one nurse (8%) reporting that the medication request process contributed to delays in discharge, with eight nurses (66%) reporting effective communication with pharmacy (P = .0005).
Similarly, pharmacy staff (n = 14) completed the pre-survey with an average SUS score of 62 and two respondents (14%) reporting effective communication with nursing. After dashboard implementation, nine pharmacy staff reported an improved average SUS of 85 (P = .003), with eight respondents (89%) reporting effective communication with nursing (P = .0007).
Voice Call Interruptions
Prior to the dashboard, there were 1,115 voice calls between nursing and pharmacy during the same 30-day period, with a total call time of 33 hours and 50 minutes, with an average of 37 calls and 68 minutes spent on calls per day. During the 30-day period after implementation of the dashboard, the total number of voice calls between nursing and pharmacy was reduced to 434, with a total call time of 13 hours and 19 minutes, with an average of 14 calls and 26 minutes spent on calls per day. A z-statistic test showed a statistically significant reduction in the total number of calls before and after implementation (P < .0001).
DISCUSSION
The electronic dashboard was successfully implemented and adopted into practice by MSU nursing and pharmacy staff. The average time for medication processing was reduced by 77 minutes, with a 57% increase in compliance for pharmacy’s 2-hour processing goal. In fact, every medication requested during the trial period was processed in less than 2 hours, and the decrease in time was statistically significant. However, despite saving over an hour on average medication processing, the average discharge time was only decreased by 20 minutes. While this time difference is statistically significant, a larger time savings was anticipated that more closely aligned with the time saved on the medication process. These findings suggest that there are additional contributors to delayed discharge on MSU that need to be evaluated, making it clear that the improvement in discharge time must be approached in a stepwise manner rather as a matter of improving a single aspect of the process.
The total time spent on voice calls was reduced by more than 20 hours, translating to an average savings of 42 minutes per day. The volume of calls received per month decreased by 681, potentially preventing an equal number of workflow interruptions. Concurrently, the percentage of staff reporting effective communication between nursing and pharmacy was significantly increased. These results suggest that the electronic dashboard provides more effective and efficient communication in a shorter amount of time. Furthermore, the decrease in interruptions achieved by the reduction in voice calls are likely to have had an impact on patient safety and nurse satisfaction, but these outcomes were not evaluated in this project.
Beyond time savings, the electronic dashboard was found to be much more user-friendly than the previous process. The SUS scores increased by 47 points for nursing and by 23 points for pharmacy, both statistically significant findings. The average score for both areas was above the 80-point threshold whereby a user is likely to continue utilizing the process and recommend it to other users.13 It also saved the cost of paper medication request forms and of delivery back and forth between nursing and pharmacy, which might eventually amount to a monetary savings as well.
Lessons Learned
The process of developing and implementing the dashboard resulted in several key lessons learned that can be applied to future applications of this technology. First, time and attention must be allotted for the development of the logic chart and detailed workflow for the routing of the electronic request. This information was vital for HIT personnel to develop a product that was both useful and user-friendly, the latter of which would increase its ease of adoption after implementation. It was also necessary to specify the specific data to be recorded and made exportable to another program for analysis, properties that have proven to be extremely useful in documenting results. Second, the dashboard must include a striking visual representation of items that had changed status. Testing by the developers showed that it was difficult to recognize items that needed attention in the dashboard’s first iteration, so entries were flagged with highlighting and differently colored text to indicate when an action was necessary. Finally, the education phase of the implementation was greatly enhanced by hands-on, simulated scenarios that required the staff members to actually enter data and demonstrate both sending and receiving the information. Furthermore, the training was tailored to the specific audience (nursing or pharmacy) and was delivered by an interdisciplinary team with representation from both specialties to answer questions.
The small scope and limited data from the 30-day trial were primary limitations of this project. Following the project, the dashboard was adopted by the entire facility and is now the standard for discharge medication communication in all units. Further data review should be conducted to assess the impact on a larger scale and with a larger sample size. As previously mentioned, the scope of the project did not include several additional outcome measures of interest. Future studies should consider evaluating the dashboard’s impact on patient satisfaction with the care transition and the impact on readmission rates. Additionally, a more in-depth evaluation of communication effectiveness is necessary to ensure the dashboard provides the information required for efficient medication processing. Based on the time savings achieved by pharmacy, the overall productivity of the service could be evaluated to determine whether additional patients could be processed during the same time period. The project was focused on the medication request portion of the discharge process. As discussed, a large reduction in medication processing was associated with a much smaller reduction in overall discharge time. The scope of this project did not allow for a full analysis of the entire discharge process but has provided evidence that additional barriers to timely discharge exist and must be evaluated and addressed.
CONCLUSIONS
The electronic dashboard is an effective method for enhancing interdisciplinary communication during patient discharge that significantly reduces medication processing times. Furthermore, this communication system shows high usability and reduces phone call interruptions for both nursing and pharmacy staff. Assembling an interdisciplinary team to develop a detailed workflow for the requests is important to successfully transition the process into an electronic system. Some key attributes of the dashboard include the ability to archive and export data and the use of visually striking messaging to easily identify action items. This technology could easily be applied to other communication pathways or request processes across military medicine.
ACKNOWLEDGMENT
None declared.
FUNDING
None declared.
CONFLICT OF INTEREST STATEMENT
The authors have no known conflicts of interest of financial or material support disclosures.
REFERENCES
Author notes
The contents of this publication are the sole responsibility of the authors and do not necessarily reflect the views, opinions, or policies of Uniformed Services University of the Health Sciences (USUHS), the Department of Defense (DoD), or the Departments of the Army, Air Force or Navy. Mention of trade names, commercial products, or organizations does not imply endorsement by the U.S. Government.

