


Abstract
The Noise Outcomes in Servicemembers Epidemiology (NOISE) Study is obtaining longitudinal data to evaluate the effects of noise and other exposures on auditory function in military personnel. A gap in the literature is the lack of studies concerning how active-duty Service members might be impacted by having tinnitus. The present study reports NOISE Study data that address this gap.
Data are reported from current Service members and recently-separated (within 2.5 years) Veterans, enabling a direct comparison of results between active and post-military samples. Data were collected from two sites: VA Portland Health Care System, Portland, OR and Department of Defense Hearing Center of Excellence, San Antonio, TX. Participants completed comprehensive audiometric testing and numerous questionnaires.
Results are presented from n = 428 participants across the two sites, including 246 Veterans and 182 Service members. The data reveal that, for both Service members and Veterans, the presence of tinnitus has effects on job performance, concentration, anxiety, depression, and sleep.
This study has revealed that, for these samples of study participants, tinnitus has an impact on military Service members that is comparable to how it affects Veterans who have completed their military service within the previous 2.5 years.
INTRODUCTION
Tinnitus (“ringing in the ears”) is most typically associated with exposure to loud noise, which also can cause hearing loss.1 Tinnitus and hearing loss greatly impact Veterans following their military career, as evidenced by the fact that these auditory conditions have been the most prevalent service-connected disabilities awarded to Veterans registered with the Veterans Benefits Administration (VBA) for the past two decades (VBA Annual Reports), as well as the mounting evidence correlating hearing loss and tinnitus to anxiety, sleep disorders, early onset dementia, and other troubling co-morbidities related to a decreased quality of life.2–6
Tinnitus is experienced by 10–15% of adults, and, for about one in five of those, their tinnitus is “bothersome” to the point that clinical intervention is warranted.7,8 The impact of tinnitus is well known both for the general population9,10 and for military Veterans.6,11 The question addressed by the present analysis is how tinnitus affects active-duty Service members.
The impact of hearing loss on military Service members, including deficits in task performance, has been reported in several studies.5,6,12 As an example, Rajguru13 reported that noise-induced hearing loss in military aircrew can interfere with mission completion, and can cause crewmembers to be downgraded from their flying duties. Also, Keller et al14 concluded that the negative effects of noise, specifically decreased speech intelligibility, significantly degrade Sailors’ abilities to communicate effectively. Undocumented in these and similar studies is the effect tinnitus may have on the success of military missions.
In general, people who present with tinnitus are more likely to have sleep disorders, depression, anxiety, and suicidal ideation.15 Concentration, emotional stability, alertness, and adequate sleep may all influence the ability of Service members to carry out their assigned tasks, especially in combat situations. It has therefore been postulated that bothersome or distracting tinnitus may complicate the efficiency of operational missions such as stealth and readiness – major components of mission accomplishment.16
Sleep is a major concern for military personnel and can directly impact safety and performance.17 Kucharczyk et al18 in a review of 30 studies investigating sleep and workplace performance, reported that 11 studies were helpful in identifying associations between sleep and occupational errors and injuries. One of these studies19 showed that risk of a workplace error and injury was significantly higher when more than 30 minutes was required to fall asleep. Further, a controlled study20 displayed significantly higher levels of industrial injuries for individuals who reported having insomnia versus those who were “good sleepers.” Specific to the military population, a longitudinal study by Johnson and Spinweber21 surveyed U.S. Naval recruits and determined that those with insomnia were less likely to be promoted and attain pay raises over the 6-year period. As the most common symptom associated with tinnitus is sleep disturbance,22 it is particularly important to know if tinnitus affects the sleep of Service members.
Anxiety and depression are commonly comorbid with tinnitus,2,7,8 and can negatively affect Service members. A study conducted with 3,999 Veterans reported that symptoms of depression (without anxiety) made it more difficult for study participants to recall new information, while showing no such effect for anxiety alone.23 In a combat situation, the inability to accurately recall information may have an undesirable association with mission safety and accomplishment. Another key component to success of an assignment is the measure of productivity. The study also reported that productivity in the workplace of participants who had depression was at least 50% below average. In a recent study of Iraq and Afghanistan Veterans, post-traumatic stress disorder (PTSD) was seen to be associated with tinnitus but not depression.24
The Noise Outcomes in Servicemembers Epidemiology (NOISE) Study is currently underway at both the Veterans Affairs (VA) National Center for Rehabilitative Auditory Research (NCRAR) in Portland, OR, and the Department of Defense (DoD) Hearing Center of Excellence (HCE) on Joint Base San Antonio (JBSA), including both Wilford Hall Ambulatory Surgical Center and Brooke Army Medical Center, in San Antonio, TX. The NOISE Study is primarily examining short- and long-term effects of military and non-military noise exposures on auditory functioning among Veterans and Service members. Preliminary descriptive results have been presented previously.25 For purposes of the present report, “Veteran” is defined as any participant who was not currently in the military at the time of study enrollment. “Service member” is defined as any participant who, at the time of enrollment, stated they were currently in the military (including Reservists and National Guard members). This study, which includes comprehensive tinnitus evaluations, offers an unprecedented opportunity to investigate the impact of tinnitus on Service members. The purpose of the present report is to analyze data from the NOISE Study that address the question of how tinnitus affects Service members (e.g., job performance, emotional well-being, etc.). Analyses are also performed on data obtained from recently-separated Veterans, enabling a direct comparison of results between active and post-military samples.
METHODS
The NOISE Study was approved by the joint Institutional Review Board (IRB) for the VA Portland Health Care System (VAPORHCS; IRB #3159) and the Oregon Health & Science University (OHSU; IRB #9495). Approvals for the HCE site were obtained by the Medical Research and Materiel Command IRB (IRB #M-10423).
Participants
Data presented here are from the first 428 participants seen in the NOISE study (246 Veterans, 182 Service members). Of the 182 Service members, 109 were enrolled at the HCE and 73 were enrolled at the NCRAR.
Recruitment
NOISE Study participants in Portland were recruited from the following locations: (1) VAPORHCS post-deployment health clinics; (2) a regional web-based clinical database, which identifies all returning combat Veterans from all Veterans Integrated Service Network #20 facilities; (3) outreach events; (4) study announcements at VAPORHCS and at our affiliate university, OHSU; and (5) flyers, internet, and newspaper advertisements. To be eligible for participation at the NCRAR, study participants must have received a DD Form 214 (Certificate of Release or Discharge from Active Duty) from the DoD within the last ~2.5 years or have completed service in the National Guard or Reserves within the last ~2.5 years. Participants, however, could be on active orders in the National Guard or Reserves and still be eligible for the study. It was not a requirement that participants have been deployed to any recent conflicts in and around Iraq and Afghanistan. To date, 378 participants (including Veterans, Guard Members, and Reservists) have been enrolled at the NCRAR facility.
NOISE Study participants in San Antonio were recruited from JBSA locations. To be eligible for the study, participants must be TriCare eligible, which includes those currently serving in the military and Service members who retired (including medical retirees). The latter were required to have separated or retired within the last ~2.5 years to be eligible for the study. To date, 138 participants (including Guard Members and Reservists) have been enrolled at the HCE.
Procedures
All study participants gave written informed consent and signed a separate Health Insurance Portability and Accountability Act Authorization for Release and Use of Individually Identifiable Health Information form.
Numerous procedures are performed on participants in the NOISE Study to collect a wide range of longitudinal data addressing the overall aims of the project. Relative to the present study, otoscopy and pure-tone air (250–16,000 Hz) and bone (500–4,000 Hz) conduction audiometry were completed as part of an extensive audiometric evaluation. For the purposes of our analyses, the low-frequency pure tone average (PTA; average of 250, 500, 1,000, and 2,000 Hz), the high-frequency PTA (average of 3,000, 4,000, 6,000, and 8,000 Hz), and the extended-high-frequency PTA (average of 9,000, 10,000, 11,200, 12,500, 14,000, and 16,000 Hz) of the air conduction thresholds were used. PTAs were computed using both ears.
All participants in the NOISE study complete 15 questionnaires. If they are identified by the Tinnitus Screener as having tinnitus warranting clinical management (see below), then they are placed in the Tinnitus group (versus the No Tinnitus group) and they complete an additional three tinnitus questionnaires. Completion of all questionnaires generally requires up to 2.5 hours. The large number of questionnaires is necessary for this epidemiology study to clarify relationships between numerous variables potentially affecting tinnitus and hearing loss. Only questionnaires used to derive data for the present analyses are described below. All of the questionnaires (excluding the Demographic Questionnaire and the Tinnitus History Questionnaire) provide index scores that were used in the analyses, and they have been verified for relevant psychometric properties of validity and reliability in the referenced publications.
Demographic Questionnaire
This five-page questionnaire was specifically developed for the NOISE Study to collect basic demographic information including age, gender, branch of military service, and current/active military status.
Tinnitus Screener
The Tinnitus Screener is a tool that determines a person’s “tinnitus category,” including constant, intermittent, occasional, or temporary.26 Only participants who were categorized as having constant tinnitus (can always or usually hear tinnitus in a quiet room) or intermittent tinnitus (experience tinnitus daily or weekly) were included in the Tinnitus group as they would be most likely to be able to hear their tinnitus at the time of testing. The original four-item Tinnitus Screener, which has been shown to have good predictive validity,26 was used for the first 195 of 246 participants at the VAPORHCS site and 73 of 115 participants at the DoD site. All other participants used the updated 6-item version, which adds the “occasional” (experience tinnitus every few weeks or months) category (participants with occasional tinnitus were placed in the No Tinnitus group for this study). The 6-item version also distinguishes between “acute” (<6 months) and “chronic” (≥6 months) tinnitus.
Tinnitus History Questionnaire
This questionnaire, modified from the OHSU Tinnitus History Questionnaire,27 was administered only to those who qualified for the Tinnitus group, and included items that established the history of tinnitus, tinnitus attributes, and tinnitus impact/severity. Five questions were examined for the present analysis: two related to duration and severity of tinnitus and three related to the impact of tinnitus on work activities.
Tinnitus Functional Index (TFI)
The 25-item TFI was administered only to participants in the Tinnitus group. The TFI has documented validity both for scaling the severity and negative impact of tinnitus, and for measuring treatment-related changes in tinnitus (responsiveness).28 Results of extensive testing support the classification of TFI scores (on a scale of 0–100) below a value of 25 as indicating relatively mild tinnitus.28,29 Scores from 25 to 50 suggest more significant problems with tinnitus. Scores above 50 indicate tinnitus severe enough to qualify for more aggressive efforts to provide relief, possibly involving referral to specialty tinnitus care. Eight subscales provide useful information for evaluating the specific profile of tinnitus-related problems.
Hearing Handicap Inventory for Adults (HHIA)
The 25-item HHIA30 was used to assess self-perceived hearing difficulties. Response options for each item are: Yes (4 points), Sometimes (2 points), and No (0 points). Each of the 25 items is summed to generate a total score. Total HHIA scores can range from 0 (no handicap) to 100 (total handicap). Higher HHIA scores indicate greater difficulties (0–16 = No Handicap; 18–42 = Mild-Moderate Handicap; 44+ = Significant Handicap). Data from Newman et al30 showed high internal consistency and reliability and a low standard error of measurement for the HHIA.
Speech, Spatial, and Qualities of Hearing Scale (SSQ)
The SSQ also obtains information about self-perceived hearing difficulties.31 This study used the 12-item version (SSQ1232), which evaluates multiple aspects or “domains” of hearing ability, including speech understanding, spatial aspects of hearing, sound quality and naturalness, and listening effort. Each question has an associated 0–10 numeric rating scale, with 0 corresponding to not being able to do or experience what is described and 10 to being perfectly able to do or experience what is described in the question. A strength of using this instrument is that it was designed to evaluate perceived communication problems in difficult listening situations, such as communication with multiple talkers, or when trying to follow a single talker in a background of other noise. SSQ total score and three of the four subscales were evaluated.
Hospital Anxiety and Depression Scale (HADS)
This self-assessment scale to detect states of depression, anxiety, and emotional distress consists of 14 items, with responses scored on a scale of 0–3, with 3 indicating higher symptom frequency.33 Scores of each subscale (anxiety and depression) range from 0 to 21 with the following categorizations: normal 0–7, mild 8–10, moderate 11–14, and severe 15–21.
Tinnitus and Hearing Survey (THS)
The THS is a 10-item survey that separates problems due to tinnitus from those due to hearing loss or a sound tolerance problem.34 The four items related to the impact of tinnitus (Section A) were used in the present analysis. Responses for each item ranged from 0 (not a problem) to 4 (very big problem). Due to few responses in the “very big problem” category, big and very big problem categories were combined into a single category.
Epworth Sleepiness Scale (ESS)
The ESS is the most widely used standardized tool for identifying how likely a person is to doze off or fall asleep in specific situations, such as sitting and reading or watching television.35 For the eight situations described, responses range from 0 (would never doze) to 3 (high chance of dozing), with a total summed score ranging from 0 to 24. Categories of sleepiness derived from the total score include: Getting enough sleep (scores of 1–6); Average sleep (7–8); and Very sleepy and should seek medical advice (≥9). These three categories were examined.
World Health Organization – Disability Assessment Schedule (WHODAS) 2.0
Functional health status was assessed using the 12-item, self-administered version of the WHODAS 2.0.36 This instrument asked participants about the degree of difficulties they experienced in the past 30 days completing activities related to cognition, mobility, self-care, getting along, life activities, and participation. Response options range from 0 (“none”) to 5 (“extreme or cannot do”). Only a total score can be derived for the WHODAS 2.0 – 12-item version. Chisolm et al37 reported that an earlier and longer (36-item) version of the WHODAS questionnaire was valid for assessing functional health status for those with hearing loss. No data regarding the validity of the 12-item version with those with hearing loss and/or tinnitus are available. Acknowledging this limitation and the fact that subscale scores cannot be calculated with the 12-item version, the study team elected to change our protocol to adopt the WHODAS 2.0 – 36. This change commenced with our 105th participant. To compare across all participants collected thus far, our analyses converted responses from the 36-item version to the 12-item version.
Data Analysis
To ensure the completeness of data, all questionnaires were reviewed by a member of the study team during the participants’ visits. If missing items were detected prior to data entry and verification, attempts were made to contact the participant by phone to complete and verify data. To minimize data entry errors, all questionnaires were scanned twice into separate databases using TeleForm (Hewlett Packard, Palo Alto, CA, USA). Any discrepancies noted between the two scans were resolved by the NOISE Study data manager using an established protocol. The audiometric data were entered manually, with one audiologist reading the data from the source document and another entering the data and orally reporting the entry being made.
Data analyses were conducted using SPSS version 22 with the goal to evaluate the relative impact of tinnitus on current Service members and recently-separated Veterans. Chi-square analyses and analyses of variance were performed to determine significant differences between Tinnitus and No Tinnitus groups on factors related to difficulty performing work activities, objective and subjective hearing problems, and emotions, concentration, sleep, and functional health. A Bonferroni adjustment was made for multiple comparisons (30/0.05 = 0.002). Observations of similarities and differences between groups are reported.
RESULTS
Prevalence, Duration, and Severity of Tinnitus
Table I displays the participant characteristics and the prevalence and duration of tinnitus. Mean ages of Service members and Veterans were comparable but there were differences in gender and military branch. Higher percentages of active Service members were women (30% vs. 13% for Veterans) and in the Air Force (53% vs. 18% for Veterans). Almost half (48%) of Veterans were in the Army, compared to just over one-third (37%) of Service members. Two-thirds of Veterans (67%) reported tinnitus (intermittent or constant) compared with 44% of Service members.
Demographics, Prevalence, Duration, and Severity of Tinnitus for Service Members and Veterans
| Service Members (n = 182) | Veterans (n = 246) | |
|---|---|---|
| Age | Mean (SD), Range | Mean (SD), Range |
| 34.8 (8.8), 19−60 | 33.5 (9.0), 21−61 | |
| Gender | n (%) | n (%) |
| Male | 128 (70.3) | 215 (87.4) |
| Female | 54 (29.7) | 31 (12.6) |
| Military branch | n (%) | n (%) |
| Army | 67 (36.8) | 118 (48.0) |
| Marines | 5 (2.7) | 50 (20.3) |
| Navy | 14 (7.7) | 35 (14.2) |
| Airforce | 96 (52.7) | 43 (17.5) |
| Tinnitus status | n (%) | n (%) |
| No tinnitus | 88 (48.6) | 68 (27.6) |
| Temporary/occasional | 12 (6.6) | 14 (5.7) |
| Intermittent | 20 (11.0) | 55 (22.4) |
| Constant | 61 (33.7) | 109 (44.3) |
| N = 79a | N = 162a | |
| How long aware of Tinnitus | n (%) | n (%) |
| Less than 1 year | 8 (10.1) | 9 (5.6) |
| 1–2 years | 21 (26.6) | 35 (21.6) |
| 3–5 years | 17 (21.5) | 65 (40.1) |
| 6–10 years | 18 (22.8) | 32 (19.5) |
| 11–20 years | 13 (16.0) | 15 (9.3) |
| 20+ years | 2 (2.5) | 6 (3.7) |
| How much of a problem is tinnitus | n (%) | n (%) |
| Not a problem | 10 (12.7) | 23 (14.2) |
| Small problem | 34 (43.0) | 43 (26.5) |
| Moderate problem | 26 (32.9) | 81 (50.0) |
| Big problem | 8 (10.1) | 9 (5.6) |
| Very big problem | 1 (1.3) | 6 (3.7) |
aMissing data for two subjects.
Most participants had experienced tinnitus for more than a year. However, 19% of Service members had tinnitus lasting more than 10 years compared with only 13% of Veterans (in all but one case, Service members who reported tinnitus lasting more than 10 years had been in the military for over 10 years). Nearly half (44%) of Service members and 59% of Veterans rated their tinnitus as a moderate to very big problem.
Figure 1 shows mean audiometric thresholds (conventional and extended-high-frequency) by tinnitus status (tinnitus/no tinnitus), for Service members and Veterans. The figure shows similar hearing, on average, in Veterans vs. Service members and slightly worse hearing among those with tinnitus.
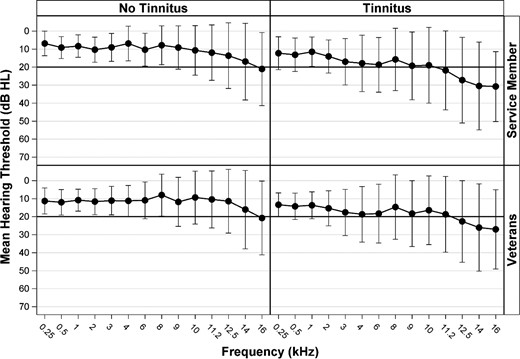
Mean conventional and extended-high-frequency audiometric thresholds in dB HL averaged between both ears, summarized for the entire sample. Error bars indicate standard deviation.
TFI and Subscales
Mean TFI scores for participants in the Tinnitus group are presented in Table II. Service members’ and Veterans’ scores were similar with slightly higher mean scores for Veterans across all index scores. Both Service members and Veterans had mean scores in the 30 s and 40 s, suggesting significant tinnitus problems for both groups. The highest scores were observed for the Intrusive and Sense of Control subscales. These subscales include questions about tinnitus awareness/annoyance and ability to cope with tinnitus, respectively.
TFI and Subscales, Mean, Standard Deviation, Range
| Service Members (n = 80)a | Veterans (n = 162)b | |||
|---|---|---|---|---|
| Mean (SD) | Range | Mean (SD) | Range | |
| TFI total score | 32.7 (21.1) | 0–91 | 36.3 (21.4) | 0–94 |
| TFI subscale score | ||||
| Intrusive | 46.6 (23.5) | 0–97 | 50.6 (25.4) | 0–100 |
| Sense of control | 45.4 (25.8) | 0–100 | 46.6 (26.1) | 0–100 |
| Cognitive | 31.4 (25.5) | 0–90 | 38.4 (26.1) | 0–100 |
| Sleep | 31.0 (27.3) | 0–100 | 30.4 (27.6) | 0–100 |
| Auditory | 34.1 (27.4) | 0–97 | 41.4 (27.4) | 0–100 |
| Relaxation | 38.8 (28.7) | 0–97 | 41.3 (30.6) | 0–100 |
| Quality of life | 19.6 (23.2) | 0–93 | 24.4 (23.3) | 0–100 |
| Emotional | 18.8 (22.0) | 0–93 | 21.1 (22.0) | 0–100 |
aMissing data for one subject.
bMissing data for two subjects.
Tinnitus and Work Performance
When asked about the impact of tinnitus on “work performance or other activities” (see Table III), 14% of Service members said that because of tinnitus they did not do work or other activities as carefully as usual; 10% said they were limited in the kind of work they do; and 27% had difficulty performing work or other activities because of tinnitus. Veterans had similar results with slightly higher percentages of participants indicating negative impacts of tinnitus on work performance or other activities.
Tinnitus and Work Performance
| Service Members (n = 79)a | Veterans (n = 162)a | |||
|---|---|---|---|---|
| Because of tinnitus, over the past 6 months have you found that you…. | No n (%) | Yes n (%) | No n (%) | Yes n (%) |
| Did not do work or other activities as carefully as usual? | 68 (86.1) | 11 (13.9) | 133 (82.1) | 29 (17.9) |
| Were limited in the kind of work you do or other activities? | 71 (89.9) | 8 (9.9) | 137 (84.6) | 25 (15.4) |
| Had difficulty performing work or other activities? (for example, it took extra effort) | 58 (73.4) | 21 (26.6) | 116 (71.6) | 46 (28.4) |
aMissing data for two subjects.
Tinnitus and Concentration
Table IV shows the results from Section A of the Tinnitus and Hearing Survey, revealing that 61% of Service members reported problems “concentrating on reading” due to their tinnitus (21% moderate to very big problem; 40% small problem). Similarly, 67% of Veterans with tinnitus reported problems with concentration (32% moderate to very big problem; 35% small problem). Participants also described difficulty ignoring their tinnitus, with 36% and 28% of Service members and Veterans reporting a small problem, respectively, and 14% and 17% reporting a moderate to very big problem.
Impact of Tinnitus on Concentration, Sleep, and Relaxation
| Service Members (n = 81) | Veterans (n = 164) | |
|---|---|---|
| n (%) | n (%) | |
| Over the Last Week, Tinnitus Kept Me From Concentrating on Reading | ||
| Not a problem | 32 (39.5) | 54 (32.9) |
| Small problem | 32 (39.5) | 58 (35.4) |
| Moderate problem | 12 (14.8) | 40 (24.4) |
| Big to very big problem | 5 (6.2) | 12 (7.3) |
| Over the last week, I couldn’t get my mind off of my tinnitus | ||
| Not a problem | 41 (50.6) | 89 (54.3) |
| Small problem | 29 (35.8) | 46 (28.0) |
| Moderate problem | 7 (8.6) | 21 (12.8) |
| Big to very big problem | 4 (4.9) | 8 (4.8) |
| Over the last week, tinnitus kept me from sleeping | ||
| Not a problem | 38 (46.9) | 81 (49.4) |
| Small problem | 28 (34.6) | 55 (33.5) |
| Moderate problem | 12 (14.8) | 24 (14.6) |
| Big to very big problem | 3 (3.7) | 4 (2.4) |
| Over the last week, tinnitus kept me from relaxing | ||
| Not a problem | 32 (39.5) | 63 (38.4) |
| Small problem | 31 (38.3) | 49 (29.9) |
| Moderate problem | 13 (16.0) | 40 (24.4) |
| Big to very big problem | 5 (6.2) | 12 (7.3) |
Each of these four items was derived from Section A of the Tinnitus and Hearing Survey.
Tinnitus and Sleep
Table IV also reveals that over half of both the Service members and Veterans had at least a “small problem” with sleeping due to tinnitus. In addition, over 60% of both the Service members and Veterans had at least a “small problem” with their ability to relax due to tinnitus. Table V shows that almost 60% of Service members and 43% of Veterans in the Tinnitus group were categorized as being very sleepy during daytime activities (e.g., sitting and reading, watching television) and in need of seeking medical advice, compared with 39% of Service members and 36% of Veterans in the No Tinnitus group. Differences in sleepiness between Tinnitus and No Tinnitus groups were not statistically different for Service members or Veterans.
Tinnitus and Sleep Based on the ESS
| Service Members | Veterans | |||
|---|---|---|---|---|
| n = 100 | n = 80a | n = 81a | n = 164 | |
| Sleepiness | No tinnitus n (%) | Tinnitus n (%) | No tinnitus n (%) | Tinnitus n (%) |
| Getting enough sleep | 44 (44.0) | 20 (25.0) | 34 (42.0) | 67 (40.9) |
| Getting average sleep | 17 (17.0) | 13 (16.3) | 18 (22.2) | 26 (15.9) |
| Very sleepy, should seek medical advice | 39 (39.0) | 47 (58.8) | 29 (35.8) | 71 (43.3) |
aMissing data for one subject.
Tinnitus and Hearing
Table VI presents the PTA for Service members and Veterans by tinnitus status. Participants with tinnitus consistently had worse hearing than those without tinnitus for average low, high, and extended-high frequencies (p ≤ 0.002). There were no significant differences between Service members and Veterans in PTA for low, high, or extended-high frequencies. Subjective reports of hearing problems revealed similar results – those in the Tinnitus group reported significantly greater problems with their hearing than those in the No Tinnitus group, and they demonstrated a more significant hearing handicap based on the HHIA (p ≤ 0.002). Slightly higher proportions of Veterans than Service members reported a significant hearing handicap.
Tinnitus and Hearing: Low, High, and Extended-High PTAs and Subjective Hearing Measures
| Service Members | Veterans | |||
|---|---|---|---|---|
| n = 100 | n = 80b | n = 82 | n = 164 | |
| Average hearing loss (dB HL) | No tinnitus mean (SD) | Tinnitus mean (SD) | No tinnitus mean (SD) | Tinnitus mean (SD) |
| Low frequencies (0.25-2 kHz) | 8.5 (5.0) | 12.8 (7.2)a | 11.4 (5.6) | 14.2 (6.1)a |
| High frequencies (3–8 kHz) | 8.5 (7.4) | 17.3 (12.7)a | 10.3 (7.7) | 17.3 (13.0)a |
| Extended-high frequencies (9–16 kHz) | 14.9 (14.4) | 25.9 (18.7)a | 13.7 (14.7) | 23.5 (19.9)a |
| n = 100 | n = 81 | n = 82 | n = 164 | |
| Overall, how much of a problem are you having with your hearing? | No tinnitus n (%) | Tinnitus n (%) | No tinnitus n (%) | Tinnitus n (%) |
| No problem | 57 (57.0) | 11 (13.6)a | 34 (41.5) | 19 (11.6)a |
| Mild problem | 34 (34.0) | 43 (53.1) | 33 (40.2) | 67 (40.9) |
| Moderate problem | 9 (9.0) | 22 (27.2) | 13 (15.9) | 64 (39.0) |
| Big problem – very big | 0 (0.0) | 5 (6.2) | 2 (2.4) | 14 (8.5) |
| n = 99 | n = 80 | n = 80 | n = 163 | |
| HHIA | No tinnitus n (%) | Tinnitus n (%) | No tinnitus n (%) | Tinnitus n (%) |
| No handicap | 90 (90.9) | 43 (53.7)a | 61 (76.3) | 64 (39.3)a |
| Mild – moderate handicap | 8 (8.1) | 24 (30.0) | 19 (23.7) | 60 (36.8) |
| Significant handicap | 1 (1.0) | 13 (16.3) | 0 (0.0) | 39 (23.9) |
aSignificant difference between Tinnitus groups at p ≤ 0.002 (Bonferoni correction 30/0.05).
bMissing data for one subject.
Table VII evaluates the perceived communication problems in difficult listening situations using the SSQ12. Mean scores for the total SSQ12 and three subscales are presented with lower scores corresponding to greater difficulty in complex listening environments. Those in the Tinnitus group perceived greater communication problems in difficult listening situations than No Tinnitus participants for total SSQ12 score (No Tinnitus Service members had a mean total score of 7.9 versus 6.4 for Tinnitus) and the three subscales (p ≤ 0.002). Both Service member and Veteran participants in the Tinnitus group had greater difficulty in: (1) understanding speech with background noise or when multiple talkers are present (No Tinnitus Service members had a mean score of 7.5 versus 5.6 for Tinnitus); (2) perceiving spatial aspects of sound (e.g., localization and distance away from sound; No Tinnitus Service members had a mean score of 8.4 versus 7.2 for Tinnitus); and (3) distinguishing different qualities of sound such as which instruments are playing when listening to music and clarity of those sounds (not blurred; No Tinnitus Service members had a mean score of 8.1 versus 6.8 for Tinnitus). Although scores among Veterans were slightly poorer than among Service members, differences between the two groups were small.
SSQ Total and Subscales, Mean, Standard Deviation, Range
| Service Members | Veterans | |||
|---|---|---|---|---|
| No Tinnitus (n = 100) | Tinnitus (n = 80)b | No Tinnitus (n = 81)b | Tinnitus (n = 164) | |
| Mean (SD), Range | Mean (SD), Range | Mean (SD), Range | Mean (SD), Range | |
| SSQ total score | 7.9 (1.7), 2–10 | 6.4 (1.8), 2–10a | 7.3 (1.7), 3–10 | 5.8 (1.9) 1–10a |
| SSQ subscale score | ||||
| Speech understanding | 7.5 (2.0), 1–10 | 5.6 (2.1), 1–10a | 6.6 (2.1), 3–10 | 5.2 (2.2), 1–10a |
| Spatial aspects of hearing | 8.4 (1.7), 2–10 | 7.2 (2.0), 1–10a | 7.9 (1.7), 3–10 | 6.5 (2.2), 1–10a |
| Sound quality and naturalness | 8.1 (1.9), 2–10 | 6.8 (1.9), 2–10a | 7.6 (1.7), 3–10 | 6.2 (1.9), 1–10a |
aSignificant difference between Tinnitus groups at p ≤ 0.002 (Bonferroni correction 30/0.05).
bMissing data for one subject.
Tinnitus and Emotional Well-being
Table VIII displays the percentage of Service members and Veterans who experienced anxiety or depression by their tinnitus status. Distributions of participants with normal, mild, or moderate anxiety were significantly different between those with and without tinnitus (p ≤ 0.002). Fifty-two percent of Service members in the Tinnitus group were categorized as having mild (23%) or moderate anxiety (29%) compared to 18% of those in the No Tinnitus group. For Veterans in the Tinnitus group, 57% indicated mild to moderate anxiety compared to 34% of Veterans in the No Tinnitus group. Reports of depression between Tinnitus and No Tinnitus groups were significantly different (p ≤ 0.002) for both Service members and Veterans. For Service members in the Tinnitus group, 21% were classified as having mild to moderate depression vs. 6% for those in the No Tinnitus group. For Veterans in the Tinnitus group, 35% were classified as having mild to moderate depression compared to 12% of those in the No Tinnitus group.
Tinnitus and Emotional Well-Being: Anxiety and Depression Based on the HADS
| Service Members | Veterans | |||
|---|---|---|---|---|
| n = 100 | n = 79b | n = 81c | n = 164 | |
| No tinnitus n (%) | Tinnitusan (%) | No tinnitus n (%) | Tinnitusan (%) | |
| Anxiety | ||||
| Normal anxiety | 82 (82.0) | 38 (48.1) | 54 (66.7) | 71 (43.3) |
| Mild anxiety | 10 (10.0) | 18 (22.8) | 16 (19.8) | 35 (21.3) |
| Moderate anxiety | 8 (8.0) | 23 (29.1) | 11 (13.6) | 58 (35.4) |
| Depression | ||||
| Normal depression | 94 (94.0) | 62 (78.5) | 71 (87.7) | 107 (65.2) |
| Mild depression | 4 (4.0) | 8 (10.1) | 7 (8.6) | 34 (20.7) |
| Moderate depression | 2 (2.0) | 9 (11.4) | 3 (3.7) | 23 (14.0) |
aSignificant difference between Tinnitus groups at p ≤ 0.002 (Bonferroni correction 30/0.05).
bMissing data for two subjects.
cMissing data for one subject.
Tinnitus and Functional Health
Functional health status of participants is shown in Table IX. Service members in the Tinnitus group had a higher mean WHODAS score (18.3, SD = 16.8) than those in the No Tinnitus group (7.3, SD = 10.9). Similar results were observed among Veterans, with a mean score of 23.2 (SD = 18.1) in the Tinnitus group and 13.4 (SD = 14.2) for those in the No Tinnitus group. Differences in mean scores between tinnitus groups were significantly different for both Service members and Veterans (p ≤ 0.002).
Tinnitus and Functional Health Based on WHODAS 2.0
| Service Members | Veterans | |||
|---|---|---|---|---|
| No Tinnitus (n = 100) | Tinnitus (n = 79)b | No Tinnitus (n = 81) | Tinnitus (n = 164) | |
| Mean (SD), Range | Mean (SD), Range | Mean (SD), Range | Mean (SD), Range | |
| WHODAS score | 7.3 (10.9), 0−62 | 18.3 (16.8), 0−94a | 13.4 (14.2), 0−62 | 23.2 (18.1) 0−76a |
aSignificant difference between Tinnitus groups at p ≤ 0.002 (Bonferroni correction 30/0.05).
bMissing data for two subjects.
DISCUSSION
The data presented herein are the first to directly address the question of how tinnitus impacts military Service members’ lives and daily activities. Although these data do not represent the military population as a whole, they do provide important insights. Generalizability is enhanced because data were obtained from Service members and Veterans in two geographic locations. Efforts are currently underway to add enrollment sites to include a greater number of Navy and Marine Corps Service members in the study, which would help to more evenly balance the numbers of participants across military branches.
The data suggest that, for Service members, the presence of tinnitus can have effects on job performance, which may be directly or indirectly caused by effects of tinnitus on concentration, anxiety, depression, and sleep. Briefly, among Service members in the Tinnitus group: (1) Job performance: 27% “had difficulty performing work or other activities” (Table III); (2) Concentration: 21% reported as a moderate to very big problem that tinnitus “kept me from concentrating on reading” (Table IV); (3) Sleep: 59% were “very sleepy, should seek medical advice” vs. 39% of No Tinnitus Service members (Table V); (4) Anxiety: 52% reported mild to moderate anxiety, compared to 18% without tinnitus (Table VIII); and (5) Depression: 22% reported mild to moderate depression compared to 6% of those in the No Tinnitus group (Table VIII).
These data clearly support the need to offer evidence-based clinical tinnitus services for Service members. The majority of DoD Audiology and Otology providers indicated in a recent survey that they desired additional support and education in order to confidently implement evidence-based tinnitus care.38 Addressing this need will require a concerted effort to educate DoD leadership about the problem of tinnitus and to encourage policies that ensure every Service member has access to optimized care. Moreover, Service members would ideally have a seamless transition of care between DoD and VA health care systems, i.e., they would have no interruption of care as they move from being DoD to VA patients.39
Chronic tinnitus is usually a permanent condition and afflicted individuals must learn to manage it for a lifetime. Techniques for teaching tinnitus self-care skills have been developed and documented for efficacy within the Veteran population.40,41 These techniques are part of the more comprehensive program known as Progressive Tinnitus Management (PTM). PTM has been endorsed by the VHA since 2009, and clinical recommendations based on PTM have been developed as a guide for VA clinicians.42 PTM has further been adapted for remote counseling via telephone –“Tele-PTM” has been shown to be effective and offers a potential solution to provide access to evidence-based tinnitus services to all Veterans and Service members regardless of their location.43,44
Study Limitations
Limitations to this study include the relatively small sample sizes and the potential for measurement error and/or reporting bias. Data presented herein were from the first 428 participants in a longitudinal study that is still in the enrollment phase; although a relatively large sample overall, greater enrollment in some of the less prevalent categories (i.e., Service members with tinnitus, n = 81) could influence results. Thus, these results should be considered preliminary until more generalizable data may be reported. Additionally, it is unknown to what extent participants felt comfortable reporting the presence of tinnitus and the impact of tinnitus on their lives. It is known that fitness-for-duty requirements can affect Service members’ willingness to disclose symptomatology, causing them to “reverse malinger” (deny or trivialize symptoms) to maintain their status or obtain special jobs.45,46 Reverse malingering is a particular concern with mental illness47 and hearing loss.48,49 Conversely, Veterans may be incentivized to report tinnitus, a compensable service-connected disability for Veterans that may provide them access to Audiology and other VA services. These factors could have affected the prevalence levels of, or spuriously strengthened the associations between, tinnitus and the symptoms/functional outcomes reported in our data. It is our opinion, however, that such bias, if it did exist, was minimal due to this being a research study for which participants were told as part of the consent process that their responses were completely confidential and would have no bearing on their status with the DoD or the VHA.
From the active-duty population in this study (n = 182), 52 (28%) reported some type of medically-related military occupational specialty (MOS), which might suggest less “noisy” occupations than those that are non-medical. Further, of these 182 active duty participants, 67 (37%) were identified as Army; 5 (3%) as Marines; 14 (7%) as Navy, and 96 (53%) as Air Force. In the active-duty Air Force population (n = 96), 42 (43%) reported some type of medical MOS. However, only 10 medical MOSs were identified in the non-Air Force branches (10/86 = 11%). These data indicate a large “medical” pool represented in the Air Force branch. However, 86 (53%) of the active-duty population were represented by other branches and only 10% of those reported medical MOSs. It is possible the active-duty sample in this study had less noise exposure than what might be expected from typical military service. That can only be conjectured, however, because participants in medical occupations could have had significant noise exposure during deployments.
An additional concern is that people with both hearing problems and tinnitus often blame their tinnitus for their hearing problems. For this reason, we administer the Tinnitus and Hearing Survey (THS), which was developed specifically to parse out these two problems.34 Section A on the THS contains items that ask about the functional effects of tinnitus that would not be confused with a hearing problem. Table IV contains the responses to Section A of the THS collected from participants in the NOISE Study. These results can be interpreted as tinnitus-specific effects, not influenced by hearing problems. Other survey data reported in this article could have been confounded by hearing problems, including the question “How much of a problem is tinnitus?” (Table I), the Tinnitus Functional Index (Table II), and questions pertaining to tinnitus and work performance (Table III).
Need for Tinnitus Care
The intent of the present report was to focus on the impact of tinnitus on military Service members. For comparison purposes, Veteran data were also presented, revealing an increasing impact of tinnitus following military service and hence an even greater need for tinnitus care. Many VA hospitals have begun providing PTM, although protocols at those sites are typically adapted – most commonly by implementing the program without the collaboration of mental health providers.38 Skills education forms the core of PTM intervention, and mental health providers are critical to this phase of tinnitus management.
Gaps in tinnitus care in VA and DoD have been identified in a VA survey conducted by the NCRAR, and in a similar survey conducted by the HCE encompassing both VA and DoD.38 The HCE, NCRAR, and Walter Reed National Military Medical Center are currently collaborating on several initiatives focused on improving tinnitus services for Service members and Veterans, including increased access to VA and DoD mental health services in conjunction with PTM and developing tele-audiology services.
CONCLUSION
These results reveal that, for the preliminary sample of study participants, tinnitus is associated with poorer functioning and health status among military Service members in ways comparable to Veterans who have completed their military service within the previous 2.5 years. These findings suggest that tinnitus should be addressed by healthcare providers in the military as well as the VA in order to maximize functioning and quality of life among our nation’s military personnel.
Previous Presentations
Adapted from a podium presentation at the 2017 Military Health System Research Symposium: “Preliminary Findings of the Multi-Site DoD/VA NOISE Study” (MHSRS abstract #1315–1330).
Funding
This study was funded by the Department of Defense Office of the Congressionally Directed Medical Research Programs (PR121146 and W81XWH-17-1-0020). Dr Henry is funded by a Research Career Scientist Award from VA Rehabilitation Research & Development (RR&D) Service (C9247S). This material is the result of work supported with resources and the use of facilities at the VA RR&D National Center for Rehabilitative Auditory Research (Center Award #C9230C) at the Veterans Affairs (VA) Portland Health Care System in Portland, OR, USA. This supplement was sponsored by the Office of the Secretary of Defense for Health Affairs.
Acknowledgments
The authors acknowledge significant contributions from Jane Gordon, MS and Wendy Helt, MA.
References
Author notes
The views expressed in this paper are those of the authors and do not necessarily represent the official position or policy of the U.S. Government, the Department of Defense, the Department of the Air Force, or the Department of Veterans Affairs.

