


Abstract
Prototype low-intensity threat laser eye protection (LIT-LEP) spectacles were evaluated for US Coast Guard (USCG) cockpits and night vision goggle compatibility. The impetus for interest in aviation LIT-LEP is driven in part by the fact that easily accessible 0.5–2.0 W high-power laser pointers exceed safety standards for direct on-axis viewing. A repeated-measures experimental design was used to assess LIT-LEP performance relative to a no-LEP control for the following tasks: Near- and far contrast acuity, night vision goggle far-contrast acuity, emissive and non-emissive light source color-vision screening, and USCG multifunctional display color symbol discrimination reaction time and accuracy. Near- and far-contrast acuity results demonstrated good LIT-LEP performance for typical in- and out-of-cockpit lighting conditions. Night vision goggle performance suffered marginally at only one contrast level (85%; 20/30 acuity line). Color vision test results showed good color balance in that S-, M-, and L-cone performance did not demonstrate a clinical diagnostic color defect for emissive or non-emissive light sources when wearing LIT-LEP. Color symbol discrimination reaction-time-task results based on inverse efficiency scores revealed that some non-primary flight display colors exhibited a combination of slower speed and decreased accuracy. The findings will contribute to an acquisition decision as well as guide future LEP designs.
INTRODUCTION
The rate of visible-laser cockpit illumination incidents in commercial, military, law enforcement, air ambulance, and general aviation in the continental United States continues to increase. For this reason, there is a critical need for a nighttime cockpit instrumentation-compatible laser eye protection (LEP) countermeasure to mitigate laser veiling-glare effects, especially in rotary-wing aviation operations where slow-moving aircraft are easily targeted. In 2016, 7,442 incidents of aircraft laser illumination were reported to the Federal Aviation Administration (FAA), and 6,753 illumination events were reported for 2017.1 This represents an approximate 25-fold increase in aircrew-reported illumination events compared to CY 2005 (283 events). For the US Navy and Marine Corps, 249 lasing events were reported for FY15-17 and the US Coast Guard (USCG) has reported 159 illumination events between FY11 and FY15.2 Most exposure incidents take place at night utilizing readily available handheld lasers, result in aircraft cockpit illumination, and occur during critical phases of flight such as takeoff or landing.3–5 The resulting visual effects from a cockpit illumination are reduced situational awareness, slower response times, and obscured critical in- and out-of-cockpit information, especially during high-workload phases of flight (e.g., takeoff and approach) at night. Additionally, the majority of illumination events (88–91%) were produced by green lasers,1,4 however, a blue was recently implicated in a clinical diagnosis of retinal injury in a commercial airline pilot.6 A recent review of 21 USAF aircrew visible-laser illumination events7 revealed that, although none produced eye damage the potential to distract or disrupt pilot performance during critical phases of flight should be recognized.
Laser pointers that can exceed safety standards for direct on-axis viewing, class 2, 3R, 3B, and 4 with additional classifications for viewers using optical aids, are available for purchase by the public without restriction (Table I).8 These handheld lasers are capable of producing levels of irradiance far in excess of the 50 nW/cm2 maximum FAA exposure recommendation within a 5 NM radius of airport runway centerlines.5 Non-lethal continuous wave (CW) laser exposures as low as 0.5–5 μW/cm2 can produce veiling glare that obscures a significant portion of an aircraft windscreen and reliably reduces speed and accuracy of responding in aviation-relevant visual tasks during critical phases of flight.9–14
Commercial Off-the-Shelf Hand-held Lasers (Biglasers.com)
| Laser Hazard Ranges (meters) | ||||||
|---|---|---|---|---|---|---|
| Laser (Wavelength) | Power (Watts) | u (1/cm)a | Veiling Glare (m) | Scotoma (m) | NOHDb (m) | ED50c(m) |
| Red (659.4 nm) | 0.685 | 6.41E-07 | 4,933 | 635 | 81 | 26 |
| Blue (442.8 nm) | 1.661 | 9.27E-07 | 9,063 | 1,480 | 197 | 63 |
| Green (530.7 nm) | 0.455 | 8.14E-07 | 4,512 | 593 | 76 | 24 |
| Green (1,064.8 nm) | 0.06057 | 3.79E-07 | NA | NA | 18 | 6 |
| Green (806.1 nm) | 0.0001 | 5.14E-07 | NA | NA | 0 | 0 |
au = atmospheric attenuation coefficient and values were attained from LHAZ for “very clear” conditions.
bNOHD = nominal ocular hazard distance; eye safe viewing distance.
cED50 = eye Damage distance; Distance where probability of retinal damage is 50%.
The design of aviation-compatible LEP that mitigates CW laser threats is a balancing act between desired levels of protection (relative to laser wavelength and power) and preservation of aircrew visual capability (e.g., acuity, color symbol discrimination), especially at night. Holographic, dielectric stack, and dye-based LEP technology solutions have varied in their ability to bridge the protection/visual performance gap. Early investigations of holographic technology LEP showed promise as they produced only minor color-vision degradation; however, haze, cost, and distortion issues prevented the adoption of a holographic filter solution.15,16 Dye-polycarbonate solutions, based on new dye technology, improve visible light transmission and now offer a possible low-cost alternative solution. The purpose of this study was two-fold: (1) evaluate the impact of a new dye-polycarbonate low-intensity threat LEP (LIT-LEP) spectacle on aircrew-relevant visually mediated performance and (2) assess a critical component of cockpit compatibility across three USCG aviation platforms (MH-60T, MH-65D, HC-144A) utilizing the same Rockwell-Collins color multifunction display (MFD) technology currently installed in these platforms. This evaluation was requested by the USCG. The LEP spectacle was designed by the United States Air Force Research Laboratory, Materials and Manufacturing Directorate, Photonic Materials Branch (AFRL/RXAP) as a collaborative effort with the Naval Medical Research Unit Dayton to meet USCG requirements to mitigate the predominant visible and near-IR laser threats.17 While this particular International Traffic in Arms Regulations (ITAR)-restricted prototype was designed specifically for USCG aircraft, this new technology, to include non-ITAR-restricted variants, has the potential to meet commercial/general aviation, air ambulance, and law enforcement aviation laser-safety requirements. Full LIT-LEP technical specifications pertinent to USCG requirements (e.g., optical transmission and density) is a limited-distribution document.
METHODS
This study was conducted under an approved minimal-risk protocol (NAMRUD.2017.0001) in compliance with all applicable Federal regulations governing the protection of human subjects. Participants for this study were recruited from a military installation workforce and included both active duty and civilian personnel. The study population consisted of 24 individuals: 13 male and 11 female. All participants had normal (20/20) or corrected to normal visual acuity through the use of contact lenses, normal color vision, and normal stereopsis. Participants completed the same series of six experimental tasks on two separate occasions: day-one without LEP and day-two with LEP. It was important that participants performed the no-LEP vision tasks in a manner that offered unencumbered familiarization with each task and an opportunity to maximize performance under administration conditions originally used for test validation. This is similar to the real-world operations that the study results will be generalized to. That is, where aviators, (1) develop and maintain flying proficiency without LEP and (2) are expected to fly with LEP periodically while performing well-rehearsed flight tasks. The six-task presentation order was randomized; however, a Latin-Square design was employed to randomize the order of task assignment during the “no-LEP” and “LEP” conditions. As such, the tests were presented in a distinct manner, minimizing the possibility of an effect due to the categorization of position within the hierarchy.
With the exception of Far Contrast and night vision goggle (NVG) Far-Contrast Acuity, all tasks were administered in a room with an ambient (i.e., overhead) light level of 10 (±1) Lux. Ambient light was set and measured at the beginning of each session using a Photo Research Litemate PR-524.
Near Contrast Acuity
Near vision contrast acuity was tested at five levels (100%, 25%, 10%, 5%, and 2.5%) using Early Treatment Diabetic Retinopathy Study (ETDRS) contrast acuity charts (Richmond Products Inc., Adult Near Contrast Test) placed on a Precision Vision Illuminator viewing stand approximately 40 cm from the eye. The chart was illuminated with a 29 W (400 lumens) 2,900 K halogen-bulb light source that provided a level of approximately 85 cd/m2 irradiance measured at the chart surface. Participants were asked to read sequentially smaller lines on each chart until they could no longer discern the line of text from the background. The LogMAR unit from the last line they could completely read, along with any additional letters reported correctly, was recorded by the experimenter (e.g., 0.02 log units per letter or 0.1 log units per line).
Far Contrast Acuity
Participants’ far-vision contrast acuity was measured separately for six levels of contrast (100%, 25%, 10%, 5%, 2.5%, and 1.25%) using various size black Tumbling “E” EDTRS optotypes presented on a back-illuminated white background (Precision Vision Model 2425 Chart Illuminator) viewed a distance of 4 m. The chart illuminator was the only source of room lighting. Subjects were asked to determine the direction of the “legs” of the E (up, down, left, or right) on sequentially smaller instances of the letter until they could no longer distinguish the placement direction; the LogMAR unit of that line was recorded along with any additional letters reported as correct (e.g., 0.02 log units per letter or 0.1 log units per line).
Night Vision Goggle Far-Contrast Acuity
During the NVG contrast-acuity test, two levels of NVG Michelson contrast (85% and 33%) were evaluated using various acuity size black Tumbling “E” optotypes on a white background viewed at a distance of 4 m. Night Vision Goggle contrast was derived for targets displayed on the NVG’s green-phosphor screen and imaged with the diopter lens (closest to the eye). These EDTRS Tumbling “E” charts were forward-illuminated using a single-LED starlight/moonlight 850 nm illuminant (AFRL, Wright-Patterson AFB, OH) placed 15 ft. from the acuity chart. Participants completed the test at a 4 m viewing distance with a USCG issued AN/AVS-9 Class B NVG (model F4949/5855-01-HS1-7466 with light interference filter). Participants were asked to determine the direction of the “legs” of the E in the same manner as above for far contrast acuity.
Waggoner Computerized Color Vision Test
Color vision was tested using the Waggoner Computerized Color Vision Test (CCVT), which is a computerized method for examining color deficiency.18 The Waggoner CCVT has 25 pseudo-isochromatic screening plates for red-green deficiency. The test has additional plates for specifying and grading protan and deutan (32 plates), and tritan (12 plates) deficiency. Participants were seated at a distance of 91 cm from a Hewlett Packard EliteBook 8570p laptop computer display. A Datacolor Spyder3Express colorimeter was used to maintain the CCVT’s color-reference standard. This test required participants to choose a multiple choice response indicating what number they saw on each color plate, which appeared on the screen for 2 seconds per plate. All designs were of the “vanishing” type, which is, the number cannot be seen by color-deficient observers of a particular type but is seen by all other types of observers.
Farnsworth-Munsell 100 Hue
The Farnsworth-Munsell 100 Hue Test was viewed under an illumination hood (Judge/QC, x-Rite Incorporated, Grand Rapids, MI) using a calibrated 1250 lux CIE D65 (6,500 K) illuminant. The Farnsworth-Munsell 100 Hue Test is a non-emissive test of color discrimination. Four trays of colored caps were given to the participant, in a counter-balanced method, with the instruction to arrange the caps within each tray to form a regular color series beginning and ending with anchor caps affixed to each end of the tray. Caps in each tray were arranged with a single tray-specific random order before viewing. Participants were timed and asked to complete each tray within 2 minutes and provided a 1-minute break between trays. The order of the caps was recorded and analyzed for both the number of instances where a cap was misplaced and the severity (distance from its intended position) of each displacement.
Color Symbol Discrimination Reaction Time Task
The color symbol discrimination task was a computerized measure of emissive-light color symbol discrimination. It tested participnats' ability to discriminate between all possible pair-wise combinations of nine color symbols (Fig. 1) that were selected by the USCG to represent the most critical/common aircraft MFD color symbols. Participants were asked to scan an Rockwell-Collins (Model 268C3) aircraft MFD containing pairs of rectangular colored icons appearing in four fixed locations on a black display background. The four locations were defined as the cardinal compass headings (0, 90, 180, 270 deg) tangent to a circle of 32.5 mm radius. Icon pairs were separated by 2.6 mm of black space. Three of the four pairs of icons were comprised of matching colors, while the remaining pair was a mismatched set. Each color symbol was 3.91 mm high and 1.4 mm wide, subtending a visual angle of 0.28 and 0.1 deg, respectively. The eye-to-MFD distance was fixed at 80 cm. Participants were instructed to indicate the location of the mismatched pair of icons as quickly and accurately as possible by pressing a corresponding button on a hand-held numeric keypad (Lenovo KU-9880). A trial was initiated (reaction start time) by pressing and holding the 5-key on the keypad. Appearance of the 4 pairs of color symbol stimuli was preceded by a random 2–4 s inter-stimulus interval. Participants kept the 5-key pressed while they searched the display and then, using the same finger, released the 5-key and pressed one of four numeric keys (8, 6, 2, or 4 corresponding to a 0, 90, 180, or 270 deg. compass heading, respectively) to indicate the location of the mismatched color symbol pair (reaction end time). Both speed and accuracy of responding were measured for 432 color symbol discrimination trials. Trial order was randomized with the constraint that no two consecutive trials contained a mismatched target pair in the same quadrant, and each of the 36 mismatched color symbol pairs occurred three times at each of the four target locations for a total of 12 presentations. Additionally, each color pair was randomly presented equally in two orders, color A on the left paired with color B on the right, and the reverse. Data collection was preceded by five short 12-trial color symbol discrimination practice sessions that produced an asymptotic baseline.
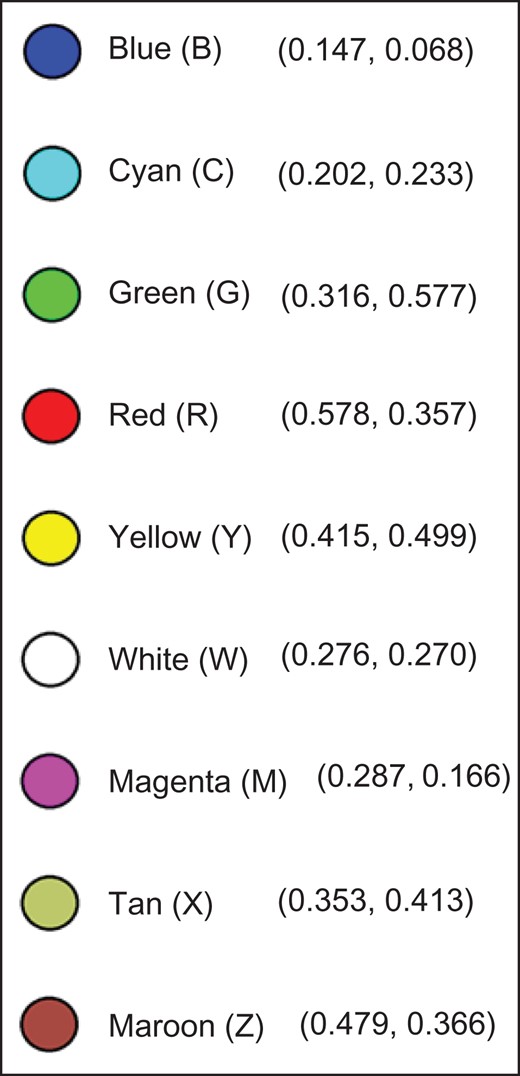
Color symbol discrimination reaction time task colors and 1931 CIE x,y coordinates.
RESULTS
All hypotheses tested bore on detecting a reliable difference between the no-LEP and LEP condition at each level of each independent variable. No other tests were considered (i.e., between level effects and interactions) because they did not bear on LEP performance characteristics that address safety of flight risk. For example, a test to determine if LEP wear reliably reduced the ability to distinguish red and yellow symbols (warning and caution light colors) helps identify a flight risk. However, tests to assess the magnitude of LEP effects between color pairs would not reveal a potential hazard or an experimental effect of interest. Thus, one- and two-tailed paired sample t-tests were used to test for a reliable LEP effect for each level of each independent variable. This was deemed the most sensitive test (possibly erring toward a type I error) to reveal “potential” flight risks not to be overlooked in follow-on LIT-LEP flight evaluations. In all cases, the null hypothesis was that the no-LEP and LEP conditions produced reliably equal visually mediated performance. The alternate hypothesis for one-tailed tests was that LEP wear would produce detrimental effects in visually mediated performance relative to a no-LEP control. The alternate hypothesis for two-tailed tests was that LEP wear would produce either an improvement or detriment in visually mediated performance relative to a no-LEP control.
Near Contrast Acuity
Each contrast level tested is presented in Table II. Using LogMAR allows for each letter to be scored individually (e.g., 0.02 log units per letter or 0.1 log units per line). A negative difference score indicates letters missed in the LEP vs. no-LEP condition. At 100% and 25% contrast, there was less-than-or-equal-to one letter missed between the conditions. A one-tailed paired samples t-test indicated no statistical difference (p = 0.379 and p = 0.122, respectively) for these two conditions. That is, participants were able to achieve 20/20 acuity at 100% and 25% contrast in the no-LEP and LEP conditions. Lower contrast levels of 10%, 5%, and 2.5% showed a statistically significant difference of 1, 2, and 3 letters missed in the LEP condition compared to the respective no-LEP condition (p = 0.0178 at 10%; p = 0.0208 at 5%; p = 0.00332 at 2.5%).
Near Contrast Acuity Summary
| Contrast Level (%) | Average LogMAR Difference | # of Letters Missed | Chart Line | t-Value | DF | p-Value (One-Tailed)** |
|---|---|---|---|---|---|---|
| 100 | 0.0075 | 0 | 0.309 | 46 | 0.379 | |
| 25 | −0.0233 | 0 | −1.181 | 46 | 0.122 | |
| 10 | −0.0375 | 1 | 20/25 | −2.166 | 46 | 0.0178 |
| 5 | −0.0417 | 2 | 20/32 | −2.096 | 46 | 0.0208* |
| 2.5 | −0.0633 | 3 | 20/40 | −0.0633 | 46 | 0.00332* |
*p < 0.05.
**Paired samples t-test.
Specifically, at lower contrast levels, acuity decreased and missed letters in the LEP condition were on the following lines: 20/25 at 10%, 20/32 at 5%, and 20/40 at 2.5%.
Far Contrast Acuity
Far contrast acuity was measured at six different levels, as presented in Table III. A one-tailed paired samples t-test did not reveal a significant difference in contrast acuity until 1.25%, where the LEP condition demonstrated a loss of three letters (p = 0.0210) on the 20/60 line.
Far Contrast Acuity Summary
| Contrast Level (%) | Average LogMAR Difference | # of Letters Missed | Chart Line | t-Value | DF | p-Value (One-Tailed)** |
|---|---|---|---|---|---|---|
| 100 | 0.0133 | 0 | 0.485 | 46 | 0.315 | |
| 25 | −0.0008 | 0 | −0.0326 | 46 | 0.487 | |
| 10 | −0.005 | 0 | −0.172 | 46 | 0.432 | |
| 5 | −0.0267 | 0 | −1.046 | 46 | 0.150 | |
| 2.5 | −0.367 | 0 | −1.413 | 46 | 0.0822 | |
| 1.25 | −0.0667 | 3 | 20/60 | −2.093 | 46 | 0.0210* |
*p < 0.05.
**Paired samples t-test.
NVG Far-Contrast Acuity
Current NVG technology uses a green phosphor to generate an image of the real world. As a result, actual contrast levels differ from the real world and mask subtle changes in contrast that often help distinguish objects of interest from background clutter. With this understanding, only two contrast levels were tested, 100% and 25%. Measured contrast through the NVGs equated to 85% and 33%, respectively, at the eye. Each contrast was tested under ¼ moon + starlight illumination and starlight only (Table IV). These two light settings represent an ideal and worse-case illumination scenario. Using a one-tailed paired samples t-test, the only significant difference between the no-LEP and LEP conditions was for ¼ moon + starlight illumination at 85% contrast. This difference was one letter missed on the 20/30 line while wearing LEP (p = 0.0479).
NVG Far Contrast Acuity Summary
| Light Level | Contrast Level (%) | Average LogMAR Difference | # of Missed Letters | Chart Line | t-Value | DF | p-Value (One-Tailed)** |
|---|---|---|---|---|---|---|---|
| ¼ Moon + Starlight | 85 | −0.0383 | 1 | 20/30 | −0.0383 | 46 | 0.0479* |
| 33 | 0.0183 | 0 | 0.673 | 46 | 0.252 | ||
| Starlight Only | 85 | −0.00167 | 0 | −0.0701 | 46 | 0.472 | |
| 33 | 0.00167 | 0 | 0.0694 | 46 | 0.472 |
*p < 0.05.
**Paired samples t-test.
Waggoner CCVT
Table V presents the results from each test condition. Participant total test time differed by 4.25 seconds, with a faster time in the LEP condition. A two-tailed paired samples t-test did not reveal a statistically significant difference (p = 0.448). Out of the 25 Deutan/Protan (green/red error) plates that were presented, there was no reliable difference between the two conditions in correct responses (p = 0.093). A two-tailed paired samples t-test exposed a significant difference in the Tritan (blue error) test section. The LEP condition averaged 10.4/12 correct plates, and the no LEP condition averaged 11.4/12 (p = 0.001) correct plates. It is important to note that this did not meet a diagnostic criteria for a tritanomalous color defect.
Waggoner Computerized Color Vision Test Summary
| Test Duration | Deutan Plates Presented | Deutan Correct | Tritan Plates Presented | Tritan Correct | |
|---|---|---|---|---|---|
| With LEP | 164.25 (sec) | 25 | 24.9 | 12 | 10.4 |
| No LEP | 168.5 (sec) | 25 | 24.5 | 12 | 11.4 |
| Difference | −4.25 (sec) | 0 plates | 1 plate | ||
| p-Value (Two-Tailed) | 0.448 | 0.093 | 0.001 | ||
| t | 0.76 | −1.71 | 3.63 | ||
| df | 46 | 46 | 46 |
Farnsworth-Munsell 100 Hue
Figure 2 is a polar plot of all 85 FM-100 caps through CIE 1931 color space. Error values for the magnitude of displacement were averaged for each cap and compared between the LEP and no-LEP conditions. The greatest difference in cap placement occurred in caps 23–34 (yellow–green) and 46–59 (blue). On average, each cap error was less than or equal to five error points, where a swap of one position would be two error points. This indicates that cap errors were of low magnitude and not indicative of a diagnostic color defect. Table VI lists each cap-average error and standard error of the mean.
Farnsworth-Munsell 100-Hue Average Error Score and Standard Error of the Mean
| Cap Number | Without LEP Avg Error Score | With LEP Avg Error Score | Without LEP SEM | With LEP SEM |
|---|---|---|---|---|
| 85 | 2.25 | 2.75 | 0.11 | 0.19 |
| 1 | 2.25 | 2.75 | 0.11 | 0.16 |
| 2 | 2.38 | 3.00 | 0.13 | 0.23 |
| 3 | 2.38 | 3.25 | 0.16 | 0.23 |
| 4 | 2.38 | 2.83 | 0.21 | 0.20 |
| 5 | 2.21 | 2.67 | 0.10 | 0.20 |
| 6 | 2.13 | 2.58 | 0.07 | 0.18 |
| 7 | 2.21 | 2.83 | 0.10 | 0.29 |
| 8 | 2.17 | 3.08 | 0.08 | 0.32 |
| 9 | 2.38 | 2.79 | 0.18 | 0.18 |
| 10 | 2.42 | 2.54 | 0.21 | 0.13 |
| 11 | 2.33 | 2.54 | 0.10 | 0.15 |
| 12 | 2.42 | 2.58 | 0.15 | 0.19 |
| 13 | 2.63 | 2.58 | 0.23 | 0.13 |
| 14 | 2.58 | 2.58 | 0.20 | 0.13 |
| 15 | 2.29 | 2.50 | 0.11 | 0.12 |
| 16 | 2.25 | 2.38 | 0.09 | 0.12 |
| 17 | 2.29 | 2.21 | 0.15 | 0.13 |
| 18 | 2.54 | 2.71 | 0.17 | 0.20 |
| 19 | 2.42 | 2.58 | 0.12 | 0.15 |
| 20 | 2.38 | 2.46 | 0.12 | 0.10 |
| 21 | 2.58 | 2.50 | 0.17 | 0.12 |
| 22 | 2.08 | 3.33 | 0.06 | 0.22 |
| 23 | 2.17 | 3.00 | 0.10 | 0.23 |
| 24 | 2.21 | 3.42 | 0.10 | 0.30 |
| 25 | 2.17 | 3.71 | 0.08 | 0.29 |
| 26 | 2.42 | 3.33 | 0.17 | 0.26 |
| 27 | 2.63 | 3.58 | 0.19 | 0.29 |
| 28 | 2.63 | 3.54 | 0.19 | 0.35 |
| 29 | 2.67 | 3.58 | 0.18 | 0.45 |
| 30 | 2.54 | 4.13 | 0.17 | 0.48 |
| 31 | 2.33 | 4.08 | 0.21 | 0.58 |
| 32 | 2.29 | 3.21 | 0.14 | 0.36 |
| 33 | 2.25 | 2.58 | 0.11 | 0.15 |
| 34 | 2.54 | 2.75 | 0.20 | 0.18 |
| 35 | 2.54 | 2.58 | 0.20 | 0.12 |
| 36 | 2.29 | 2.54 | 0.11 | 0.17 |
| 37 | 2.54 | 2.79 | 0.26 | 0.21 |
| 38 | 2.67 | 2.71 | 0.32 | 0.14 |
| 39 | 2.71 | 2.63 | 0.20 | 0.17 |
| 40 | 2.88 | 2.96 | 0.20 | 0.24 |
| 41 | 2.79 | 2.83 | 0.19 | 0.21 |
| 42 | 2.88 | 2.75 | 0.18 | 0.21 |
| 43 | 2.33 | 2.46 | 0.16 | 0.17 |
| 44 | 2.33 | 3.00 | 0.12 | 0.18 |
| 45 | 2.67 | 2.96 | 0.26 | 0.18 |
| 46 | 2.63 | 4.29 | 0.26 | 0.36 |
| 47 | 2.46 | 4.75 | 0.23 | 0.37 |
| 48 | 2.29 | 3.38 | 0.14 | 0.29 |
| 49 | 2.42 | 4.54 | 0.19 | 0.32 |
| 50 | 2.42 | 4.83 | 0.17 | 0.45 |
| 51 | 2.21 | 4.75 | 0.08 | 0.33 |
| 52 | 2.25 | 4.33 | 0.09 | 0.26 |
| 53 | 2.29 | 3.54 | 0.14 | 0.30 |
| 54 | 2.50 | 3.88 | 0.24 | 0.20 |
| 55 | 2.29 | 2.88 | 0.12 | 0.19 |
| 56 | 2.21 | 2.67 | 0.10 | 0.12 |
| 57 | 2.54 | 3.29 | 0.24 | 0.27 |
| 58 | 2.58 | 3.29 | 0.20 | 0.30 |
| 59 | 2.58 | 2.63 | 0.22 | 0.16 |
| 60 | 2.63 | 2.54 | 0.23 | 0.15 |
| 61 | 2.38 | 2.67 | 0.12 | 0.17 |
| 62 | 2.33 | 2.29 | 0.14 | 0.11 |
| 63 | 2.25 | 2.21 | 0.14 | 0.08 |
| 64 | 2.21 | 2.21 | 0.08 | 0.08 |
| 65 | 2.33 | 2.29 | 0.13 | 0.09 |
| 66 | 2.33 | 2.33 | 0.13 | 0.10 |
| 67 | 2.29 | 2.42 | 0.11 | 0.12 |
| 68 | 2.58 | 2.38 | 0.23 | 0.22 |
| 69 | 2.50 | 2.29 | 0.18 | 0.18 |
| 70 | 2.42 | 2.08 | 0.15 | 0.06 |
| 71 | 2.50 | 2.50 | 0.15 | 0.12 |
| 72 | 2.17 | 2.50 | 0.08 | 0.12 |
| 73 | 2.13 | 2.46 | 0.70 | 0.12 |
| 74 | 2.29 | 2.71 | 0.13 | 0.11 |
| 75 | 2.17 | 2.42 | 0.08 | 0.12 |
| 76 | 2.21 | 2.63 | 0.08 | 0.13 |
| 77 | 2.46 | 2.67 | 0.17 | 0.14 |
| 78 | 2.38 | 2.50 | 0.15 | 0.14 |
| 79 | 2.33 | 2.75 | 0.10 | 0.28 |
| 80 | 2.38 | 2.67 | 0.12 | 0.26 |
| 81 | 2.38 | 3.00 | 0.15 | 0.26 |
| 82 | 2.42 | 3.13 | 0.13 | 0.23 |
| 83 | 2.29 | 2.75 | 0.11 | 0.15 |
| 84 | 2.29 | 3.04 | 0.11 | 0.22 |
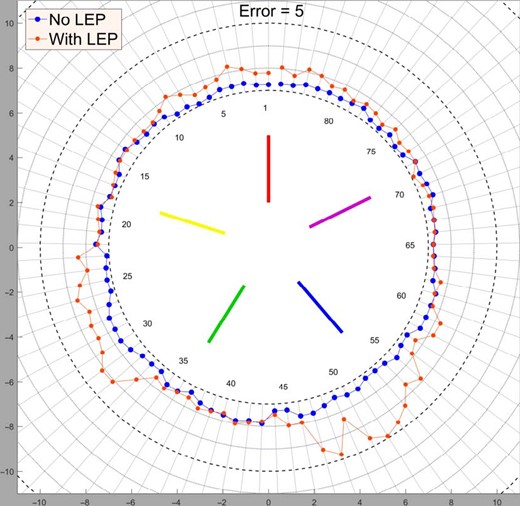
Farnsworth-Munsell 100-Hue color vision test.
Color Symbol Discrimination Reaction Time Task
Following a procedure outlined by Townsend and Ashby, participants’ response times were combined with the proportion of accurate responses in such a way to create an Inverse Efficiency Score [IES = Response Time /(1 – percent error)], which was subsequently tested for significance by means of two-tailed paired samples t-tests.19 As an asymptote equality check, a two-tailed paired samples t-test was performed on the mean values of the fifth (last) practice trial for the two task conditions to determine if any pre-test differences were present. No significant differences were found between the LEP and no-LEP conditions, t(23) = −0.99, p > 0.33. Thus, subsequent experiment-based differences found on this test cannot be attributed to initial sampling artifacts in the group composites.
Participants’ ability to quickly and correctly discern color pairs was altered in both directions, as speed and accuracy were found to be significantly faster and more easily distinguished in some cases while wearing the LEP spectacles, as seen on the left side of Figure 3 and represented by negative values. In other instances, responses were slower and less accurate, as seen on the right side of Figure 3 and represented by the positive values. Six of 36 color pairs were found to be significantly faster and more accurately discriminated (p < 0.05) when wearing the LEP spectacles: yellow/green (a common color pairing in avionic displays), white/cyan, magenta/cyan, blue/cyan, magenta/blue, white/blue. Of the remaining 30 pairs, 10 pairs were found to be significantly slower and more difficult to discern (p < 0.05): yellow/cyan, tan/red, white/green, white/red, red/yellow (a common color paring in avionic displays), magenta/red, white/yellow, tan/green, maroon/red, and tan/yellow. Reliable differences in color symbol discrimination were not observed for the remaining color pair combinations.
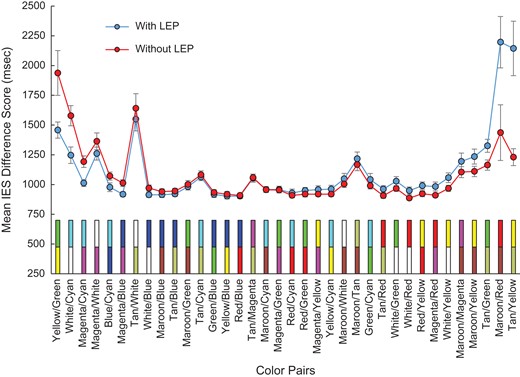
Mean inverse efficiency scores with and without LEP.
Figure 4 shows that without LEP spectacles, yellow/green pairs were more difficult to distinguish with an average response time of 1,250 ms and 73% accuracy. With the exception of white/cyan and tan/white, at 79% accuracy each, all other color pairings demonstrated greater than 85% accuracy and an approximate 1 s response time. While wearing the LEP, the poorest accuracy was found to be 72% for tan/yellow with a response time of 1,450 ms (Fig. 5). Other pairs with less than 85% accuracy while wearing the LEP were green/yellow (83%), tan/white (84%), maroon/red (69%), and tan/yellow (72%). Interestingly, the LEP improved green/yellow accuracy and reaction time when compared to the no-LEP condition. Again, similar to the no-LEP condition, reaction times were approximately 1.0 s for the majority of color pairs.

Mean color symbol discrimination reaction time without LEP.
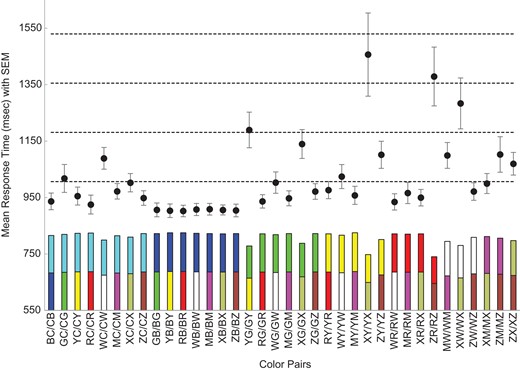
Mean color symbol discrimination reaction time with LEP.
DISCUSSION
Although it would be more informative to present the results of this study within the context of the LIT-LEP technical specification (e.g., optical transmission and optical density) and USCG laser-threat mitigation requirements, it is still possible to draw meaningful conclusions that advise follow-on flight testing and speak to the viability of a low-cost dye-polycarbonate LEP solution for mitigating laser veiling glare.
First, near- and far-contrast acuity demonstrates good LIT-LEP performance for most in- and out-of-cockpit lighting conditions. It is unlikely that cockpit lighting will produce less than 25% contrast levels where reliable LEP acuity deficits were observed. Far-contrast acuity effects were only observed at the 1.25% contrast level. This would be a rare, but not totally unlikely, contrast level for out-of-cockpit target acquisition, but it does suggest that operationally relevant extremely low-contrast information acquisition should be evaluated in follow-on flight testing. NVG performance suffered marginally at best during LEP wear, and for only one contrast level (85%) in the zone of best-possible NVG performance (20/30 acuity). This speaks well to the LIT-LEP dye formulation that, by design, will reduce NVG illumination of the retina to some extent, due to its visible-laser threat mitigation properties.
Color vision test results bear on diagnostic color vision (CCVT, Munsell 100-Hue), and color-vision mediated visual performance. Low-intensity threat LEP was designed to differentially reduce the transmission of certain portions of the visible electromagnetic spectrum. The design appears to be well balanced however, in that S-, M-, and L-cone performance was not degraded to the extent that a clinical diagnostic color defect was induced. That is, color vision with LEP passed Naval Aviation color vision standards. None-the-less the CCVT results showed a marginal decrement in S-cone (blue) performance for an emissive light source, and the Munsell 100-Hue showed a marginal LEP-induced increase in error scores for blue hues. As a result, both emissive blue light sources, such as taxiway lighting, and non-emissive blue light sources should be considered for evaluation in follow-on flight testing. The color symbol discrimination reaction time task evaluated USCG aviation-platform operationally relevant emissive cockpit lighting. When considering IES scores that weight speed and accuracy of performance, only two color symbol pairs showed a concerning combination of slower speed and decrease accuracy: maroon/red and tan/yellow. These color are most likely to appear in close proximity to one another in moving map displays, and less likely to occur in close proximity in primary flight displays. Interestingly, the improvement noted in speed and accuracy of green/yellow discrimination was also observed by instructor pilots during follow-on HC-144A, MH-60T, and MH-65D LIT-LEP flight simulator and ground evaluations.
The findings of this study are only one part of a comprehensive assessment that includes requirements development, material RDT&E, prototype production, laboratory psychophysical testing, flight simulator and ground evaluation, and flight testing.
CONCLUSIONS
Unfortunately, study results cannot be summarized within the context of USCG LIT-LEP requirements or LIT-LEP design and performance specifications due to their limited distribution classifications; a combination of ITAR, Distribution-D, and classified. This does not preclude helpful observations that might advise, in part, other aviation communities that are evaluating LEP technology. Requests for limited distribution documents will be forwarded to the appropriate action officers for consideration of release to DoD agencies as appropriate.
LIT-LEP acuity tests demonstrated that LIT-LEP performance, in a range of expected ambient light and contrast conditions is acceptable. This result is indicative of sufficient photopic luminance transmission (PLT). Additionally, performance of the green-phosphor AN/AVS-9 NVG exceeded expectations given the LIT-LEP design focus to mitigate performance decrements associated with green laser illumination events. Color vision and color symbol discrimination speed-accuracy trade-off results demonstrated a good balance between optical density, PLT, color balance, and human performance. The LIT-LEP solution evaluated here did not induce a clinically-defined color defect in any participant, however, it should be noted that mild color defectives were not evaluated. The impact of this LIT-LEP solution should be evaluated for its impact on a representative sample of the mild color defect aviator population before considering use by aviators flying with a mild color-vision defect.
In a subsequent study, USCG instructor pilots evaluated LIT-LEP in flight simulators at the USCG Aviation Training Center, Mobile, AL.20 These evaluations also included airport, and obstruction lighting assessments. Additionally, informal ground-powered LIT-LEP evaluations were conducted by senior USCG pilots. The favorable results of these practical evaluations, combined with the LIT-LEP psychophysics study results led to a USCG decision to conduct flight testing ahead of a final acquisition decision in FY19.
Presentations
Presented as a poster at the 2017 Military Health System Research Symposium.
Funding
This work was supported by the Office of the Assistant Secretary of Defense for Health Affairs and the Defense Health Agency J9, Research and Development Directorate, through the Defense Health Program 6.7 Program (Proposal No. D6.7 15 C2 I 15 J9 1191). Opinions, interpretations, conclusions and recommendations are those of the author and are not necessarily endorsed by the Department of Defense. This supplement was sponsored by the Office of the Secretary of Defense for Health Affairs.
Acknowledgments
We would like to thank CWO3 Timothy Tower and Mr. Sean Fuller of the USCG Aviation Logistics Center, Engineering Support Branch, Elizabeth City, NC for exceptional avionics technical assistance and logistics support.
References
LaserPointerSafety.com. Laser/aircraft incident statistics. Available at http://www.laserpointersafety.com/latest-stats/latest-stats.html; accessed December 13, 2017.
United States Coast Guard/Office of Aviation Forces. Laser eye protection-requirements. Available at https://www.dco.uscg.mil/Contact-Us/Contact-an-Operations-Office/; accessed July 3, 2018.
Waggoner CCVT. Testing Color Vision. Irvine, CA, 2013. Available at http://www.testingcolorvision.com; accessed May 31, 2018.
Author notes
The views expressed in this paper are those of the authors and do not necessarily represent the official position or policy of the U.S. Government, the Department of Defense, or the Department of the Navy.

