


Abstract
Faecal-oral transmission refers to the process whereby disease is transmitted via the faeces of an infected individual to the mouth of a susceptible individual. This transmission can occur through failures in sanitation systems leading to exposure via various routes in particular contaminated water, food, and hands. Travellers’ diarrhoea is the most common travel-related illness. A score could enhance risk assessment and pre-travel advice.
A simple score was developed based on the frequency of defecating in the open (country prevalence > 1%), occurrence of cholera in the period between 2021 and 2017 (one or more case in a country) and reported typhoid fever cases between 2015 and 2019.
Data were available for 199 out of 214 countries for the score to be applied. 19% of the 199 countries scored as high risk countries for faecal-oral transmission (score 3), 47% as medium risk (score 2), and 34% as minimal risk (score 0). The percentage of countries scoring 3 was highest in Africa (63%) and lowest in Europe and Oceania (score 0).
A global risk map was developed based on a simple score that could aid travel medicine providers in providing pre-travel risk assessment. For travellers to high and medium risk countries, pre-travel consultation must include detailed advice on food and water hygiene.
Introduction
Pathogens
About 18 feco–oral agents are priority pathogens, including hepatitis A and E viruses, norovirus, rotavirus, Escherichia coli, Campylobacter, Salmonella enterica serotypes Typhi (S. Typhi) and Paratyphi (SP), Vibrio cholerae O1/O139 and the parasites Cryptosporidium and Cyclospora.1–4 Of these, because of the close association with sanitation, S. Typhi/SP and V. cholerae are surrogates of water- and food-borne risks of gastrointestinal infection.5,6 In 2017, typhoid and paratyphoid fevers occurred in some 14 million cases (76% S. Typhi, 24% SP, aggregated rate 198/105).7 As many as 223 370 cholera cases were recorded in 2021, of which 4159 (1.9%) were fatal. Overall, 35 countries reported at least one case of cholera while 55 countries reported no case in the same year.8
Sanitation
In essence, good sanitation is the safe and sustained disposal of human excretions. The criteria of ‘basic’ or ‘improved’ sanitation are debated; definitions by UNICEF are summarized in Table S1 (supplement). In 2020, 494 million (6%) people worldwide relied on defecation in the open (15% in 2010, 25% in 1990) (https://apps.who.int/iris/handle/10665/345081 and previous issues). Unsafe sanitation and contaminated drinking water supplies call for public health interventions.
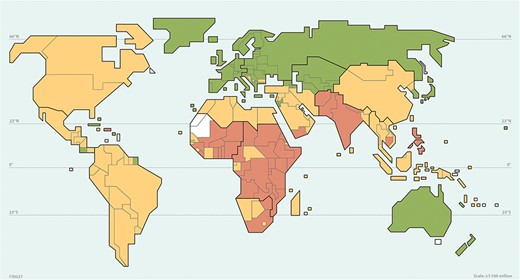
Map. Risk of faecal–oral transmission, scored from open defecation, domestic cholera and endemic typhoid in 199 countries: high (red, for Score 3), moderate (yellow, for Score 1 or 2) or minimal (green, for Score 0)
Travel
Diarrhoea affects some 10 to 20% (range 5–45%) of adult and paediatric travellers.2,9,10 Main pathogens causing traveller’s diarrhoea are viruses such as norovirus and bacteria such as enterotoxigenic E. coli, either alone or mixed.2,3,10–14 By contrast, S. Typhi and V. cholerae are less frequent or declining causes of traveller’s diarrhoea.6,15,16 Pretravel leaflets often include precautions regarding the consumption of water, beverages and other foods. Vaccines are available for S. Typhi (conjugate, polysaccharide Vi or live Ty21a) and V. cholerae (oral), although vaccination certificates are not required for entry into a country (wwwnc.cdc.gov/travel/page/yellowbook-home-2020). Therefore, overseas travellers, expatriates and residents in endemic areas would benefit from an easy, evidence-based, educational tool that summarizes the risk of faecal–oral transmission in a country. This work aims to propose such a tool by proposing a global score.
Materials and methods
Data retrieval
Sanitation data were extracted from https://apps.who.int/iris/handle/10665/345081. Cholera case estimations were based on notifications to WHO,8 also taking into account reports by WHO, Ministries of Health (MoH), and V. cholerae infections cited in references and www.infective-continents.ch.
Incidence of enteric fever (caused by S. Typhi or SP) was based on estimates for 20177 and reports by MoH (notifications), while the frequency of S. Typhi or SP isolates or outbreaks was estimated based on cited references and www.infective-continents.ch. Imported cases were excluded if known (marked ‘i’ in Tables 1–4 and Supplementary Table S2). All other cases were considered domestic (that is, acquired locally).
Risks from defecation, domestic cholera and Salmonella Typhi/Paratyphi—Africaa
| Country | % defecating in the open ≤2020 | Notified domestic cholera, 2021–20–19–18–17 | S. Typhi/Paratyphi ≥2015 or typhoid cases, 2019–18–17–16–15 (rate/105) | Faecal score |
|---|---|---|---|---|
| North | ||||
| Algeria | <1 | nk-nk-0-291-nk | 29 350(24) in 2017 | 2 |
| Canary Islands (Spain) | <1 | nk | (<0.1) | 0 |
| Egypt | <1 | 0-nk-nk-nk-0 | 24 276(23) in 2017 | 1 |
| Libya | <1 | 0-nk-0-nk-0 | 1442(21) in 2017 | 1 |
| Madeira (Portugal) | <1 | nk | (<0.1) | 0 |
| Morocco | 2 | 0-nk-0-nk-0 | 12 454(35) in 2017 | 2 |
| Tunisia | <1 | 0-nk-nk-0-nk | 3267(31) in 2017 | 1 |
| West | ||||
| Benin | 52 | 1298-232-50-0-11 | 19 748(136) in 2017 | 3 |
| Burkina Faso | 40 | 1(&2i)-risk-0-0-nk | 130 095(492) in 2017 | 3 |
| Cabo Verde | 14 | nk-nk-nk-0-nk | 318(57) in 2017 | 2 |
| Côte d’Ivoire | 25 | 0(&12i)-risk-nk-nk-nk | 29 788(99) in 2017 | 2 |
| Gambia | <1 | nk | 2598(100) in 2017 | 1 |
| Ghana | 18 | 2-risk-1-nk-0 | Fever,19 79 100(228) in 2017 | 3 |
| Guinea | 12 | risk-risk-0-nk-nk | 19 058(129) in 2017 | 3 |
| Guinea-Bissau | 10 | 0-risk-nk-nk-nk | 677(30) in 2017 | 2 |
| Liberia | 38 | 167-risk-nk-2-0 | 8658(152) in 2017 | 3 |
| Mali | 5 | 12-risk-0-0-0 | 36 841(143) in 2017 | 3 |
| Mauritania | 31 | nk-nk-nk-0-nk | 4494(95) in 2017 | 2 |
| Niger | 68 | 5188(&403i)-risk-0-3900-nk | 37 967(134) in 2017 | 3 |
| Nigeria | 19 | 111 062-596-2486-45 037-12 174 | 376 103(147) in 2017 | 3 |
| Senegal | 11 | 0-0-nk-nk-nk | 13 824(78) in 2017 | 2 |
| Sierra Leone | 16 | 0-0-0-nk-0 | 15 030(158) in 2017 | 2 |
| Togo | 45 | 40-67-0-nk-nk | 13 950(156) in 2017 | 3 |
| Centre and East | ||||
| Angola | 18 | 0-risk-nk-1546-828 | 27 140(76) in 2017 | 3 |
| Burundi | 3 | 11-277-1145-92-399 | 26 326(194) in 2017 | 3 |
| Cameroon | 6 | 728-1890-1840-1052-nk | 44 787(131) in 2017 | 3 |
| Central African Rep. | 25 | 0-nk-nk-0-0 | 4914(89) in 2017 | 2 |
| Chad | 64 | 0-0-nk-0-1266 | 32 836(164) in 2017 | 3 |
| Comoros | <1 | 0-nk-0-nk-nk | 851(106) in 2017 | 1 |
| Congo | 8 | 0-risk-nk-60-nk | 3114(56) in 2017 | 3 |
| Congo Democratic Rep. | 12 | 12 103-19 789-30 304-30 768-56 190 | 85 891(86) in 2017 | 3 |
| Djibouti | 16 | 0-0-0-nk-nk | 1548(128) in 2017 | 2 |
| Eritrea | 67 | risk-0-nk-nk-nk | 10 446(148) in 2017 | 3 |
| Equatorial Guinea | 3 | nk | 807(48) in 2017 | 2 |
| Ethiopia | 17 | 674-12 226-2615-nk-nk | 208 603(163) in 2017 | 3 |
| Gabon | 2 | 0-nk-nk-nk-nk | 579(31) in 2017 | 2 |
| Kenya | 9 | 38-447-5208-5719-4288 | 109 275(188) in 2017 | 3 |
| Madagascar | 42 | nk | 40 056(126) in 2017 | 2 |
| Malawi | 4 | 2-3-23-812-344 | 32 966(156) in 2017 | 3 |
| Mauritius | <1 | nk-nk-nk-0-nk | 254(24) in 2017 | 2 |
| Mozambique | 21 | 5072-3787-7010-910-5892 | 72 343(189) in 2017 | 3 |
| Réunion | <1 | nk | nk | nk |
| Rwanda | 2 | 74-nk-nk-0-nk | 16 659(111) in 2017 | 3 |
| Sao Tome & Principe | 43 | nk-nk-nk-0-nk | 220(94) in 2017 | 2 |
| Seychelles | <1 | 0-nk-nk-0-nk | 22(25) in 2017 | 1 |
| Somalia | 23 | 4342-6414-3100-6761-75 414 | 30 464(144) in 2017 | 3 |
| South Sudan | 60 | 0-0-0-0-16 088 | 25 030(200) in 2017 | 3 |
| Sudan | 24 | 9-7-346-0-nk | 32 526(68) in 2017 | 3 |
| Tanzania | 11 | 54-risk-nk-4777-4895 | 80 205(122) in 2017 | 3 |
| Uganda | 5 | 173-1521-358-4440-252 | Outbreak,20 56 512(112) in 2017 | 3 |
| Zambia | 11 | 0-0-447-4082-1794 | 27 670(128) in 2017 | 3 |
| South | ||||
| Botswana | 10 | nk-0-0-nk-nk | 54(2.2) in 2017 | 2 |
| Eswatini | 4 | nk-nk-nk-0-nk | 39(3) in 2017 | 2 |
| Lesotho | 22 | 0-nk-nk-0-nk | 79(4) in 2017 | 2 |
| Namibia | 47 | 0-0-nk-nk-nk | 64(2.4) in 2017 | 2 |
| South Africa | <1 | nk-nk-nk-5-0 | Outbreak,21 998 (1.8) in 2017 | 3 |
| Zimbabwe | 23 | 0-0-61-10 692-nk | Outbreak,22 656(4) in 2017 | 3 |
aSanitation from https://data.unicef.org/; cholera from8 and MoH, references and www.infective-continents.ch/; typhoid from7 for 2017, also MoH, references and www.infective-continents.ch/; i = imported, nk = not known, risk = considered as such by WHO.
Risks from defecation, domestic cholera and Salmonella Typhi/Paratyphi—Americasa
| Country | % defecating in the open ≤ 2020 | Notified domestic cholera, 2021–20–19–18–17 | S. Typhi/Paratyphi ≥2015 or typhoid cases, 2019–18–17–16–15 (rate/105) | Faecal score |
|---|---|---|---|---|
| North | ||||
| Canada | <1 | 0-0(&2i)-0(&3i)-0-1(&3i) | 194(0.5)-190-190-127-121 | 1 |
| Greenland | <1 | nk | 0 in 2017 | 0 |
| USA | <1 | 0-1(i?)-6(i?)-6(&8i)-2(&8i)-2(&9i) | 409(0.1)-401-419-376-367, & outbreak,23 carrier24 | 1 |
| Centre mainland | ||||
| Belize | <1 | 0 | 12(3) in 2017 | 1 |
| Costa Rica | <1 | 0 | 10(0.2) in 2017 | 0 |
| El Salvador | <1 | 0 | outbreak,25 144(2.4) in 2017 | 1 |
| Guatemala | 2 | 0 | outbreak,25 4045(29) in 2017 | 2 |
| Honduras | 4 | 0 | 227(3) in 2017 | 2 |
| Mexico | <1 | 0-0-1-1-0 | 28 680(22/105)-44 618-57 276-45 379-58 976, & outbreak25 | 2 |
| Nicaragua | 7 | 0 | 181(3) in 2017 | 2 |
| Panama | 4 | 0 | 75(1.9) in 2017 | 2 |
| Caribbean | ||||
| Antigua and Barbuda | <1 | nk | 1(1.5) in 2017 | 0 |
| Aruba/Curaçao | 1/<1 | nk | nk | nk |
| Bahamas | <1 | 0 | 5(1.4) in 2017 | 0 |
| Barbados | <1 | nk | 9(2.4) in 2017 | 1 |
| British Virgin Islands | <1 | nk | nk | nk |
| Cayman Islands | <1 | nk | nk | nk |
| Cuba | <1 | 0 | 153(1.1) in 2017 | 0 |
| Dominica | 6 | nk | 1(1.9) in 2017 | 1 |
| Dominican Rep. | 2 | 0-0-13-0-122 | 335(3) in 2017 | 3 |
| Grenada | 4 | nk | 2(1.7) in 2017 | 2 |
| Guadeloupe | <1 | nk | nk | nk |
| Haiti | 18 | 0-0-720-3777-13 681 | 1720(13) in 2017 | 3 |
| Jamaica | <1 | nk | 52(1.8) in 2017 | 1 |
| Martinique | <1 | nk-0-0-0-0 | nk | 0 |
| Puerto Rico | <1 | nk | 0-1(<0.1/105)-nk-nk-0, 86(1.8) in 2017 | 0 |
| St. Kitts | 1 | nk | nk | nk |
| St. Lucia | 6 | nk | 6(3) in 2017 | 2 |
| St. Vincent and Grenadines | 3 | nk | 3(3) in 2017 | 2 |
| Trinidad and Tobago | <1 | nk | 1(<0.1) in 2017 | 0 |
| Turks and Caicos | 2 | nk | nk | nk |
| US Virgin Islands | <1 | nk | 2(1.2) in 2017 | 0 |
| South | ||||
| Argentina | nk | 0 | nk-65(0.1)-5-6-7 | 1 |
| Bolivia | 10 | 0 | 173(1.7) in 2017 | 2 |
| Brazil | <1 | 0 | 4202(1.9) in 2017 | 1 |
| Chile | <1 | 0 | nk-nk-nk-85(0.5)-101, 1934(4) in 2017 | 1 |
| Colombia | 3 | 0 | nk-nk-nk-136(0.3)-371 | 2 |
| Ecuador | <1 | 0 | 247(1.5) in 2017 | 1 |
| French Guiana | <1 | 0 | nk | 0 |
| Guyana | <1 | 0 | 19(3) in 2017 | 1 |
| Paraguay | <1 | 0 | 114(1.8) in 2017 | 1 |
| Peru | 4 | 0 | 482(1.5) in 2017 | 2 |
| Suriname | 1 | nk | 12(2.1) in 2017 | 1 |
| Uruguay | <1 | nk | 3(<0.1) in 2017 | 1 |
| Venezuela | 3 | 0 | 25(<0.1) in 2017 | 2 |
aSanitation data from https://data.unicef.org/; cholera from8 and MoH, references and www.infective-continents.ch/; typhoid from7 for 2017, also MoH, references and www.infective-continents.ch/; i = imported; nk = not known.
Risks from defecation, domestic cholera and Salmonella Typhi/Paratyphi–Asiaa
| Country | % defecating in the open ≤ 2020 | Notified domestic cholera, 2021–20–19–18–17 | S. Typhi/Paratyphi ≥2015 or typhoid cases, 2019–18–17–16–15 (rate/105) | Faecal score |
|---|---|---|---|---|
| West | ||||
| Armenia | <1 | nk-nk-0-0-0 | 4(0.1) in 2017 | 0 |
| Azerbaijan | <1 | nk-nk-0-0-0 | 11(0.1) in 2017 | 0 |
| Bahrain | <1 | 0(&2i)-0-0-0-0 | nk-nk-nk-nk-11(0.8), 291(23) in 2017 | 1 |
| Georgia | <1 | nk-nk-0-0-0 | 6(0.1) in 2017 | 0 |
| Iran | <1 | 0-1-2-6(&1i)-9(&625i) | 16 688(22) in 2017 | 2 |
| Iraq | <1 | 0-9-0-3-nk | 23 183(47) in 2017 | 2 |
| Israel | <1 | nk-4(i?)-0-1(i?)-0 | 4(<0.1)-13-5-8-5 | 0 |
| Jordan | <1 | 0 | 13(0.1)-8-29-7-10 | 0 |
| Kazakhstan | <1 | nk-nk-0-0-0 | 19(0.1) in 2017 | 0 |
| Kuwait | <1 | 0-nk-0-0-0 | 764(20) in 2017 | 1 |
| Kyrgyzstan | <1 | nk | 7(0.1) in 2017 | 0 |
| Lebanon | <1 | 0-nk-0-0-0 | 2731(30) in 2017 | 1 |
| Oman | <1 | 0(&5i)-0-0(&4i)-0(&1i)-0 | 1180(28) in 2017 | 1 |
| Palestine | <1 | 0-0-nk-0-nk | 3149(56) in 2017 | 1 |
| Qatar | <1 | 0-0-0-0(&5i)-0(&5i) | 514(22) in 2017 | 1 |
| Saudi Arabia | <1 | 0-0-0-0-0(&5i) | nk-nk-nk-164(0.5)-149, 8854(27) in 2017 | 1 |
| Syria | <1 | 0 | 5487(26) in 2017 | 1 |
| Tajikistan | <1 | nk | 9 (0.1) in 2017 | 0 |
| Türkiye | <1 | nk | 23 025(30) in 2017 | 1 |
| Turkmenistan | <1 | nk | 6(0.1) in 2017 | 0 |
| United Arab Emirates | <1 | 0(&153i)-0(&13i)-0-0-0(&12i) | 1702(23) in 2017 | 1 |
| Uzbekistan | <1 | nk-nk-0-0-0 | 25(<0.1) in 2017 | 0 |
| Yemen | 10 | 72 765-275 712-861 096-371 326-1 032 481 | 30 051(83) in 2017 | 3 |
| South-Centre | ||||
| Afghanistan | 11 | 4755-0-2-0-33 | 42 756(104) in 2017 | 3 |
| Bangladesh | <1 | 477-212-503-566-nk | 1 046 157(641) in 2017 | 2 |
| Bhutan | <1 | 0-0-0-0-nk | 1419(145) in 2017 | 1 |
| India | 15 | risk-70-nk-697-385 | 8 365 375(586) in 2017, outbreak,26 fever27 | 3 |
| Maldives | <1 | 0 | 335(77) in 2017 | 1 |
| Nepal | 10 | 1607(&2i)-0-0-7-7 | 145 455(449) in 2017 | 3 |
| Pakistan | 7 | 21-21-nk-nk-nk | 727 834(295) in 2017, vaccine trial28 | 3 |
| Sri Lanka | <1 | 0-nk-nk-0-0 | 33 298(166) in 2017 | 1 |
| South-East | ||||
| Brunei | 3 | nk-nk-0-0-0 | 0 in 2017 | 1 |
| Cambodia | 19 | 26-48-nk-nk-0 | 36 172(212) in 2017, fever29 | 3 |
| Indonesia | 6 | 0-0-0-0-nk | 698 419(273) in 2017 | 2 |
| Laos | 16 | 0-nk-nk-nk-0 | 16 767(221) in 2017 | 2 |
| Malaysia | <1 | 63(&1i)-risk-81-164(&1i)-2 | 35 144 (116) in 2017 | 2 |
| Myanmar | 7 | 0-risk-0-0-0 | 141 588(267) in 2017 | 2 |
| Philippines | 4 | 2019-3-5491-2102-134 | 154 353(140) in 2017 | 3 |
| Singapore | <1 | nk-0-0(&2i)-0(&2i)-0(&3i) | nk-4(<0.1&55i)-4(&77i)-14(&56i)-8(&68i) | 0 |
| Thailand | <1 | 1-7-12-6-8 | fever,30 156,196(280) in 2017 | 2 |
| Timor-Leste | 18 | 0 | 2435(160) in 2017 | 2 |
| Vietnam | 3 | 0-0-nk-nk-0 | 137 599(155) in 2017 | 2 |
| East | ||||
| China | <1 | 5-11-15(&1i)-nk-14 | 569 618(52) in 2017, outbreak31 | 2 |
| Japan | <1 | 0-1-0(&5i)-3(&1i)-2(&5i) | 58(<0.1)-58-51-71-67 | 0 |
| Korea, North | <1 | nk-0-0-0-0 | 4984(22) in 2017 | 1 |
| Korea, South | <1 | 0-0-0(&1i)-0(&2i)-0(&5i) | 159(0.3)-260-201-177-165 | 0 |
| Mongolia | 8 | 0-nk-nk-nk-0 | 5 (0.2) in 2017 | 1 |
| Taiwan | nk | nk-1-0-7-0(&1i) | 6(<0.1 &26i)-22-22-18-35 | 1 |
aSanitation from https://data.unicef.org/; cholera from8 and MoH, references and www.infective-continents.ch/; typhoid from7 for 2017, also MoH, references and www.infective-continents.ch/; i = imported, nk = not known.
Risks from defecation, domestic cholera and Salmonella Typhi/Paratyphi—Oceaniaa
| Country | % defecating in the open ≤ 2020 | Notified domestic cholera, 2021–20–19–18–17 | S. Typhi/Paratyphi ≥2015 or typhoid cases, 2019–18–17–16–15 (rate/105) | Faecal score |
|---|---|---|---|---|
| American Samoa | <1 | nk | 0-0-nk-nk-0 | 0 |
| Australia | <1 | 0(1i)-0-0(&2i)-0-0(&3i) | 161(0.6)-175-144-104-114 | 0 |
| Cook Islands | nk | nk-0-nk-nk-nk | nk | nk |
| Easter Island | nk | nk | nk | nk |
| Federated Micronesia | nk | 0 | 88(77) in 2017 | 1 |
| Fiji | <1 | nk-0-nk-nk-0 | nk-nk-nk-390(45)-423 | 1 |
| French Polynesia | <1 | nk | nk | nk |
| Galapagos Islands | nk | nk | nk | nk |
| Guam | <1 | 0 | 80(50) in 2017 | 1 |
| Hawaii | nk | 0 | 2(0.1)-1-0-3-4 | 0 |
| Kiribati | 30 | nk-0-nk-nk-0 | 170(129) in 2017 | 2 |
| Marshall Islands | 10 | 0 | Endemic,23 53(85) in 2017 | 2 |
| Nauru | 3 | nk-0-nk-nk-0 | nk | 1 |
| New Zealand | <1 | 0-0-0-0(&1i)-0 | nk-72(1.5)-107-70-77 | 0 |
| New Caledonia | <1 | nk | nk | nk |
| Palau | <1 | 0-0-nk-nk-0 | nk | 0 |
| Papua New Guinea | 16 | 0 | 16 850(161) in 2017 | 2 |
| Samoa | <1 | nk-0-nk-nk-0 | 168(75) in 2017 | 1 |
| Solomon Is | 45 | nk-0-nk-nk-0 | 848(114) in 2017 | 2 |
| Tonga | <1 | 0 | 95(156) 2017 | 1 |
| Tuvalu | 9 | 0 | nk | 1 |
| Vanuatu | <1 | 0-0-nk-nk-0 | 441(403) 2017 | 1 |
| Wallis and Futuna Islands | 7 | nk | nk | nk |
aSanitation from https://data.unicef.org/; cholera from8 and MoH, references and www.infective-continents.ch/; typhoid from7 for 2017, also MoH, references and www.infective-continents.ch/; i = imported, nk = not known.
Overall, 214 countries or territories from 14 regions and 5 continents were searched for target data as described elsewhere (www.infective-continents.ch). Of these countries (and regions), 57 (and 4) were in Africa, 45 (and 4) in the Americas, 48 (and 4) in Asia, 23 in Oceania and 41 (and 2) in Europe. Calculations were performed on Microsoft Excel (version 16.66.1) by Microsoft Corporation. No formal statistical analyses were done.
Principles of the scoring system
Using traffic lights (red–yellow–green) as a model, the risk of faecal–oral transmission was scored in three broad groups, i.e. 3 (red) for high risk (‘unsafe’), 1–2 (yellow) for moderate risk (‘dubious’) and 0 (green) for minimal risk (‘negligible’). The score represents a simple addition of three items, i.e. defecation in the open, domestic cholera and endemic typhoid/paratyphoid infection risk.
‘Defecation in the open’ was scored 1 if the national prevalence of defecation in the open was > 1% in 2020. If the prevalence was < 1%, the score allocated was 0.
‘Domestic cholera’ was scored 1 if there was ≥1 notified domestic case in the period between 2021 and 2017, or 0 if domestic cholera was not reported. Imported cholera was not counted. Cholera is internationally notified, and cases are readily confirmed by laboratory tests and epidemiologic links. A rapid diagnostic test is available for V. cholerae, although cultures from faeces, blood or other clinical materials are still the gold standard in the diagnosis of cholera.
Finally, ‘typhoid/paratyphoid infection risk’ was scored 1 if there have been any outbreaks since 2015, if S. Typhi or SP has been laboratory-confirmed since 2019, or if the notification rate exceeded 2/105 in any year between 2015 and 2019 (this rate is the upper limit of typhoid notifications in high-income countries). In all other situations, typhoid/paratyphoid infection risk was scored 0. Typhoid fever is not under international surveillance and cases can be difficult to confirm,15 particularly in resource-limited settings with an increased risk of underreporting or misclassification. While rapid diagnostic tests are becoming available, culture or nucleic acid tests remain the laboratory gold standard for diagnosis. Here, the endemic rate for typhoid fever was set at > 2/105; other cutoffs are annual rates of < 10/105, 17 < 15/1057 or < 20/105. Countries for which no data for at least two of the three risk items were available were discarded from the ranking.
Results
For 199 (93%) of 214 countries examined, data were available for risk scoring (Tables 1–5 and Supplementary Table S2). Worldwide, 38 countries (19%) had a high risk faecal–oral transmission (Score 3), implying that open defecation is practiced by > 1% of the population, domestic cholera had occurred in the period of 2017 to 2021, and endemic typhoid (rate > 2/105/year) was recorded in the period of 2015 to 2019. Risk was moderate (1 or 2) in 93 (47%) countries and minimal (0) in 68 (34%) countries.
As expected, risk varied strongly among the continents. As shown in Table 5 and Figure 1 (Map), the percentage of countries scoring 3 was highest in Africa (53%) and lowest in Oceania (0%) and Europe (0%). The opposite was true for minimal risks: Score 0 was found for only 2 (4%) countries in Africa (Canary Islands and Madeira), but 10 (26%) countries in the Americas (Antigua & Barbuda, Bahamas, Costa Rica, Cuba, Greenland, French Guiana, Martinique, Puerto Rico, Trinidad & Tobago and US Virgin Islands), 13 (27%) countries in Asia, 5 (29%) countries in Oceania (American Samoa, Australia, Hawaii, New Zealand and Palau) and 38 (95%) countries in Europe. In Europe, only two countries (Bosnia & Herzegovina and Bulgaria) reached a score of 1.
Discussion
For 199 of 214 (93%) countries, at least partial data were available for this analysis, suggesting widespread awareness of the risk of faecal–oral transmission. Risk in continents roughly correlates with traveller’s diarrhoea which amounts to > 20% in most of Africa but < 8% in North America (Canada, Greenland, USA) and much of Europe, and Australia.18 Similar gradients are observed for cholera8 and typhoid fever.7 Of 150 cholera cases in travellers returning to North America and Europe in 1990–2018, 91 were imported from Latin America, 50 from West-, Southcentral- and Southeast Asia and 8 from sub-Saharan Africa (place of acquisition was unknown in 1).6 From 923 typhoid notifications in Australia in 2010–17, 887 were acquired overseas, for rates/105 person-years of 243 from South and Central Asia, 15 from Oceania, 0.4–10 in the rest of Asia, 9 from sub-Saharan Africa, 2% from Eastern Europe and 0.3% from Central America.5 However, prospective studies of attack rates for traveller’s diarrhoea are scant, and a correlation with the risk score at country level is not feasible. Part of this scarcity is perhaps explained by low attack rates among tourists staying at high-end resorts.
Prevention of gastrointestinal infection depends on safe consumption of tap water and foods, proper disposal and treatment of human excretions including maintenance of facilities, health education, in particular hand washing, availability of vaccines against cholera and typhoid fever in outbreaks and endemic areas, the rapid recognition and treatment of cases, and active surveillance.2,3,9–14 The score should help promote the prevention of water- and food-borne illness. Travellers, expatriates and local people in Score 3 countries should be informed that tap water and cold beverages are unsuitable for drinking. Instead, water should be boiled or bottled for drinking, and hot drinks should be preferred to iced drinks. In countries with Scores 1–2, tap water should be consumed only in metropolitan areas. In rural areas or in places where the source of the water is doubtful or of poor quality (foul odour or turbidity) suggesting faecal contamination, the water should not be consumed. The smelly odour should not be confused with the smell of high chlorine concentrations in water. In countries with minimal risk (0), tap water is usually safe for drinking, provided it is odourless and tasteless. Likewise, unopened beverages and foods from reliable sources should be safe.
Risk of faecal–oral transmission: countries examined, countries scored and distribution of scores by continentsa
| Africa | Americas | Asia | Oceania | Europe | World | ||
|---|---|---|---|---|---|---|---|
| Countries | With data/examined | 55/57 | 39/45 | 48/48 | 17/23 | 40/41 | 199//214 |
| Score | 3, high risk (%) | 29 (52.7) | 2 (5.1) | 7 (14.6) | 0 | 0 | 38 (19) |
| 1 or 2, moderate risk (%) | 24 (43.6) | 27 (69.2) | 28 (58.3) | 12 (71) | 2 (5) | 93 (47) | |
| 0, minimal risk (%) | 2 (3.6) | 10 (25.6) | 13 (27.1) | 5 (29) | 38 (95) | 68 (34) |
aBased on 199 countries scored (=100%).
Study strengths and limitations
A strength of this analysis is the large number of countries assessed and the use of three criteria that could be retrieved relatively easily. The scoring tool presented has several limitations.
A first limitation is the likely underrecognition, underreporting or misclassification of cholera and typhoid fever cases. This is particularly true for sub-Saharan Africa where there is little active surveillance of typhoid fever.7 An example in case is the unexpectedly low scores in Comoros. Irregular notification was partly remedied by including recent outbreak reports and population studies in the dataset (www.infective-continents.ch).
A second limitation is the rapidly changing epidemiological situation. This problem was addressed by including 5-year periods into the dataset. Moreover, human behaviour such as defecation in the open is likely to change only gradually.
A third limitation is that the score is crude and cannot exempt the customer from considering local risks of faecal–oral transmission even in Score 0 countries, for instance, remote locations depending on unsecure water sources or temporal disruption of municipal tap water.
Conclusion
This simple scoring system to assess the risk of gastrointestinal infection caused by faecal pathogens should help to minimize water- and food-borne illnesses (Table 5). Travellers, expatriates and residents should be made aware that tap water and cold beverages are unsuitable for drinking in Score 3 countries.
Acknowledgements
The author gratefully acknowledges the thorough review of the manuscript by Silvia Rogers, PhD, University of Basel and MediWrite, Basel (https://www.mediwrite.ch).
