


Abstract
Ethnoracial groups in high-income countries have a 2-fold higher risk of SARS-CoV-2 infection, associated hospitalizations, and mortality than Whites. Migrants are an ethnoracial subset that may have worse COVID-19 outcomes due to additional barriers accessing care, but there are limited data on in-hospital outcomes. We aimed to disaggregate and compare COVID-19 associated hospital outcomes by ethnicity, immigrant status and region of birth.
Adults with community-acquired SARS-CoV-2 infection, hospitalized March 1–June 30, 2020, at four hospitals in Montréal, Quebec, Canada, were included. Age, sex, socioeconomic status, comorbidities, migration status, region of birth, self-identified ethnicity [White, Black, Asian, Latino, Middle East/North African], intensive care unit (ICU) admissions and mortality were collected. Adjusted hazard ratios (aHR) for ICU admission and mortality by immigrant status, ethnicity and region of birth adjusted for age, sex, socioeconomic status and comorbidities were estimated using Fine and Gray competing risk models.
Of 1104 patients (median [IQR] age, 63.0 [51.0–76.0] years; 56% males), 57% were immigrants and 54% were White. Immigrants were slightly younger (62 vs 65 years; p = 0.050), had fewer comorbidities (1.0 vs 1.2; p < 0.001), similar crude ICU admissions rates (33.0% vs 28.2%) and lower mortality (13.3% vs 17.6%; p < 0.001) than Canadian-born. In adjusted models, Blacks (aHR 1.39, 95% confidence interval 1.05–1.83) and Asians (1.64, 1.15–2.34) were at higher risk of ICU admission than Whites, but there was significant heterogeneity within ethnic groups. Asians from Eastern Asia/Pacific (2.15, 1.42–3.24) but not Southern Asia (0.97, 0.49–1.93) and Caribbean Blacks (1.39, 1.02–1.89) but not SSA Blacks (1.37, 0.86–2.18) had a higher risk of ICU admission. Blacks had a higher risk of mortality (aHR 1.56, p = 0.049).
Data disaggregated by region of birth identified subgroups of immigrants at increased risk of COVID-19 ICU admission, providing more actionable data for health policymakers to address health inequities.
Background
The COVID-19 pandemic has highlighted structural inequities for vulnerable populations. It has also shown the importance of having actionable health data available so that public health and health systems can respond quickly to decrease transmission and poor health outcomes. The pandemic has disproportionately affected ethnocultural communities and migrants living in high-income countries. Ethnoracial groups including Blacks, Asians and other visible minorities have approximately a 2-fold increased risk of infection, hospitalization and mortality due to COVID-19 in the USA and the UK.1–5 Data on intensive care unit (ICU) admissions and in-hospital mortality by ethnicity are mixed.1,2 Migrants have a higher risk of being infected by severe acute respiratory syndrome coronavirus 2 (SARS-CoV-2; although they are less likely to be tested), being hospitalized and dying from COVID-19. There are limited data on severity of illness once hospitalized. These health disparities are due to a complex interaction of socioeconomic health determinants that increase the risk of exposure and a higher prevalence of underlying medical comorbidities, leading to more severe COVID-19 disease, all fuelled by long-standing structural inequities.6–8
Modern travel and migration patterns have led to increasingly diverse populations. Immigrants are an important subset of ethnic minorities and make up a significant proportion of the population in most high-income countries, including Canada (23%), Australia (29%), Germany (17%), the UK (14%) and the USA (14%).9,10 Despite these disparities and known structural inequities, only half of the countries in Europe and the USA systematically collect data on race, ethnicity or country of birth. Canada, a high volume migrant-receiving country, does not routinely collect these variables in health datasets across most jurisdictions.11 When collected, there is a lack of harmonization across countries as variables collected differ and there are no standardized definitions.12 In a cohort of hospital patients with COVID-19, we aimed to determine the factors associated with ICU admission and in-hospital mortality and the impact of ethnicity, immigrant status and region of birth on these outcomes. Collecting more granular data beyond racial groups on immigrant status and country of birth may identify subgroups who would benefit from targeted COVID-19 public health interventions and will inform resource allocation.
Methods
Study design and setting
We conducted a retrospective cohort study of all patients hospitalized with laboratory-confirmed, community-acquired SARS-CoV-2 infection at four tertiary care hospitals in Montreal, Quebec, Canada, during the first wave of the COVID-19 pandemic from 1 March to 30 June 2020, with follow-up until 31 August 2020. Montreal is a multicultural city where one-third (33%) of the population is foreign-born (2016 Census) and originates from all global regions.13 The participating hospitals serve a population of ~1.2 million people, of whom 32% are first-generation immigrants. The proportion of immigrants living in the three health regions served by the participating hospitals is 25, 31 and 42%, respectively.14 Visible minorities (non-White persons who are either foreign- or Canadian-born) make up 42% of the population in these same health regions and include: Black (26%), Arab (19%), Latin American (13%), Asian (37%), Other (3.5%) and Mixed (1.5%).15,16
Participants
All adults (≥18 years) hospitalized at the four hospitals with a diagnosis of SARS-CoV-2 infection confirmed by a positive polymerase chain reaction (PCR) test between 1 March 2020 and 30 June 2020 were included. Patients who were admitted from a long-term care facility or who had nosocomial acquired SARS-CoV-2 infection defined as those who have had a first positive SARS-CoV-2 PCR test ≥7 days after hospital admission were excluded. Nasopharynx or lower respiratory tract specimens were tested with a PCR test developed and validated by the Quebec provincial laboratory, targeting the envelope gene (E-gene) or a Health-Canada authorized commercial assay.
Data sources and definitions
Sociodemographic and medical information were collected from the hospital’s electronic medical record and the laboratory system until 31 August 2020. A semi-structured phone survey was conducted, with the patient post-discharge, or next-of-kin for deceased patients, with interpreters as needed. The survey included data on self-identified ethnicity, immigrant status, region of birth and other socioeconomic variables. Extracted data included age, sex, country of birth, medical comorbidities, medications, date of onset of symptoms, healthcare work, hospital outcomes (ICU admission, mechanical ventilation and mortality) and disposition (death, discharged, still admitted). A modified Charlson comorbidity score, excluding diabetes, was estimated.17,18 Diabetes was included as a separate variable, given the increased prevalence in certain ethnic groups and the association with poor COVID-19 outcomes.19,20 For patients where the date of onset of symptoms was not available, the date of the first positive SARS-CoV-2 PCR was used. Immigrants were defined as persons born outside of Canada. Countries of birth were grouped into World Bank regions (East Asia/Pacific, South Asia, Middle East/North Africa, Sub-Saharan Africa, Europe/USA, Latin American, Caribbean and Canada). Self-identified ethnicity categories were mutually exclusive and included White, Black, Asian, Latino, Middle East/North African, Mixed or Other. Any person identifying with more than one ethnicity was classified as mixed. Missing ethnicity was imputed by region of birth data: White (Canada + Europe/USA), Black (Caribbean + Sub-Saharan Africa), Asian (East Asia/Pacific + South Asia), Latino (Latin America) and Middle East/North African (Middle East/North Africa). This classification was 90% accurate based on the 60% self-reported ethnicity collected in the phone survey. Visible minorities were non-White persons and were either foreign- or Canadian-born. The National Early Warning Score 2 (NEWS2) measured disease severity at admission.21 Neighbourhood material and social deprivation were assigned using the Material and Social Deprivation Index (MSDI).22 The primary outcomes were admission to ICU and in-hospital mortality. Secondary outcomes were length of hospital stay, ICU length of stay and need for mechanical ventilation.
Statistical analysis
Descriptive analyses were performed for patients’ characteristics and study outcomes, stratified by immigrant status, region of origin and ethnicity. Means are presented with standard deviation and medians with interquartile range (IQR). Analysis of variance for continuous variables and Pearson chi-square tests for dichotomous variables were used to describe differences in patient characteristics and study outcomes across immigration and ethnicity categories. Adjusted hazard ratios (aHR) of in-hospital mortality and ICU admission by immigrant status, ethnicity and region of birth adjusted for age, sex, Charlson comorbidity score, diabetes and MSDI, and with calendar month as strata, were estimated with Fine and Gray competing risk proportional hazards models.23 In-hospital death was considered a competing risk for ICU admission, and hospital discharge was a competing risk for in-hospital death. Follow-up time began with the date of admission to the hospital and ended at the date of in-hospital death, date of hospital discharge or the end of the study observation (31 August 2020). The proportional hazard assumption was verified with log–log survival curves and Schoenfeld residuals for all variables included in the models. There was no violation of the proportional hazards assumption. In a secondary analysis, we used multiple logistic regression adjusted for the same sociodemographic and medical comorbidities to estimate adjusted odds ratios for severity score (NEWS2 categorized as 0–2, 5–6, ≥7 days) and length of symptoms (0–7, ≥8 days) at admission, for the main variables of interest (i.e., migration status, region of origin and ethnicity). All analyses were performed with SAS software version 9.4 (SAS Institute Inc.; Cary, NC).
Ethics approval
This study was approved by the CIUSSS West-Central Montréal, the CIUSSS de l'Est-de-l'Île-de-Montréal, the McGill University Health Center and the Centre Hospitalier de l’Université de Montréal review ethics boards.
Results
Between 1 March 2020 and 30 June 2020, 1104 patients with a laboratory-confirmed, community-acquired SARS-CoV-2 infection admitted to the hospital were included. The median age of patients was 63.0 years (IQR 51.0–76.0; range 19–102); 44% were female, and the median time from onset of symptoms to admission was 6 days (IQR 3–10).
Immigrant status and region of birth
Country of birth was recorded for 1093 patients (99.0%), of whom 622 (56.9%) were immigrants (Table 1). Initial COVID-19 hospitalizations were mainly among the Canadian-born, and by late March 2020, immigrants accounted for most hospitalizations, coinciding with widespread community transmission (Figure 1). Compared to the Canadian-born, immigrants were slightly younger (median 62 vs 65 years; P = 0.05), were mostly visible minorities (76 vs 6.6%; P < 0.001), had lower Charlson comorbidity score (mean 1.0 vs 1.2; P < 0.001), were more likely to have diabetes (33.9 vs 27.2%, P = 0.02) and had a higher proportion in the most deprived quintile on the MSDI (46.3 vs 38.4%; P = 0.01). A total of 154 patients (14.1%) were healthcare workers (HCW), of whom 107 (69%) were immigrants. More than half (52%) of immigrant HCW were Personal Support Workers (PSWs) compared to one-third (32%) of Canadian HCW. Country of birth data was recorded for 581 (93.4%) immigrants and included all global regions (Table 1). There was significant heterogeneity of median age, sex, Charlson comorbidity index and deprivation scores across regions of birth (Supplementary Table S1). There were no significant associations between severity score or length of symptoms on admission by immigrant status or region of birth (Supplementary Figure S1).
Characteristics and outcomes of patients admitted to hospital with community-acquired COVID-19 by immigrant status
| Overall | Canadian-born | Immigrant | P value | |
|---|---|---|---|---|
| Total | 1104 (100) | 471 (43.1) | 622 (56.9) | |
| Age (years) | 0.05 | |||
| Median (IQR) | 63.0 (51.0–76.0) | 65.0 (54.0–77.0) | 62.0 (49.0–75.0) | |
| Age (years) | 0.11 | |||
| <50 | 260 (23.8) | 100 (21.2) | 160 (25.7) | |
| 50–59 | 206 (18.8) | 79 (16.8) | 127 (20.4) | |
| 60–69 | 223 (20.4) | 101 (21.4) | 122 (19.6) | |
| 70–79 | 200 (18.3) | 96 (20.4) | 104 (16.7) | |
| ≥80 | 204 (18.7) | 95 (20.2) | 109 (17.5) | |
| Sex | 0.52 | |||
| Male | 612 (56.0) | 269 (57.1) | 343 (55.1) | |
| Female | 481 (44.0) | 202 (42.9) | 279 (44.9) | |
| Immigrant status | ||||
| Canadian-born | 471 (100.0) | 471 (100.0) | ||
| Immigrant | 622 (100.0) | 622 (100) | ||
| Missing | 11 (1.0) | |||
| Region of birth | <0.001 | |||
| East Asia and Pacific | 53 (4.8) | 53 (8.5) | ||
| South Asia | 39 (3.6) | 39 (6.3) | ||
| Middle East and North Africa | 80 (7.3) | 80 (12.9) | ||
| Sub Saharan Africa | 63 (5.8) | 63 (10.1) | ||
| Europe and USA | 146 (13.4) | 146 (23.5) | ||
| Latin America | 45 (4.1) | 45 (7.2) | ||
| Canada | 471 (43.1) | 471 (100.0) | ||
| Caribbean | 155 (14.2) | 155 (24.9) | ||
| Missing | 41 (3.8) | 41 (6.6) | ||
| Ethnicity | <0.001 | |||
| White | 589 (53.9) | 440 (93.4) | 149 (24.0) | |
| Black | 219 (20.0) | 7 (1.5) | 212 (34.1) | |
| Latino | 52 (4.8) | 6 (1.3) | 46 (7.4) | |
| Middle Eastern/North African | 81 (7.4) | 2 (0.4) | 79 (12.7) | |
| Asian | 99 (9.1) | 7 (1.5) | 92 (14.8) | |
| Other/Mixeda | 14 (1.3) | 9 (1.9) | 5 (0.8) | |
| Missing | 39 (3.6) | 39 (6.3) | ||
| Healthcare worker | <0.001 | |||
| Yes | 154 (14.1) | 47 (10.0) | 107 (17.2) | |
| No | 939 (85.9) | 424 (90.0) | 515 (82.8) | |
| Material and Social Deprivation Index (N = 1030) | 0.03 | |||
| Mean (SD) | 3.9 (1.3) | 3.8 (1.3) | 3.9 (1.3) | |
| Material and Social Deprivation Index (N = 1030) | 0.02 | |||
| 1 (Most Privileged) | 78 (7.1) | 40 (8.5) | 38 (6.1) | |
| 2 | 104 (9.5) | 45 (9.6) | 59 (9.5) | |
| 3 | 159 (14.5) | 71 (15.1) | 88 (14.1) | |
| 4 | 220 (20.1) | 96 (20.4) | 124 (19.9) | |
| 5 (Least Privileged) | 469 (42.9) | 181 (38.4) | 288 (46.3) | |
| Missing | 63 (5.8) | 38 (8.1) | 25 (4.0) | |
| Length of symptoms (days) (N = 1046) | 0.05 | |||
| Median (IQR) | 6.0 (3.0–10.0) | 6.0 (2.0–10.0) | 7.0 (3.0–10.0) | |
| Severity score (NEWS2) | 0.29 | |||
| 0–4 | 590 (54.0) | 266 (56.5) | 324 (52.1) | |
| 5–6 | 232 (21.2) | 98 (20.8) | 134 (21.5) | |
| ≥7 | 271 (24.8) | 107 (22.7) | 164 (26.4) | |
| Charlson comorbidity Indexb | <0.001 | |||
| Mean (SD) | 1.1 (1.7) | 1.2 (1.7) | 1.0 (1.7) | |
| Charlson comorbidity Indexb | <0.001 | |||
| <1 | 629 (57.5) | 235 (49.9) | 394 (63.3) | |
| 1–2 | 295 (27.0) | 152 (32.3) | 143 (23.0) | |
| 3–4 | 103 (9.4) | 54 (11.5) | 49 (7.9) | |
| ≥5 | 66 (6.0) | 30 (6.4) | 36 (5.8) | |
| Comorbidities | ||||
| Hypertension | 561 (51.3) | 243 (51.6) | 318 (51.1) | 0.88 |
| Coronary artery disease | 161 (14.7) | 76 (16.1) | 85 (13.7) | 0.26 |
| Heart failure | 88 (8.1) | 34 (7.2) | 54 (8.7) | 0.38 |
| Asthma | 112 (10.2) | 55 (11.7) | 57 (9.2) | 0.18 |
| Chronic pulmonary disease | 130 (11.9) | 81 (17.2) | 49 (7.9) | <0.001 |
| Dementia | 70 (6.4) | 35 (7.4) | 35 (5.6) | 0.23 |
| Diabetes | 339 (31.0) | 128 (27.2) | 211 (33.9) | 0.02 |
| Chronic kidney disease | 88 (8.1) | 44 (9.3) | 44 (7.1) | 0.17 |
| Cancer | 126 (11.5) | 70 (14.9) | 56 (9.0) | <0.01 |
| Immunosuppressionc | 87 (8.0) | 46 (9.8) | 41 (6.6) | 0.06 |
SD, standard deviation.
Eleven of 1104 (1%) patients missing immigrant status not shown: mean age of 56.8 years (SD 14.4), 45.5% female, 36.4% admitted to ICU, 9.1% died.
aEthnicity Other (10): [Canadian-born] Jewish (4), First Nations/Inuit/Metis (2), Polish (1). [Immigrant] Jewish (2), West Indian (1). Ethnicity Mixed (4): [Canadian-born] White + Black (1), First Nations/Inuit/Metis + Cree (1). [Immigrant] Black + North African/Middle Eastern (1), Black + South Asian (1).
bDoes not include diabetes.
cDoes not include 9 (0.8%) patients who were HIV positive.
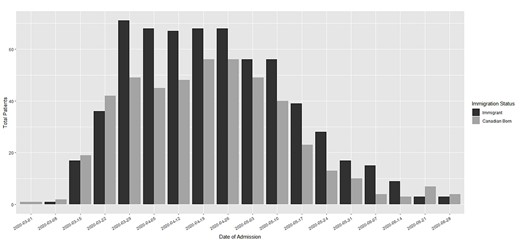
Number of patients with community-acquired SARS-CoV-2 infection, hospitalized from 1 March to 30 June 2020, at four hospitals in Montréal, Quebec, Canada, by immigrant status.
Ethnicity
A total of 1054 patients (95.5%) were classified into ethnicities, most of whom were White (55.9%) (Supplementary Table S2). Visible minorities were younger (median 56 vs 69 years; P < 0.001), had lower Charlson comorbidity score (mean 0.8 vs 1.3; P < 0.001) and a higher proportion were in the most deprived quintile of the MSDI (49.2 vs 38.4%; P = 0.001) compared to Whites. There was significant heterogeneity between ethnic groups and within ethnic groups when stratified by region of birth. Caribbean Blacks were older (median 62 vs 46; P < 0.001), had a higher Charlson comorbidity score (mean 0.9 vs 0.3; P < 0.001) and were more likely to have diabetes (46.5 vs 19.0%; P < 0.001) when compared to African Blacks. Among Asians, the only significant difference was that individuals from East Asia/Pacific were more likely to be female (54.7 vs 28.2%; P = 0.01) compared to South Asians. There was no significant association between length of symptoms or severity score at presentation by ethnicity (Supplementary Figure S1).
ICU admission
Overall, 342 patients (31%) were admitted to ICU (Supplementary Table S3). Immigrants had a higher cumulative 30-day probability of being admitted to ICU (33.0 vs 28.2%, log-rank P = 0.036) compared to the Canadian-born (Figure 2, Supplementary Table S3). After adjusting for age, sex, comorbidity score, diabetes, and the MDSI, there was a trend of increased ICU admission hazards among immigrants [aHR, 95% confidence interval (CI); 1.24, 1.00–1.53; P = 0.054] (Table 2). Adjusted hazards by ethnicity showed that Asians (1.64, 1.15–2.34) and Blacks (1.39, 1.02–1.89) had a higher risk of ICU admission compared to Whites (Table 2). When further stratified by region of birth, Caribbean Blacks (1.39, 1.02–1.89) but not Sub-Saharan African Blacks (1.37, 0.86–2.18) and East Asia/Pacific Asians (2.15, 1.42–3.24) but not South Asians (0.97, 0.49–1.93) had a higher adjusted risk for ICU admission compared to the Canadian-born. There was no significant difference in length of ICU stay by immigrant status, ethnicity or region of birth except for immigrants born in the Middle East/North Africa. ICU stay was longer among immigrants from the Middle East/North Africa than Canadian-born (median; 23 vs 10 days; P < 0.001).
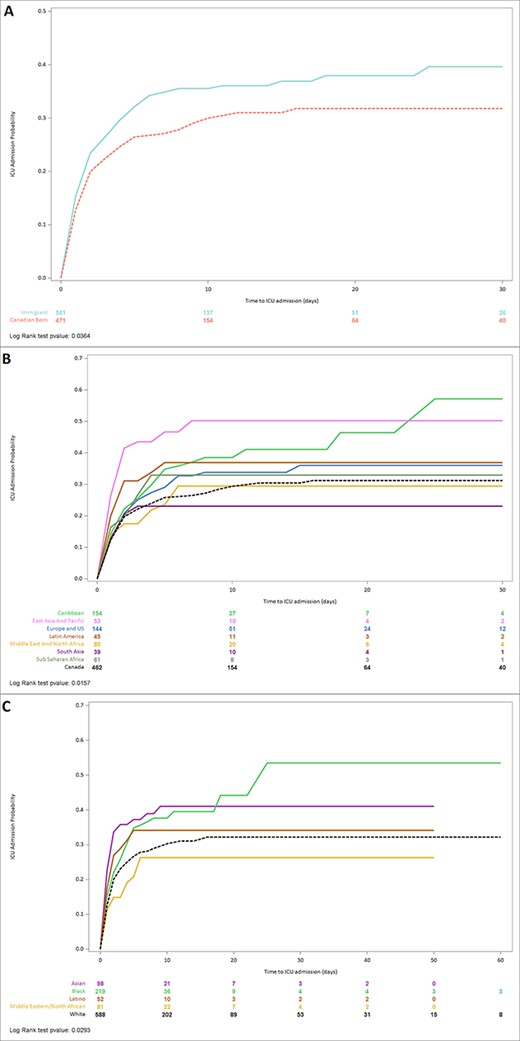
Kaplan–Meier curves of time to intensive care (ICU) after hospital admission with community-acquired COVID-19, stratified by (a) immigrant status, (b) region of birth and (c) ethnicity.
Hazards of admission to the intensive care unit among patients hospitalized with community-acquired COVID-19 by immigrant status, region of birth and ethnicity
| Variable | No. of patients | No. (% total) of patients admitted to ICU | HR (95% CI) | |||||
|---|---|---|---|---|---|---|---|---|
| Immigrant status | Region of birth | Ethnicity | ||||||
| Crude | Adjusted | Crude | Adjusted | Crude | Adjusted | |||
| Immigrant status (Ref: Canadian) | 471 | 133 (28.2) | 1.0 | 1.0 | ||||
| Non-Canadian | 622 | 205 (33.0) | 1.22 (0.98–1.52) | 1.24 (1.00–1.53) | ||||
| Region of birth (Ref: Canada) | 471 | 133 (28.2) | 1.0 | 1.0 | ||||
| Caribbean | 155 | 57 (36.8) | 1.37 (1.00–1.87) | 1.39 (1.02–1.89) | ||||
| East Asia and Pacific | 53 | 25 (47.2) | 1.99 (1.30–3.05) | 2.15 (1.42–3.24) | ||||
| Europe and USA | 146 | 48 (32.9) | 1.16 (0.83–1.61) | 1.24 (0.90–1.71) | ||||
| Latin America | 45 | 16 (35.6) | 1.37 (0.82–2.31) | 1.37 (0.82–2.29) | ||||
| Middle East and North Africa | 80 | 21 (26.3) | 0.95 (0.60–1.50) | 0.87 (0.57–1.35) | ||||
| South Asia | 39 | 9 (23.1) | 0.81 (0.41–1.59) | 0.97 (0.49–1.93) | ||||
| Sub Saharan Africa | 63 | 20 (31.7) | 1.24 (0.78–1.99) | 1.37 (0.86–2.18) | ||||
| Ethnicity (Ref: White) | 589 | 171 (29.0) | 1.0 | 1.0 | ||||
| Asian | 99 | 38 (38.4) | 1.47 (1.04–2.09) | 1.64 (1.15–2.34) | ||||
| Black | 219 | 78 (35.6) | 1.32 (1.01–1.72) | 1.39 (1.05–1.83) | ||||
| Latino | 52 | 17 (32.7) | 1.23 (0.75–2.03) | 1.29 (0.79–2.10) | ||||
| Middle Eastern/North African | 81 | 19 (23.5) | 0.81 (0.50–1.30) | 0.77 (0.49–1.20) | ||||
| Other/Mixed | 14 | 7 (50.0) | 2.01 (0.95–4.29) | 1.90 (1.00–3.62) | ||||
| Age at admission (Ref: <50) | 263 | 64 (24.3) | 1.0 | 1.0 | 1.0 | 1.0 | 1.0 | 1.0 |
| 50–59 | 210 | 68 (32.4) | 1.33 (0.94–1.87) | 1.20 (0.85–1.70) | 1.33 (0.94–1.87) | 1.12 (0.78–1.60) | 1.33 (0.94–1.87) | 1.19 (0.84–1.69) |
| 60–69 | 225 | 96 (42.7) | 1.77 (1.29–2.42) | 1.67 (1.21–2.31) | 1.77 (1.29–2.42) | 1.61 (1.15–2.26) | 1.77 (1.29–2.42) | 1.73 (1.25–2.41) |
| 70–79 | 202 | 82 (40.6) | 1.55 (1.12–2.16) | 1.47 (1.04–2.08) | 1.55 (1.12–2.16) | 1.46 (1.03–2.08) | 1.55 (1.12–2.16) | 1.57 (1.11–2.23) |
| ≥80 | 204 | 32 (15.7) | 0.54 (0.35–0.82) | 0.57 (0.36–0.88) | 0.54 (0.35–0.82) | 0.57 (0.36–0.89) | 0.54 (0.35–0.82) | 0.63 (0.40–0.98) |
| Sex (Ref: female) | 486 | 130 (26.7) | 1.0 | 1.0 | 1.0 | 1.0 | 1.0 | 1.0 |
| Male | 618 | 212 (34.3) | 1.31 (1.06–1.64) | 1.24 (1.01–1.53) | 1.31 (1.06–1.64) | 1.29 (1.04–1.60) | 1.31 (1.06–1.64) | 1.25 (1.01–1.55) |
| Charlson comorbidity indexa (Ref: 0) | 638 | 208 (32.6) | 1.0 | 1.0 | 1.0 | 1.0 | 1.0 | 1.0 |
| 1–2 | 296 | 96 (32.4) | 0.90 (0.71–1.15) | 1.07 (0.83–1.36) | 0.90 (0.71–1.15) | 1.09 (0.85–1.41) | 0.90 (0.71–1.15) | 1.11 (0.86–1.43) |
| 3–4 | 104 | 28 (26.9) | 0.72 (0.48–1.07) | 0.77 (0.51–1.17) | 0.72 (0.48–1.07) | 0.85 (0.56–1.28) | 0.72 (0.48–1.07) | 0.84 (0.55–1.27) |
| ≥5 | 66 | 10 (15.2) | 0.38 (0.20–0.71) | 0.47 (0.25–0.87) | 0.38 (0.20–0.71) | 0.47 (0.25–0.88) | 0.38 (0.20–0.71) | 0.47 (0.25–0.87) |
| Diabetes (Ref: no) | 763 | 230 (30.1) | 1.0 | 1.0 | 1.0 | 1.0 | 1.0 | 1.0 |
| Yes | 341 | 112 (32.8) | 1.06 (0.85–1.33) | 1.03 (0.82–1.29) | 1.06 (0.85–1.33) | 1.01 (0.80–1.28) | 1.06 (0.85–1.33) | 0.99 (0.78–1.25) |
| Material and Social Deprivation Index (Ref: 5) | 471 | 149 (31.6) | 1.0 | 1.0 | 1.0 | 1.0 | 1.0 | 1.0 |
| 1 | 79 | 25 (31.6) | 1.03 (0.67–1.57) | 0.79 (0.52–1.21) | 1.03 (0.67–1.57) | 0.89 (0.58–1.37) | 1.03 (0.67–1.57) | 0.88 (0.58–1.35) |
| 2 | 106 | 39 (36.8) | 1.21 (0.85–1.72) | 1.12 (0.80–1.56) | 1.21 (0.85–1.72) | 1.17 (0.84–1.63) | 1.21 (0.85–1.72) | 1.16 (0.83–1.61) |
| 3 | 160 | 53 (33.1) | 1.07 (0.79–1.47) | 0.97 (0.72–1.31) | 1.07 (0.79–1.47) | 0.95 (0.69–1.30) | 1.07 (0.79–1.47) | 0.95 (0.69–1.30) |
| 4 | 224 | 63 (28.1) | 0.88 (0.65–1.18) | 0.84 (0.63–1.11) | 0.88 (0.65–1.18) | 0.90 (0.68–1.20) | 0.88 (0.65–1.18) | 0.90 (0.67–1.19) |
Fine and Gray competing risk model, calendar month as strata, and in-hospital mortality as competing risk.
aDoes not include diabetes.
In-hospital mortality
In-hospital mortality was 15.1% (n = 167). A higher proportion of Canadian-born died compared to immigrants (17.6 vs 13.3%; P = 0.01) (Supplementary Table S3). After adjusting for age, sex, medical comorbidities, diabetes and MDSI, however, there was no difference in 30-day in-hospital mortality between immigrants and the Canadian-born population (aHR, 95% CI; 0.89, 0.64–1.23) (Table 3, Supplementary Figure S2). Blacks had a higher adjusted risk of mortality (1.56, 1.00–2.43; P = 0.049) than Whites, but there were no differences by region of birth (Table 3).
Hazards of in-hospital mortality among patients hospitalized with community-acquired COVID-19 by immigrant status, region of birth and ethnicity
| No. (% total) of patients who died | HR (95% CI) | |||||||
|---|---|---|---|---|---|---|---|---|
| Variable | No. of patients | Immigrant status | Region of birth | Ethnicity | ||||
| Crude | Adjusted | Crude | Adjusted | Crude | Adjusted | |||
| Immigrant status (Ref: Canadian) | 471 | 83 (17.6) | 1.0 | 1.0 | ||||
| Non-Canadian | 622 | 83 (13.3) | 0.77 (0.57–1.05) | 0.89 (0.64–1.23) | ||||
| Region of birth (Ref: Canada) | 471 | 83 (17.6) | 1.0 | 1.0 | ||||
| Caribbean | 155 | 26 (16.8) | 1.07 (0.69–1.66) | 1.46 (0.92–2.30) | ||||
| East Asia and Pacific | 53 | 5 (9.4) | 0.50 (0.20–1.24) | 0.95 (0.38–2.35) | ||||
| Europe and USA | 146 | 27 (18.5) | 0.95 (0.61–1.46) | 0.73 (0.46–1.16) | ||||
| Latin America | 45 | 2 (4.4) | 0.27 (0.07–1.11) | 0.47 (0.12–1.85) | ||||
| Middle East and North Africa | 80 | 15 (18.8) | 0.94 (0.53–1.66) | 1.09 (0.61–1.95) | ||||
| South Asia | 39 | 3 (7.7) | 0.48 (0.15–1.51) | 0.66 (0.18–2.46) | ||||
| Sub Saharan Africa | 63 | 4 (6.3) | 0.44 (0.16–1.21) | 1.04 (0.35–3.07) | ||||
| Ethnicity (Ref: White) | 589 | 109 (18.5) | 1.0 | 1.0 | ||||
| Asian | 99 | 8 (8.1) | 0.44 (0.22–0.91) | 0.85 (0.40–1.81) | ||||
| Black | 219 | 29 (13.2) | 0.87 (0.58–1.31) | 1.56 (1.00–2.43) | ||||
| Latino | 52 | 2 (3.8) | 0.25 (0.06–1.00) | 0.48 (0.12–1.91) | ||||
| Middle Eastern/North African | 81 | 15 (18.5) | 1.00 (0.58–1.72) | 1.21 (0.71–2.08) | ||||
| Other/Mixed | 14 | 2 (14.3) | 0.74 (0.18–2.99) | 1.02 (0.19–5.47) | ||||
| Age at admission (Ref: <50) | 263 | 7 (2.7) | 1.0 | 1.0 | 1.0 | 1.0 | 1.0 | 1.0 |
| 50–59 | 210 | 14 (6.7) | 1.73 (0.70–4.29) | 1.96 (0.78–4.95) | 1.73 (0.70–4.29) | 2.00 (0.78–5.16) | 1.73 (0.70–4.29) | 2.16 (0.85–5.54) |
| 60–69 | 225 | 23 (10.2) | 1.74 (0.74–4.08) | 2.29 (0.95–5.54) | 1.74 (0.74–4.08) | 2.26 (0.91–5.58) | 1.74 (0.74–4.08) | 2.38 (0.97–5.84) |
| 70–79 | 202 | 42 (20.8) | 3.47 (1.55–7.76) | 4.37 (1.83–10.43) | 3.47 (1.55–7.76) | 4.47 (1.86–10.73) | 3.47 (1.55–7.76) | 4.64 (1.92–11.23) |
| ≥80 | 204 | 81 (39.7) | 7.33 (3.37–15.95) | 9.63 (4.10–22.62) | 7.33 (3.37–15.95) | 10.16 (4.24–24.34) | 7.33 (3.37–15.95) | 10.45 (4.33–25.22) |
| Sex (Ref: female) | 486 | 59 (12.1) | 1.0 | 1.0 | 1.0 | 1.0 | 1.0 | 1.0 |
| Male | 618 | 108 (17.5) | 1.21 (0.88–1.66) | 1.38 (0.99–1.94) | 1.21 (0.88–1.66) | 1.41 (1.00–1.97) | 1.21 (0.88–1.66) | 1.36 (0.97–1.90) |
| Charlson comorbidity indexa (Ref: 0) | 638 | 41 (6.4) | 1.0 | 1.0 | 1.0 | 1.0 | 1.0 | 1.0 |
| 1–2 | 296 | 62 (20.9) | 2.18 (1.46–3.24) | 1.83 (1.17–2.87) | 2.18 (1.46–3.24) | 1.82 (1.16–2.86) | 2.18 (1.46–3.24) | 1.85 (1.18–2.89) |
| ≥3 | 170 | 64 (37.6) | 4.02 (2.71–5.96) | 3.21 (2.01–5.12) | 4.02 (2.71–5.96) | 3.42 (2.15–5.43) | 4.02 (2.71–5.96) | 3.42 (2.16–5.40) |
| Diabetes (Ref: no) | 763 | 93 (12.2) | 1.0 | 1.0 | 1.0 | 1.0 | 1.0 | 1.0 |
| Yes | 341 | 74 (21.7) | 1.51 (1.11–2.06) | 1.41 (1.01–1.99) | 1.51 (1.11–2.06) | 1.39 (0.98–1.96) | 1.51 (1.11–2.06) | 1.38 (0.98–1.96) |
| Material and Social Deprivation Index (Ref: 5) | 471 | 67 (14.2) | 1.0 | 1.0 | 1.0 | 1.0 | 1.0 | 1.0 |
| 1 | 79 | 11 (13.9) | 1.06 (0.56–2.02) | 1.01 (0.53–1.95) | 1.06 (0.56–2.02) | 1.08 (0.55–2.11) | 1.06 (0.56–2.02) | 1.08 (0.55–2.14) |
| 2 | 106 | 14 (13.2) | 0.92 (0.52–1.63) | 0.69 (0.38–1.25) | 0.92 (0.52–1.63) | 0.64 (0.35–1.18) | 0.92 (0.52–1.63) | 0.65 (0.36–1.19) |
| 3 | 160 | 22 (13.8) | 0.98 (0.60–1.59) | 0.86 (0.53–1.40) | 0.98 (0.60–1.59) | 0.87 (0.52–1.45) | 0.98 (0.60–1.59) | 0.87 (0.53–1.44) |
| 4 | 224 | 42 (18.8) | 1.38 (0.94–2.03) | 1.05 (0.71–1.54) | 1.38 (0.94–2.03) | 1.10 (0.74–1.62) | 1.38 (0.94–2.03) | 1.10 (0.74–1.63) |
Fine and Gray competing risk model, calendar month as strata, and in-hospital mortality as competing risk.
aDoes not include diabetes.
Discussion
Immigrants were over-represented among COVID-19 hospitalizations accounting for more than half of all admissions during the first wave of the COVID-19 pandemic in four hospitals in Montreal, Canada, but they only account for 32% of the population.24 There was significant heterogeneity in population characteristics (age, sex, comorbidities and socioeconomic status) and hospital outcomes by region of birth and ethnicity. Asians were at increased risk of admission to the ICU. Immigrants from East Asia and the Pacific accounted for all this aggregate risk, while immigrants from South Asia were not at increased risk. Similarly, the Black population had an increased risk of ICU admission and in-hospital mortality. The Caribbean black population but not the Sub-Saharan black population was significantly at risk for these outcomes. These poorer outcomes among subgroups of immigrants remained after adjusting for sociodemographic and medical comorbidities, despite no difference in disease severity or duration of symptoms at presentation.
Although we could not directly estimate this, we hypothesize that the high proportion of immigrants (57%) admitted to the hospital in our study was primarily driven by higher rates of SARS-CoV-2 due to increased exposure. Several other countries in Europe, the UK and the USA have found a 2-fold higher risk of COVID-19 hospitalizations among ethnic minorities and immigrants despite being younger with fewer comorbidities compared to host populations.1–4,25–28 This is thought to be due to increased SARS-CoV-2 exposure resulting from crowded living and working circumstances, higher-risk occupations such as healthcare and transport, fewer opportunities to work from home and poorer access to public health messaging.7,8,26,29,30 In our study, we also found that the immigrant population was younger, had fewer medical comorbidities and was more likely to be HCW (17 vs 10%) than the Canadian-born population. Immigrants accounted for 69% of all hospitalized HCW and were more likely to be PSWs (52% vs. 32%) compared to Canadian HCW. Immigrant communities and immigrant HCW were disproportionately affected by COVID-19 in Quebec. The boroughs with the highest SARS-CoV-2 infection rates were those with the highest density of immigrants, the highest social deprivation and the highest number of infected HCW (as of 15 June 2020). These were the same boroughs served by the four participating hospitals.14,31 HCW were among the highest risk groups in the first wave and accounted for 25% of all COVID-19 cases, although they make up <4% of the population.32 HCW whose mother tongue was other than English or French and who were PSW were at highest risk and were almost twice as likely to contract SARS-CoV-2 compared to other HCW.32
The overall ICU admission rate in our study was 31% and was similar to that reported in the USA during the first wave of the pandemic.33 Although immigrants and ethnic minorities were younger and had fewer medical comorbidities, they had a trend toward a higher risk of being admitted to the ICU after adjusting for age, sex, socioeconomic status and medical comorbidities. This finding was not due to increased severity of illness on admission or delayed presentation, given there was no difference in the severity index or the mean number of days of symptoms between immigrants, racial groups and the Canadian-born population. Studies from Italy, Spain and the UK also found that immigrants and ethnic minorities were at increased risk of ICU admission than host populations after adjusting for age and medical comorbidities.25,28,34 We found significant heterogeneity in the risk of ICU admission among sub-groups of Asians and Blacks. Asians had a 1.6 increased risk of ICU admission; however, when disaggregated by region of birth, immigrants from East Asia and the Pacific had a 2-fold higher risk, whereas there was no increased risk among South Asians. For the Black population, Caribbean Blacks had a 1.4 increased risk of ICU admission, whereas Sub-Saharan Blacks had a 1.4 non-significant risk compared to the White population. A UK study found that Sub-Saharan Africans were at higher risk (aHR 4.2) of ICU admission than Caribbean Blacks (aHR 2.3).34 In each of the reported studies, the country of birth or ethnicity of those at increased risk for ICU admission differed and were also different from those found in our study.25,34 In the UK, South Asians and Blacks were at increased risk (aHR of 2.2 and 3.1), whereas in Spain, immigrants from Latin America and North Africa were at increased risk (relative risk of 6.2 and 2.9). The consistent finding across all studies is of increased risk of severe COVID-19 outcomes among hospitalized ethnic minorities and immigrants compared to host populations despite accounting for sociodemographic factors and clinical comorbidities is unexplained. Further studies to understand the potential interactions between COVID-19 and underlying conditions or other factors driving these inequalities will be required to mitigate the impact of COVID-19 in these populations. The heterogeneity of immigrant and ethnic groups at increased risk for severe outcomes that varies within and between countries underscores the diversity of this population and the need to routinely collect granular data locally on country of birth with or without ethnicity to inform local policies.
The mortality rate in our study was 15%, which is lower than the 22% in-hospital mortality rate reported in Europe and the USA during the first wave of the pandemic.35 This is likely due to the exclusion of nursing home residents who accounted for 70% of the deaths in Quebec during the study period.36 In one of the participating hospitals in the first wave of the pandemic, the overall mortality rate was 22%, with higher mortality among nursing home patients (36.6%) compared to non-nursing home patients (15.0%).37 In our study, Black patients had a 1.6 increased risk of death compared to Whites after adjusting for sociodemographics and comorbidities. Although neither estimate was significant, the increased risk among Caribbean Blacks (aHR 1.46) but not among Sub-Saharan Africans (aHR 1.04) is likely driving this aggregate estimate. This may be due to unmeasured health inequity factors or confounders, similar to those with ICU admission.
This study presents the first Canadian data from a diverse population on a large sample of immigrants that reports on immigrant status, country of birth and ethnicity. In addition to controlling for medical comorbidities and social and material deprivation, we explored key variables that increase exposure, including healthcare work occupation, and measured severity of illness at the time of admission to the hospital. Our study was limited by the inability to control body mass index as this was not available in hospital charts. We could not explore other variables that increase SARS-CoV-2 exposure, such as household crowding, ability to isolate or health-related behaviour. The factors mentioned above and other unmeasured confounders such as language proficiency of the patient, structural racism or access to care may have influenced our estimates. We had a large number of immigrants in our sample; yet once stratified by region of birth or ethnicity, subcategories with low counts limited the precision of some stratified analyses.
Modern travel and migration patterns have led to increasingly diverse populations.9,10 Categorizing populations by race/ethnicity is inadequate to capture the diversity of the foreign-born population, as they have distinct cultural, behavioural, language, social or environmental characteristics and legal entitlement to healthcare that are critical to health outcomes and are not captured in single racial categories. In addition, a growing number of people identify as multiracial/multicultural.11,38 Data from our study and other studies highlight the disproportionate impact of COVID-19 on foreign-born populations, the enormous heterogeneity of COVID-19-related outcomes within ethnic groups and across countries, and the significant gaps in understanding of the individual impact of social determinants, and the interaction between them. Tackling ethnic health inequalities is complex; however, collecting granular data on country of birth in addition to ethnicity is an urgent critical gap that needs to be addressed. This will more precisely identify groups who have the highest health inequities, providing more actionable health data to inform health policy and resource allocation.
Authors’ contribution
Conceptualization: C.G.
Data curation: O.D., N.M., M.-A.T.-G.
Data cleaning and analysis: J.K., M.-A.T.-G., A.M.P.-C.
Funding acquisition: C.G.
Methodology: C.G., C.R., A.B., L.A.
Project administration: CG, M.-A.T.-G.
Study Resources: C.G., A.-C.L., S.B., M.L.
Writing—original draft: C.G., A.M.P.-C.
Writing—review and editing: A.M.P.-C., A.-C.L, S.B., M.-L.L., O.D., N.M., M.A.T.-G., J.K., C.R., A.B., L.A., C.G.
Acknowledgements
Dr Azoulay holds a Chercheur-Boursier Senior Award from the Fonds de Recherche du Québec—Santé and is the recipient of a William Dawson Scholar award from McGill University. Ana Maria Passos-Castilho has received a postdoctoral fellowship from the Canadian Network on Hepatitis C (CanHepC). CanHepC is funded by a joint initiative of the Canadian Institutes of Health Research (NPC-178912) and the Public Health Agency of Canada. We would like to acknowledge the many medical students and fellows including Pouria Alipour, Anthony Bartholy, Yousra Belkass, Francois Fabi, Craig McCullogh, Eve Melançon, Michelle Taillefer, Jillian Schniedman, Alex Silver, Aminata Soumana and study staff that were responsible for data curation and data validation.
Funding
This work was supported by an Investigator Initiated Grant from Gilead and the Jewish General Hospital Foundation.
Conflict of interest: Dr Azoulay reports personal fees from Janssen and Pfizer, outside the submitted work.
