


Abstract
Considerable attention has focused on studying reviewer agreement via inter-rater reliability (IRR) as a way to assess the quality of the peer review process. Inspired by a recent study that reported an IRR of zero in the mock peer review of top-quality grant proposals, we use real data from a complete range of submissions to the National Institutes of Health and to the American Institute of Biological Sciences to bring awareness to two important issues with using IRR for assessing peer review quality. First, we demonstrate that estimating local IRR from subsets of restricted-quality proposals will likely result in zero estimates under many scenarios. In both data sets, we find that zero local IRR estimates are more likely when subsets of top-quality proposals rather than bottom-quality proposals are considered. However, zero estimates from range-restricted data should not be interpreted as indicating arbitrariness in peer review. On the contrary, despite different scoring scales used by the two agencies, when complete ranges of proposals are considered, IRR estimates are above 0.6 which indicates good reviewer agreement. Furthermore, we demonstrate that, with a small number of reviewers per proposal, zero estimates of IRR are possible even when the true value is not zero.
1 INTRODUCTION
Grant peer review allocates billions of dollars of research funding, makes decisions that can make or break a scientific career (Alberts et al., 2014; Warner et al., 2017), and consumes substantial resources to sustain on the part of applicants, reviewers, and grant agencies (Bollen et al., 2014; Fang & Casadevall, 2014; Fang et al., 2016; Graves et al., 2011; Greenberg, 1999; Gross & Bergstrom, 2019). Grant funding mechanisms vary; yet, most rely on peer review for assessing the quality and potential impact of proposed research. With so much at stake, it is natural to ask about the quality of these peer review assessments themselves. Understanding the characteristics and limits of peer review assessments can be useful for scientific communities and funding agencies in their evaluations about whether and how peer review should be used to make funding decisions.
From a measurement perspective (Bartholomew et al., 2011), the underlying quality of a grant proposal can be thought of as a latent variable; and, each reviewer’s score can be thought of as an observable yet imperfect indicator of that quality. In this context, there are two broad approaches that one can take for assessing the quality of the indicators. The first approach is to compare available indicators to a measure of quality that constitutes some ‘gold standard’. However, there is no accepted ‘gold standard’ by which we could assess the quality of grant peer review (Lauer & Nakamura, 2015) or journal peer review (Moher & Ravaud, 2016; Superchi et al., 2019). Although some have used bibliometric measures such as the number of publications and citations to evaluate the predictive validity of grant peer review (Fang et al., 2016; Lauer et al., 2015; Li & Agha, 2015), others have objected that these proxies fail to track scientific novelty, rigor and potential (Fang et al., 2016; Lindner & Nakamura, 2015).
Another approach to assessing the quality of peer review—and the one we are concerned with in this article—is to study variability in the observed indicators of a grant proposal’s quality, that is, in peer review scores. The internal reliability of peer review scores is one statistic that has often been used to quantify this variability (Bailar III & Patterson, 1985). Reliability is an essential concept for behavioural and psychometric measurement which aims to provide information on the extent to which measures can be replicated (Lord & Novick, 2008). Depending on the type of replication, researchers distinguish different types of reliability including test-retest, intra-rater and inter-rater reliabilities (Webb et al., 2006). In peer review research, while there is also interest in test-retest reliability with replications across different panels (Cole et al., 1981; Graves et al., 2011; Hodgson, 1997), the main focus is typically on inter-rater reliability (IRR) which can be thought of as the correlation between scores of different reviewers given to the same grant proposal. Although editors and program officers may actively seek out diverse forms of expertise and opinion when evaluating submissions, which could lead to lower reliability rates but epistemically improved outcomes (Hargens & Herting, 1990; Lee, 2012), Marsh et al. (2008) have interpreted relatively low IRR rates in grant review to be the ‘most basic, broadly supported, and damning’ evidence against peer review (p. 161)—see also (Jayasinghe et al., 2001; Marsh et al., 2008). Such a stance foregrounds policies that could decrease measurement error and increase IRR; relevant policies include reviewer training (Sattler et al., 2015) and identification of heterogeneity sources in IRR with respect to grant or applicant characteristics (see Jayasinghe et al., 2003; Martinková et al., 2018; Mutz et al., 2012) to improve IRR generally and especially for lower-IRR subgroups (e.g. see Martinková et al., 2018).
While not exhaustive, Table 1 provides a summary of methods from several studies in the growing body of research that uses IRR to assess the quality of grant peer review. To facilitate comparison, we report single-rater IRR findings from these studies. We see that studies vary substantially in the numbers of proposals considered and in the methods used for IRR estimation. It is also not uncommon to see that IRR for grant peer review is estimated using some range-restricted subset of submissions. This is partly related to the kinds of peer review data that are available. For example, concerns about protecting the privacy of applicants who have failed to receive funding resulted in limited data available for research on federal grant peer review (Chubin et al., 1990; Gropp et al., 2017): in particular, in the US context, exemptions to the Freedom of Information Act have been invoked by federal grant agencies to try to prevent the disclosure of information about unsuccessful grant applications (Chubin et al., 1990, p.53). Studies that include only funded and, therefore, publicly visible, federal grant proposals can be found not only in the IRR literature (Pier et al., 2017, 2018) but also in the literature on the predictive validity of grant peer review (Fang et al., 2016; Li & Agha, 2015). Other constraints—due to specific procedures and operations used in the assessment process—mean that the weakest proposals are triaged before reviews are solicited (Jayasinghe et al., 2001, 2003) or, based on initial review, before panel discussions (Carpenter et al., 2015; Pier et al., 2017).
Overview of reported IRR in selected studies on grant peer review
| Study | Proposals | Restricted range | IRR methods | (n) | |
|---|---|---|---|---|---|
| Cicchetti (1991) | 150 NSF | No restriction | ANOVA | 0.18–0.37 | 0.48c (4.24)–0.68c (3.69) |
| Jayasinghe et al. (2001) | 2331 ARC | Top 78% | ANOVA and HLM | 0.15a | 0.44 (4.3) |
| Jayasinghe et al. (2003) | 2331 ARC | Top 78% | ANOVA and HLM | 0.17b | 0.46 (4.2) |
| Carpenter et al. (2015) | 260 AIBS | No restriction | ANOVA | 0.14–0.41 | 0.25–0.58c (2.00) |
| Mutz et al. (2012) | 8329 FWF | No restriction | HLM | 0.26 | 0.50 (2.82) |
| Pier et al. (2017) | 25 funded NIH | ≈ top 18% | Krippendorf alpha | 0.08 | 0.22 c (3.00) |
| Pier et al. (2018) | 25 funded NIH | ≈ top 18% | HLM | 0.00 | 0.00c (2-4) |
Proposal quality for humanities, social sciences, and STEM disciplines.
Proposal quality for STEM disciplines only.
Calculation based on Spearman-Brown formula .
Notably, one study published in the Proceedings of the National Academy of Sciences (PNAS) reported an IRR estimate of exactly zero in a mock NIH review process involving 25 real NIH R01 proposals that had been funded either on their first or second submission after revision (Pier et al., 2018). The authors obtained and analysed 83 individual reviewer ratings—where 43 reviewers contributed two ratings and 3 reviewers contributed one rating each—and concluded there was ‘no agreement among reviewers’. For this group of 25 funded grant applications, the estimate of IRR was 0 with 95% CI (0,0.14). While the authors acknowledged that it is not possible to ‘say whether these findings would generalize to an entire pool of applications’, the Pier et al. (2018) article has since been used to support the point of view that ‘there is complete arbitrariness in the peer review process’ (Brezis & Birukou, 2020, p.406).
In this paper, we consider IRR estimation and use real data to demonstrate that applying IRR in the context of peer review is not always straightforward. In Sections 2.1 and 2.2, we introduce the data sets of review scores from two agencies, the American Institute of Biological Sciences (AIBS) (Gallo, 2021) and the National Institutes of Health (NIH) (Erosheva et al., 2020). In Section 3, we formally define IRR and explain that (1) considering subsets of top quality submissions will result in lower IRR values and (2) with a small number of reviews per proposal, IRR estimation can result in zero likelihood-based estimates even when the true value is not zero. With AIBS and NIH data, in Section 4, we find that across the full range of submissions the IRR estimate is certainly not zero. However, zero likelihood-based IRR estimates are quite plausible when substantial fractions of top or bottom quality proposals are considered. Because, from a measurement perspective, IRR is only valid when used on ratings from scales that reflect the spectrum of evaluative decisions, we recommend against estimating IRR for range-restricted samples in typical peer review settings. We conclude the paper by discussing other ways of examining variability in peer review scores for studying the quality of peer review.
The restricted-range IRR estimation presented here is implemented within an open-source package for R ShinyItemAnalysis (Martinková & Drabinová, 2018) with an interactive Shiny web application available from https://shiny.cs.cas.cz/ShinyItemAnalysis/. The Supplementary PDF and the Markdown code to replicate all the analyses can be obtained from https://osf.io/knph8/.
2 PEER REVIEW DATA ACROSS THE COMPLETE RANGE OF SUBMISSIONS
While review procedures and mechanisms for funding decisions differ by funding agency, the practice of soliciting multiple reviewers to assign scores to grant proposals is common. Peer review at the National Institutes of Health (Hoppe et al., 2019; Lindner & Nakamura, 2015) as well as some other organizations that fund biomedical research (e.g. Fleurence et al., 2014) starts by having a few assigned reviewers read and score each application according to some selected criteria and determine a score for the application as a whole. Depending on the programme, the next step is to use the assigned reviewers’ scores to either make funding decisions or to triage the applications that are considered to be well outside of a fundable range before proceeding to the second stage of peer review which, if it exists, is commonly a panel meeting. Grant review panels are charged with evaluating a number of grant proposals in a given scientific area, and are often relying heavily on the reports and evaluations of the assigned reviewers (Carpenter et al., 2015; Martin et al., 2010). Final scores are typically, but not always, a compilation of scores provided by all panel members.
In this paper, we consider two data sets on grant review that contain proposal ratings across the complete range of submissions. The review data come from the AIBS and from the NIH. For the purposes of our illustration, we focus only on estimating IRR measures for the overall ratings: the overall scientific merit score for the AIBS data and the Preliminary Overall Impact Scores for the NIH data. Research demonstrates that reviewers exhibit similar or worse IRR measures when scoring lower-level, proposal-related criteria such as originality, methodology, and scientific/theoretical merit (Jayasinghe et al., 2003).
2.1 AIBS grant proposal review data
The AIBS provides independent, objective scientific peer review services. Our AIBS grant review data (Gallo, 2021) contains a complete set of applications from three rounds of an ongoing intramural collaborative biomedical research program for 2014–2017. Most of the applications to this program are akin to NIH’s R01 funding mechanism in that applicants can request up to 3 years of funding with a maximum of $450,000 in direct costs. There were a total of 72 applications, each evaluated by three reviewers with areas of expertise closely matching those of the applications being evaluated. Individual reviewers provide scores for several application criteria as well as the overall scientific merit score which is scored on a scale from 1 (best) to 5 (worst); one decimal place is allowed in the scores. Application scores indicate where each application falls among all practically possible applications in comparison with ‘the ideal standard of quality’ from ‘a perfect application’ (Gallo, 2021). No panel discussion takes place in this review mechanism; the final proposal score is the average of the three reviewers’ overall scientific merit scores and is the primary factor in determining AIBS funding decisions. The University of Washington’s Institutional Review Board which determined that the analyses of de-identified AIBS grant review data did not involve human subjects.
2.2 NIH grant proposal review data
We consider Preliminary Overall Impact Scores by assigned reviewers who are asked to rate proposals on a scale from 1 (best) to 9 (worst) using whole numbers. Unlike the final Overall Impact Scores that are only assigned to NIH applications that reach the panel discussion stage, Preliminary Overall Impact Scores are given to all applications submitted to the NIH. Because the NIH instructions say ‘[t]he entire scale should always be considered’ (NIH Staff, 2012), and since the entire scale covers the complete range of submissions, NIH reviewers are asked to score applications by indirect comparison to the complete range of submissions. The instructions also note that ‘a reviewer should not assume that the applications assigned to him/her necessarily cover that entire range of scores, and should assign scores as appropriate for the work or science proposed’ (NIH Staff, 2012).
Our NIH grant peer review data is a random sample of 2076 applications (about 3.8%) from a full set of R01 applications submitted to NIH during council years 2014–2016 by black and white PIs and reviewed by the Center for Scientific Review, an NIH entity which reviews about 90% of the R01 NIH applications. This random sample comes from the published data associated with a study on NIH peer-review (Erosheva et al., 2020). In this data set, the average number of reviewers per application is 2.79, and the number of available reviews per application ranges from one to five, with most applications having ratings from three reviewers. Some applications may have had additional reviewer ratings that were not included in this sample due to concerns for protecting reviewer privacy and confidentiality in the original study that are unrelated to perceived application quality. Please consult Erosheva et al. (2020) and the Supplement for more details on the data.
3 DEFINITION AND ESTIMATION OF INTER-RATER RELIABILITY
Inter-rater reliability is defined as the proportion of variance attributable to the object of measurement as in the intra-class correlation coefficient (McGraw & Wong, 1996). There are various ways to specify the total variation and hence to compute IRR; see McGraw and Wong (1996) for the general overview. For our illustration, to provide direct comparison with recent findings, we rely on a hierarchical linear model with the one-way analysis of variance or mixed effects model, the same specification as used by Pier et al. (2018).
Let be rating i given to grant proposal j, j = 1, …, J. Throughout the paper, and without loss of generality, we assume that each grant proposal is reviewed by exactly n reviewers, that is, i = 1, …, n. The relevant mixed effects model is
where μ is the overall mean, is a random effect of grant application j, and is a random error term for rating i on application j. We make standard assumptions in that are independent and identically distributed ; are independent and identically distributed , and are independent of .
We note that model (1) is simple in that it ignores further possibilities such as leniency or harshness of individual reviewer scoring (e.g. Johnson, 2008), other possible sources of variation such as clustering by review panel, and applicant or reviewer characteristics which may be able to explain some of the variability in ratings (e.g. Erosheva et al., 2020), and may even lead to between-group differences in IRR (Bartoš et al., 2020; Martinková et al., 2018). These more complex models could be estimated given the appropriate data; but, that is not the point here.
Given Equation (1), the single-rater IRR is then defined as the ratio of the true variance due to proposals—also known as between-group variance in the terminology of ANOVA or mixed effects models—to the total variance, that is,
Note that, under the model assumptions, is equal to , the correlation between scores of independent reviewers i and given to the same proposal j.
The single-rater IRR is appropriate when decisions of interest, such as declaring proposals suitable for funding, are made on the basis of single-reviewer ratings. When, instead, the average of n reviewer ratings is used for making decisions, it is more appropriate to consider the degree of absolute agreement as measured by the following multiple-rater version of IRR:
Note that increasing the number of reviewers per proposal will always increase the multiple-rater IRR in Equation (3), thus improving the reliability of the corresponding peer review process where the average of n reviewer ratings is used for decisions.
Recommendations, which may vary by scientific field, provide a general idea about acceptable IRR values. For psychological assessment, Cicchetti (1994) provides the following recommendation: IRR values below 0.4, between 0.4 and 0.59, between 0.6 and 0.74, and 0.75 or above are indicative of poor, fair, good, and excellent reliability, respectively. The cut-offs above are simply rules-of-thumb, and therefore should be used with discretion. Also, because the above recommendations are about IRR estimates, uncertainty in IRR values (e.g. in the form of a confidence interval) needs to be taken into account for interpretation.
There are two issues worth noting about estimation of IRR in the context of peer review. First, restricting the range of samples by proxies of quality will necessarily result in lower IRR values than using samples across the full range of proposal quality. This is because restricting the range of proposals by considering only the top (or bottom) portion of the observations will decrease the true score variance . And, as follows from Equations ((2)) and ((3)), with the true score variance going to zero, the IRR will tend to zero as well, when the error variance is fixed.
Second, it is well-known to statisticians that estimation of variance components in mixed effects models is challenging (see, e.g. Pinheiro & Bates, 2006). This estimation is particularly problematic when there are few observations per group (Snijders & Bosker, 1999), which is often the case in peer review where two or three reviewers per grant proposal is common. In this setting of many small groups, it is known that maximum likelihood estimation of the true proposal score variance can result in exactly zero estimates even when the true value of the between-group variance is not zero (Raudenbush, 2008).
Suppose J applications are rated by n reviewers each. If is the ith observed score for application j, is the average rating for application j, is the overall average rating,
are the between-application sum of squared deviations and the mean square, and
are the within-application sum of squared deviations and the corresponding mean square, then maximum likelihood (ML) estimates of the variance components can be written as (see, e.g. Searle et al., 2006)
Similarly, with restricted maximum likelihood (REML), which is another commonly used likelihood-based estimation method, the variance estimates are
From the above formulae, it is clear that both REML and ML estimation result in a zero estimate of whenever the observed between-application mean squares are small as compared to the within-application mean squares. Zero estimates will in turn give precisely zero estimates of IRR for both single- and multiple-reviewer cases.
Bayesian estimation approaches have been shown to remedy this problem of the highly skewed likelihood surface resulting in zero marginal estimates of (e.g. Draper, 2008). Bayesian estimation places prior distributions on model parameters and relies on integration over the parameter space rather than a likelihood maximization, which makes it successful in avoiding zero estimates when the true variance value is not zero (Browne et al., 2006). Because conjugate analysis of the variance components models is impossible, no closed form Bayesian estimates can be provided and Markov chain Monte Carlo (MCMC) methods need to be used for computation (Draper, 2008, p.94).
4 ILLUSTRATION: INTER-RATER RELIABILITY IN AIBS AND NIH REVIEW
In this section, we use original scientific merit review scores from AIBS and NIH reviewers to illustrate the issue of range-restricted IRR and the difficulties with maximum likelihood estimation that were introduced in Section 3. Following Pier et al. (2018), we estimate IRR with the default REML estimation implemented in package lme4 (Bates et al., 2015) in R (R Core Team, 2019). To obtain confidence intervals for IRR, we rely on a model-based semi-parametric bootstrap implemented in function bootMer() (Bates et al., 2015) as in Martinková et al. (2018).
For the Bayesian analysis, we obtain estimates and uncertainty intervals (Gelman et al., 2013) of IRR using default settings for MCMC procedures implemented in Stan (Gelman et al., 2015). Priors for variance parameters were set to default half-t distribution with 3 degrees of freedom and a scaling parameter of 2.5 (Bürkner et al., 2017). For exact specifications, please see the Supplement.
4.1 Range-restricted versus global inter-rater reliability
To obtain range-restricted IRR estimates for subsets of top quality proposals, we first rank the proposals by the average rating of the assigned reviewers. When the average rating is the same, we order proposals by the worst (highest) rating. This ordering reflects earlier findings in peer review that after panel discussion proposal scores are more likely to get closer to their worse scores before discussion than to their better scores (Carpenter et al., 2015; Fleurence et al., 2014; Martin et al., 2010). However, a particular ordering choice among proposals with the same average rating is not crucial for our purposes because this ordering choice may only impact IRR calculation within same average-rating bands.
Figure 1 presents observed ratings for ordered AIBS and NIH applications. Despite vastly different sample sizes (72 vs. 2076) and different rating scales (1 to 5 with increments of 0.1 vs. 1 to 9 with whole number increments), the shape of the average ratings across the two complete sets of proposals is remarkably similar. In both cases, we observe substantial reviewer disagreement within proposals, especially in the middle range, along with short bands of proposals where all reviewers were in perfect agreement (gave exactly the same scores). For both, AIBS and NIH reviews, reviewers utilized the best possible score on the scale but were reluctant to utilize the worst score.
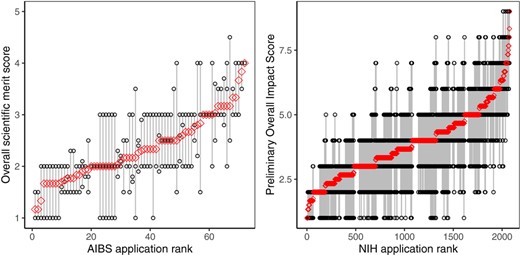
Average (red circle) and individual reviewer (black circle) overall scores by application for AIBS (left panel, 72 proposals) and NIH (right panel, 2076 proposals) peer review data. Applications are ordered by the average score, from the best (smallest) to the worst (largest), taking into account the worst rating in case of ties
Having established the order by perceived quality, we illustrate IRR calculations when various percentiles of the highest (Figure 2) and the lowest quality proposals (Figure 3) are considered. Figure 2 provides REML and Bayesian estimates and the associated uncertainty intervals for single-rater IRR () for a given percentage of top quality proposals in AIBS and NIH data. Overall, the observed patterns in local estimates are strikingly similar across the two data sets. It is clear that, when fractions of the highest quality proposals are considered, local estimates are lower than the global estimates. Moreover, in both data sets, REML IRR estimates are almost exactly zero when less than 74% of the highest quality proposals are considered. These estimates are exactly zero for AIBS data and exactly zero for NIH data when less than 69% of the highest quality proposals are considered. For AIBS data, due to the smaller sample size of 72 applications total, we see substantial uncertainty in both REML and Bayesian estimates. In addition, for AIBS data, when less than 30% of top-quality submissions are considered, we observe that Bayesian estimates are impacted by the prior. Given that NIH data has a total of 2076 proposals, the uncertainty intervals are much more narrow and Bayesian IRR estimates are always similar to the REML IRR estimates, yet never exactly zero.
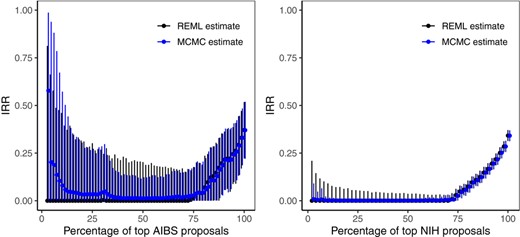
REML (black) and Bayesian (blue) estimates and the associated 95% bootstrap and MCMC uncertainty intervals for single-rater IRR calculated from a given percentage of top quality proposals for AIBS (left panel) and NIH (right panel) peer review data
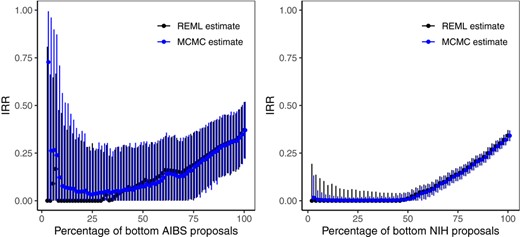
REML (black) and Bayesian (blue) estimates and the associated 95% bootstrap and MCMC uncertainty intervals for single-rater IRR calculated from a given percentage of bottom quality proposals for AIBS (left panel) and NIH (right panel) peer review data
Analogously to subsets of top-quality proposals, range-restricted estimates for subsets of the lowest quality proposals are lower for subsets of narrower quality, and are zero or nearly zero for the bottom end (Figure 3). However, in contrast with Figure 2 where IRR increased only after 75% of the highest proposals were considered, bottom-up local IRR estimates begin to increase after more than 40% of the lowest quality proposals are considered for AIBS and more than 45% for the NIH data. Thus, zero local IRR estimates of preliminary (before-discussion) peer review scores are more likely when subsets of top-quality rather than bottom-quality proposals are considered.
Considering all available applications across the complete submission ranges, for AIBS data the global REML estimate is 0.37 with a 95% CI of (0.22,0.52) and the Bayesian estimate is almost identical. For the NIH data both the REML and the Bayesian global estimates are 0.34 with a 95% CI of (0.31,0.37). When decisions are made based on the average rating over three reviewers, the multiple-rater estimate is more appropriate. For the AIBS data, the estimate is 0.64 with a 95% CI (0.46,0.76). For the NIH data, the estimate is 0.61 with a 95% CI of (0.58,0.64). These global IRR values indicate good reviewer agreement and are remarkably similar between the two data sets despite different measurement scales.
4.2 Zero inter-rater reliability estimates
The most obvious explanation for the many zero estimates in Figures 2 and 3 is that, when our consideration is limited to proposals of similar quality, the observed between-proposal mean squares are small as compared to the within-proposal mean squares as evident from Figure 1. As explained in Section 3, this situation results in a zero estimate which will in turn give zero IRR estimates for both single and multiple-reviewer cases. However, it is also important to point out that, in case of many small groups with two to three reviewers per proposal, the behavior of the likelihood for can be such that it would make it plausible to obtain zero estimates for even when the true between-group variance is not zero.
To further illustrate the difficulties with maximum likelihood estimation in the case of many small groups, we consider a scenario that is analogous to the one shown in figures 5.4–5.5 of Raudenbush (2008) who demonstrates that the likelihood for between-group variance can become quite positively skewed when there are few observations per group. In Figure 4, the solid black line provides the ideal scenario: the likelihood function for between-application variance when the observed between-application variability is exactly equal to its expected value. The dashed line provides the likelihood function for between-application variance when the observed between-application variability is set to a value just one standard deviation below the expected, a scenario which could easily arise in practice. For this illustration, we use settings derived from AIBS data. We chose J = 55 top proposals because it corresponds to one of the lowest fractions of top-quality proposals for which the REML estimate of is not zero. We use and for the true values of the corresponding between-group and residual variances. Finally, we use n = 3 as in AIBS data which is also the typical number of reviewers for NIH (e.g. Hoppe et al., 2019; Lindner & Nakamura, 2015). One can see that, in the less favourable but still quite likely occurrence, the ML estimate for the within-group variance would be zero. Hence, the IRR estimate would also be zero. We emphasize the ML variance-estimation problems pointed out by Raudenbush (2008) are related more to having very few reviewers per proposal than to having a small sample size in terms of the total number of proposals.
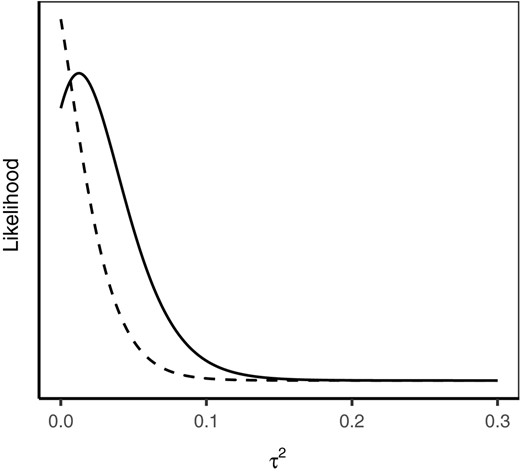
Likelihood functions, up to multiplicative constants, for between-group variance when observed between-group variability is exactly equal to its expected value (solid line) and when observed between-group variability is equal to a value that is one standard deviation below its expected value (dashed line)
This example presents an additional consideration related to estimation difficulties that is important to keep in mind when one obtains zero estimates for IRR. We should note that this consideration comes into play only when between-proposal variance is somewhat large as compared to within-proposal variance which, as Figure 1 illustrates, may not be the case for many range-restricted subsets of top quality applications in grant peer review. However, in contrast to our study, researchers who only have access to one particular range-restricted sample of grant applications may not be able to determine whether their zero IRR findings are driven by low between-proposal variance or solely by estimation difficulties.
5 DISCUSSION
This paper considers the common practice of using IRR for assessing peer review quality and brings awareness to two important issues concerning IRR estimates that could potentially result in misleading conclusions. These are range-restricted samples and the poor behaviour of IRR estimates when dealing with a small number of reviewers per proposal.
Our analyses of peer review scores from NIH and AIBS applications across the complete range of quality indicate that peer review reliability is good with three reviewers, according to the cut-offs suggested by Cicchetti (1994). In both cases, these analyses rely on reviewer assessments done before panel discussion that are intended to indicate where an application falls among all practically possible submissions. The IRR estimates are similar for both data sets and are certainly not zero despite the fact that the scales are different; AIBS scores are on a 1 to 5 scale with 0.1 increments, while NIH scores are on a 1 to 9 scale with whole number increments. However, we also demonstrate that, in both data sets, subsets of top- and bottom-quality proposals will necessarily have lower IRR estimates that are likely to be zero in many scenarios.
The point about IRR estimates from range-restricted data being smaller than the global IRR estimate is not new (see, e.g. Hallgren, 2012). In peer review, this point has been previously noted by Jayasinghe et al. (2001, p.350) and Jayasinghe et al. (2003, p.297) and, in the context of the predictive validity of grant review, analogous concerns about drawing conclusions from range-restricted data have been made by Lindner and Nakamura (2015, p.5). It should also be noted that, although corrections can be applied to range-restricted reliability estimates in order to produce global reliability estimates (Lord & Novick, 2008), these corrections assume that (a) true scores and error variances remain independent across the range restriction and (b) the local error variance after range-restriction is the same as the global one. Fife et al. (2012) use simulation studies to show that, when these assumptions are violated—which is most likely the case in peer review settings (e.g. see Figure 1)—range-restricted reliability estimates suffer from biases and imprecision that are more substantial than being due simply to the reduction in sample size.
However, to our knowledge, our paper is the first to demonstrate the extent to which range-restriction is likely to produce zero IRR estimates in peer review: local IRR estimates are zero when less than 70% of top-quality and less than 45% of bottom-quality proposals are considered. Relatively wide ranges of scores assigned to the same proposal (see Figure 1) are largely responsible for zero local IRR estimates obtained from subsets of top- and bottom-quality proposals. Such disagreements among reviewers are consistent with a number of possibilities. As mentioned before, programme officers may actively seek out diverse forms of expertise and opinion when evaluating submissions, which could lead to more diverse viewpoints related to differences in reviewer experience and training (Hargens & Herting, 1990; Lee, 2012; Sattler et al., 2015). In addition, differences in scoring tendencies among reviewers such as leniency or harshness can contribute to greater within-proposal variability in absolute scores (Johnson, 2008). Finally, we note that panel discussion may increase consensus in reviewer scores as compared to scores before discussion (Fleurence et al., 2014).
Independently of possible reasons behind reviewer disagreements, and whether they are thought of as virtue or vice, it is important to point out that zero range-restricted IRR estimates should not be interpreted as indicating complete arbitrariness in peer review as some have claimed (Brezis & Birukou, 2020, p.406). The reason is the questionable validity of range-restricted IRR estimates. Recall, the key function of valid measurement is ‘operationalization and the scoring of cases [that] adequately reflect the concept the researcher seeks to measure’ (Adcock & Collier, 2001). Is it valid to interpret range-restricted IRR when reviewers are asked to score grant proposals across the whole range of submissions? We believe the answer is ‘no’. Global IRR is the only meaningful IRR-type characteristic of a peer review process where reviewers are asked to assign absolute scores to applications by comparing among all practically possible grant submissions. For example, local IRR estimates from our analyses show that reviewers are generally better able to distinguish between bottom-quality than between top-quality proposals. Given high demands on reviewer time and expertise, these findings, however, could be indicative of reviewers being more focused on separating the lowest quality proposals from the rest than on making fine distinctions among proposals of highest quality when asked to compare among practically possible submissions across the complete range. The respective zero IRR estimates from restricted-range data do not imply that reviewers would not have been able to make finer distinctions if they were presented with the more targeted evaluative task of assessing a narrower range of proposal quality.
Some would argue that the common two-tier review system—with assigned reviewers’ ratings used to triage weak proposals and larger panels used to discuss meritorious proposals and identify the superlative from the excellent—is designed specifically to evaluate the quality of top applications. This assumes that reviewers are able to separate the local evaluative task of scoring top applications from the global evaluative task of triaging non-meritorious applications. However, some evidence about reviewer scoring practices suggests that reviewers, and panels as a whole, do not make this evaluative shift: assigned reviewers tend to stick by their initial scores (e.g. Carpenter et al., 2015; Erosheva et al., 2020) and panel members tend to follow assigned reviewers’ scores very closely (Martin et al., 2010). We argue that the two-tier review systems as currently implemented may not be the best option for making fine distinctions among proposals of top quality. This view is in agreement with the literature on performance appraisal which underscores that the purpose for which an appraisal is conducted has direct impact on ratings (DeNisi et al., 1984); this literature also points out that aims to satisfy different goals with one appraisal instrument represent ‘one source for the continuing evidence of dissatisfaction with performance appraisal in organizations’ (Adler et al., 2016, p.229). Separating the global from the local evaluative task, whether by using different instruments such as comparative judgements as opposed to ratings (Shah et al., 2018), providing better reviewer training, or inviting separate reviewers at each stage, if implemented in practice, could result in better resolving power for applications in the top range. The narrower focus would reduce the cognitive burden and, in turn, could allow for better judgment on important decisions. A research study examining these questions by comparing different review systems may be most helpful.
A more radical lesson one could draw is to recommend against using IRR for assessing peer review quality. Although IRR is intuitive because it can be understood as a correlation between scores of two independent reviewers of the same proposal, as we demonstrate in this paper, it is not straightforward to use in practice in a typical peer review setting, and can be misleading when used for assessing peer review quality under a restricted range of submissions. Because IRR is a ratio of two variances that are themselves a challenge to estimate (see, e.g. Pinheiro & Bates, 2006), it is important to remember that, with maximum likelihood, it is possible to obtain an estimate of zero for between-group variance in the case of many small groups even when the true variance is not zero, a behaviour that has been referred to as a ‘threat to valid statistical inference’ (Raudenbush, 2008, pp.225). One simple alternative, suggested by a reviewer of this paper, could be to focus on estimating , the within-group variance. When the rating scale is well understood, can be interpreted as the level of “noise” in reviewer ratings that is unrelated to the proposal quality. An informative and fair peer review would then have not larger than a certain fraction of the rating range and be similar across important demographic characteristics such as gender and race. Likewise, if the focus of peer review is strictly on selecting fundable (top) proposals, other statistics can be suggested. For example, if scores of 3 and above are considered as fundable, one could estimate the probability of a proposal with a true underlying quality score of 3.5 receiving the average of scores from three reviewers of at least 3 under a given model. Such a statistic would be easily interpretable within the context of the peer review process: for example, if this probability is 0.75, it would mean that proposals with a true quality score of 3.5 have about a 25% chance of being considered not fundable in a given review round. It is plausible to define other statistics in this fashion that the scientific community and funding agencies may find even more meaningful.
At a time of great debate about whether grant peer review merits the enormous costs it imposes on applicants, reviewers, and funding agencies (Bollen et al., 2014; Fang & Casadevall, 2014; Fang et al., 2016; Gordon & Poulin, 2009; Graves et al., 2011; Greenberg, 1999; Gross & Bergstrom, 2019), it is critical for funding agencies to better utilize statistical thinking when evaluating the plurality of opinions in the debate on the future of grant peer review (Johnson, 2008; Lauer & Nakamura, 2015). Evaluating whether peer review is asked to work ‘at a level of discernment that exceeds the ‘resolving power’ of the evaluation instrument’ (Chubin et al., 1990) requires both proper uses of existing methods including the IRR, statistical modelling of outcomes at different stages of review including scores before discussion (Erosheva et al., 2020; Hoppe et al., 2019), as well as comprehensive statistical methodology appropriate for analyses and quality control of peer review processes—a complex and multi-layered system—as a whole.
Supporting Information
Additional supporting information may be found online in the Supporting Information section.
ACKNOWLEDGEMENTS
The authors thank Stephen Gallo and the American Institute of Biological Sciences for the data used in this article, František Bartoš for research assistance, and Jan Netík and Adéla Hladká for assistance with implementing the restricted-range reliability functionalities into the R package and interactive Shiny application ShinyItemAnalysis. This work was funded by NSF grant #1759825 awarded to EE (PI) and CL (co-PI). PM was partly supported by the long-term strategic development financing of the Institute of Computer Science (Czech Academy of Sciences: RVO 67985807), the Czech Science Foundation Grant 21-03658S, and COST Action TD1306 “New frontiers of peer review” (www.peere.org). The authors are grateful to the School of Social Work and the Center for Statistics and the Social Sciences, University of Washington, for sponsoring this article’s open access license.
