


Abstract
The aim of this study was to analyse the clinical features of prostate-specific antigen (PSA) bounce and the difference between biochemical failure and large-magnitude PSA bounce. The cases of 352 patients with prostate cancer who underwent brachytherapy were analysed. PSA bounce was defined as an increase in PSA of ≥0.2 ng/ml above an initial PSA nadir, with subsequent decline to or below that initial nadir without treatment. PSA bounce +2 was defined as an increase in PSA of ≥2.0 ng/ml above the nadir with subsequent decline to or below that initial nadir without treatment. We analysed the rates, time to onset, and predictive factors for PSA bounce and PSA bounce +2. The median follow-up period at the time of evaluation was 82 months. One hundred and seventeen patients had PSA bounce; of them, 10 had PSA bounce +2. Biochemical failure occurred in 29 patients. The median times to onset of PSA bounce, PSA bounce +2, and biochemical failure were 20, 17.5 and 51 months, respectively. Younger age at implant and larger prostate volume were significant predictive factors for PSA bounce. Age was a significant factor for PSA bounce +2, and PSA bounce +2 patients were significantly younger than biochemical failure patients. The maximum duration from the date of PSA bounce +2 to the date when PSA level decreased was 12 months. Age at implant, time to onset, and 1-year follow-up after an increase in PSA level of ≥2 ng/ml above nadir level are useful for distinguishing between biochemical failure and PSA bounce +2.
INTRODUCTION
Brachytherapy (BT) is a well-established standard treatment option for localized prostate cancer [1–3]. Prostate-specific antigen (PSA) is a sensitive indicator of prostate cancer treatment outcomes. Temporary increases in PSA levels after treatment are common, occurring in 15–84% of men receiving 125I BT [4]. This phenomenon is termed PSA bounce, which is defined as a transient increase in PSA, and a subsequent decrease without intervention [5]. However, the PSA threshold value of PSA bounce is variable. A bounce definition of an increase ≥0.2 ng/ml has been widely used [6–9]. However, it is clinically important to distinguish between biochemical failure and large-magnitude PSA bounce, because a large-magnitude increase in PSA suggests the possibility of relapse for which salvage treatment may be considered. Nevertheless, few studies have investigated large-magnitude PSA bounce [10–12], and most were single-centre studies with several limitations; hence, the predictive factors for PSA bounce with large magnitude remain unclear today.
Therefore, here, we aimed to analyse the clinical features of small- or large-magnitude PSA bounce and identify the differences between biochemical failure and large-magnitude PSA bounce.
MATERIALS AND METHODS
Patients
From March 2004 to December 2014, a total of 406 patients with prostate cancer underwent BT at Hiroshima University Hospital or Hiroshima Prefectural Hospital. The clinical T stage was defined according to Tumor Node Metastasis classification (International Union Against Cancer 7th edition). The risk evaluation was made according to the National Comprehensive Cancer Network (NCCN) risk classification [13] (low risk: T stage ≤ 2a, PSA ≤ 10 ng/ml, or Gleason score ≤ 6; intermediate risk: T stage T2b or T2c, PSA 10–20 ng/ml, or Gleason score 7; high risk: T stage ≥ T3a, PSA ≥ 20, or Gleason score ≥ 8). Patients with a PSA follow-up duration of <3 years without death were excluded from this study. The study protocol was approved by the Human Ethics Review Committee of Hiroshima Prefectural Hospital, and each subject provided written informed consent.
Treatment
Our implant procedure has previously been described in detail [14]. We implanted 125I sources using a modified peripheral-loading pattern for seed placement, using a treatment planning system (Variseed; Varian Medical Systems, Palo Alto, CA, USA). A pre-plan for the implant was generated from a transrectal ultrasound volume study. A transrectal ultrasound–guided transperineal technique under general and spinal anesthesia was used to deliver the sources. The prescribed dose for an implant was 144 Gy when performed as monotherapy, and 110 Gy when performed before external beam radiotherapy. The prescribed dose of the external beam radiotherapy was 45 Gy, with a daily fraction of 1.8 Gy. External beam radiotherapy was combined in patients with a high risk or a part of intermediate risk. Hormone therapy was indicated in patients with a prostate volume of >40 cm3 and in patients at high risk. A post-implant dosimetric analysis was performed using a computed tomography (CT) scan performed 30 days post-implant. Thereafter, we calculated dose–volume histograms, including prostate D90 (dose to 90% of the gland). Prostate D90 is expressed as a percentage of the prescribed dose. PSA measurements after BT were performed every 3 months for the first 3 years, and every 6 months thereafter.
Definitions of PSA bounce
The date of BT was considered to be Day 0 of follow-up. PSA bounce was defined as an increase of ≥0.2 ng/ml above the initial PSA nadir, with a subsequent decline to or below that initial nadir without treatment. Date of bounce was the first date that the PSA level reached ≥0.2 ng/ml above the nadir. PSA bounce +2 was defined as a PSA increase of ≥2.0 ng/ml above the nadir, while the date of PSA bounce +2 was defined as the first date on which the increase occurred. Biochemical failure after BT was determined using the American Society for Therapeutic Radiology and Oncology (ASTRO) Phoenix definition (nadir +2 ng/ml except for PSA bounce +2) [15]. Date of biochemical failure was defined as the first date on which the PSA level was >2.0 ng/ml above the nadir.
Statistical analysis
Univariate analyses using the Mantel–Haenszel χ2 test or Student’s t-test were performed to determine the statistical significance of differences between patients with PSA bounce or PSA bounce +2 and patients without PSA bounce, and between patients with PSA bounce +2 and patients with biochemical failure. Investigated factors included age at BT, initial PSA, T stage, biopsy Gleason score, pre-implant prostate volume on ultrasound, NCCN risk classification, hormonal therapy, external beam radiotherapy, and prostate D90. A stepwise method and multiple regression analysis were used as multivariate analyses for detecting significant factors. The Kaplan–Meier method was used to calculate the overall survival (OS) and biochemical relapse-free (bRF) rate. The OS was calculated from the BT start date to the date of the final follow-up or death. The bRF was estimated from the BT start date until the date of biochemical failure. Ekuseru-Toukei 2015 (version 1.02; Social Survey Research Information Co., Ltd, Tokyo, Japan) was used to perform the statistical analyses. Statistical significance was defined as P < 0.05.
RESULTS
Patients
Of the 406 patients who underwent BT, 54 were excluded because their PSA follow-up durations were <3 years without death. Therefore, 352 patients were enrolled in this study. The characteristics of the eligible patients are summarized in Table 1. The median follow-up period at the time of evaluation was 82 months (range, 12–157 months).
Patient characteristics
| Total | |
|---|---|
| n = 352 | |
| Age in years at implant, median (range) | 69 (49–82) |
| T stage, n (%) | |
| T1c | 240 (68.2%) |
| T2a | 83 (23.6%) |
| T2b or T2c | 25 (7.1%) |
| T3a | 4 (1.1%) |
| Pretreatment PSA level, ng/ml, median (range) | 6.50 (0.84–52.50) |
| ≤10, n (%) | 284 (80.7%) |
| 10–20, n (%) | 54 (15.3%) |
| ≥20, n (%) | 14 (4.0%) |
| Gleason score, n (%) | |
| ≤6 | 195 (55.4%) |
| 7 | 139 (39.5%) |
| ≥8 | 18 (5.1%) |
| Risk group incidence, n (%) | |
| Low | 166 (47.2%) |
| Intermediate | 155 (44.0%) |
| High | 31 (8.8%) |
| Pretreatment prostate volume, cm3, median (range) | 25.4 (7.0–51.0) |
| Hormone therapy, n (%) | |
| Yes | 129 (36.6%) |
| No | 223 (63.4%) |
| External beam radiotherapy, n (%) | |
| Yes | 75 (21.3%) |
| No | 277 (78.7%) |
| Number of implanted seeds, median (range) | 65 (34–96) |
| D90, %, median (range) | 114.8 (73.7–175.0) |
Treatment outcomes
Figure 1 shows the OS and bRF rates. The 5- and 7-year OS rates were 96.3% [95% confidence interval (CI), 94.2–98.4% and 93.9% (95% CI, 91.1–96.8%), respectively. During the follow-up period, 26 (7.4%) patients died; five (1.4%) died of prostate cancer and 21 (6%) died of other diseases. The 5- and 7-year bRF rates were 94.2% (95% CI, 91.6–96.7%) and 89.9% (95% CI, 86.2–93.6%), respectively. Biochemical failure was seen in 29 patients (8.2%); of them, 12 (3.4%) had clinically detectable recurrence. One hundred and seventeen (33.2%) had PSA bounce. The median time to PSA bounce onset was 20 months (3–55 months; Fig. 2). More than 90% of those patients experienced PSA bounce within 30 months. The PSA bounce maximum magnitude is shown in Fig. 3. Ten (2.8%) had PSA bounce +2.
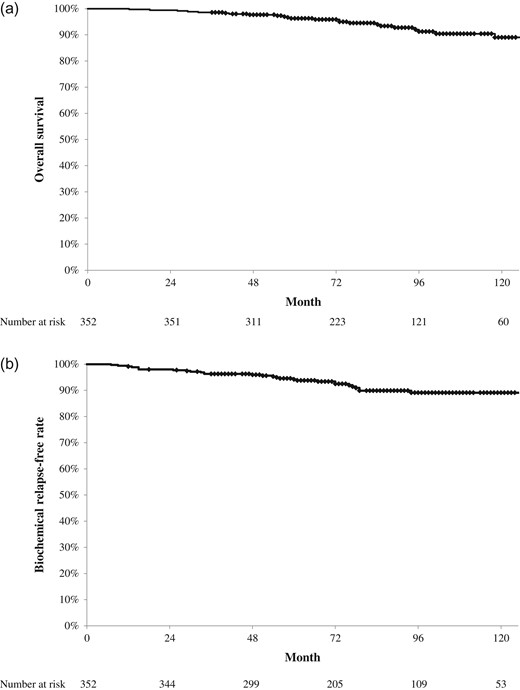
Treatment results of brachytherapy for prostate cancer. (a) Overall survival rate. The 5- and 7-year overall survival rates were 96.3% and 93.9%, respectively. (b) Biochemical relapse-free survival rate. The 5- and 7-year biochemical relapse-free rates were 94.2% and 89.9%, respectively.
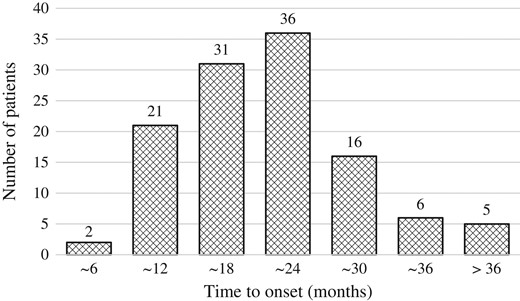
Distribution of the time from brachytherapy to a prostate-specific antigen increase of ≥0.2 ng/ml.
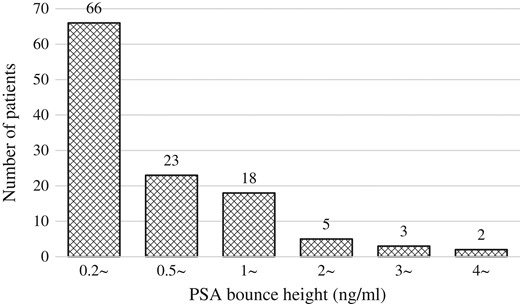
Distribution of maximum magnitude of prostate-specific antigen bounce.
Comparison of the whole cohort (excluding PSA bounce) and PSA bounce
Table 2 summarizes the characteristics of the whole cohort and of patients with PSA bounce. Age at implant (P < 0.001), T stage (P = 0.034), pretreatment PSA level (P < 0.001), and pretreatment prostate volume (P = 0.001) differed significantly between the whole cohort and patients with PSA bounce on univariate analysis (Table 3), while age at implant (P < 0.001) and pretreatment prostate volume (P = 0.008) remained significant on multivariate analysis. The median duration from the date of PSA bounce to the date when PSA level decreased was 3 months (2–18 months). Almost 90% of patients with PSA bounce had a decreased PSA level within 6 months (Fig. 4).
Comparison of the whole cohort (excluding PSA bounce) with PSA bounce or PSA bounce +2
| Whole cohort | PSA bounce | PSA bounce +2 | |
|---|---|---|---|
| n = 235 | n = 117 | n = 10 | |
| Age at implant, years, median (range) | 71 (52–80) | 65 (49–82) | 61 (57–67) |
| T stage, n (%) | |||
| T1c | 151 (64.3%) | 89 (76.1%) | 10 (100%) |
| T2a | 61 (26.0%) | 22 (18.8%) | 0 |
| T2b or T2c | 19 (8.0%) | 6 (5.1%) | 0 |
| T3a | 4 (1.7%) | 0 | 0 |
| Pretreatment PSA level, ng/ml, median (range) | 7.3 (0.84–52.50) | 5.90 (3.5–29) | 5.51 (4–7.12) |
| ≤10, n (%) | 181 (77.0%) | 103 (88.0%) | 10 (100%) |
| 10–20, n (%) | 42 (17.9%) | 12 (10.3%) | 0 |
| ≥20, n (%) | 12 (5.1%) | 2 (1.7%) | 0 |
| Gleason score, n (%) | |||
| ≤6 | 129 (54.9%) | 66 (56.4%) | 7 (70.0%) |
| 7 | 90 (38.3%) | 49 (41.9%) | 3 (30.0%) |
| ≥8 | 16 (6.8%) | 2 (1.7%) | 0 |
| Risk group incidence, n (%) | |||
| Low | 106 (45.1%) | 60 (51.3%) | 7 (70.0%) |
| Intermediate | 102 (43.4%) | 53 (45.3%) | 3 (30.0%) |
| High | 27 (11.5%) | 4 (3.4%) | 0 |
| Pretreatment prostate volume, cm3, median (range) | 23.9 (7.0–51.0) | 26.9 (11.3–45.8) | 28.3 (21.0–36.9) |
| Hormone therapy, n (%) | |||
| Yes | 93 (39.6%) | 36 (30.8%) | 3 (30.0%) |
| No | 142 (60.4%) | 81 (69.2%) | 7 (70.0%) |
| External beam radiotherapy, n (%) | |||
| Yes | 54 (23.0%) | 21 (17.9%) | 0 |
| No | 181 (77.0%) | 96 (82.1%) | 10 (100%) |
| Number of implanted seeds, median (range) | 65 (34–95) | 66 (42–96) | 69 (60–83) |
| D90, %, median (range) | 114.6 (79.3–175.0) | 115.4 (73.7–159.8) | 113.2 (92.9–124.3) |
Predictive factors; univariate and multivariate analysis
| Whole cohort vs PSA bounce | Whole cohort vs PSA bounce +2 | |||
|---|---|---|---|---|
| Univariate analysis | Multivariate analysis | Univariate analysis | Multivariate analysis | |
| P value | P value | P value | P value | |
| Age at implant | <0.001 | <0.001 | <0.001 | <0.001 |
| T stage (T1c vs ≥T2a) | 0.034 | 0.352 | 0.020 | 0.371 |
| Pretreatment PSA level | <0.001 | 0.057 | <0.001 | 0.211 |
| Gleason score (≤6 vs ≥7) | 0.876 | 0.347 | ||
| Risk group incidence (Low vs Intermediate or High) | 0.327 | 0.122 | ||
| Pretreatment prostate volume | 0.001 | 0.008 | 0.070 | |
| Hormone therapy (Yes or No) | 0.134 | 0.544 | ||
| External beam radiotherapy (Yes or No) | 0.074 | 0.086 | ||
| D90 | 0.953 | 0.654 | ||
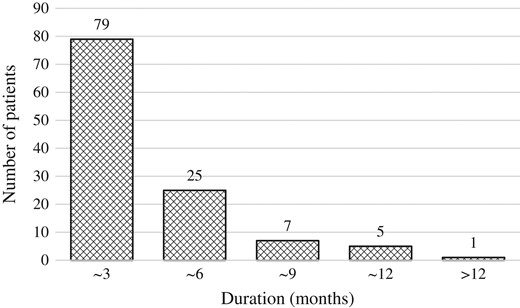
Duration from the date of PSA bounce to the date when PSA level decreased.
Comparison between whole cohort (excluding PSA bounce) and PSA bounce +2
Table 2 summarizes the characteristics of the whole cohort and of patients with PSA bounce +2. Age at implant (P < 0.001), T stage (P < 0.001), and pretreatment PSA level (P = 0.020) differed significantly between the whole cohort and patients with PSA bounce +2 on univariate analysis (Table 3), while age at implant (P < 0.001) remained significant on multivariate analysis. In addition, patients with PSA bounce +2 were significantly younger than patients with biochemical failure (P < 0.001).
The median time to onset were 51 months (7–94 months) and 17.5 months (12–42 months) in patients with biochemical failure and PSA bounce +2, respectively. The time to onset was significantly earlier in patients with PSA bounce +2 than in patients with biochemical failure (P = 0.014). The median duration from the date of PSA bounce +2 to the date when PSA level decreased was 4.5 months (3–12 months) (Fig. 5).
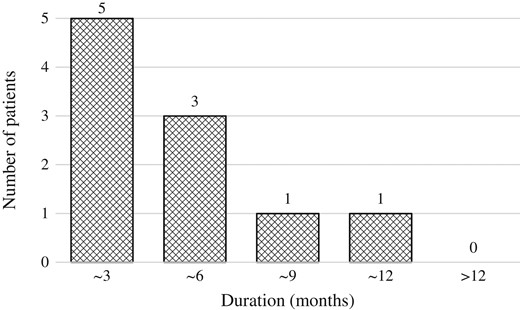
Duration from the date of PSA bounce +2 to the date when PSA level decreased.
DISCUSSION
PSA bounce was first described in detail by Wallner et al. [5]. PSA bounce is observed at a 15–84% incidence after BT. The frequency of PSA bounce depends on the definition. Some studies with definitions similar to ours reported that PSA bounce was observed at a 30.1–37% frequency after BT [6–9], equivalent to our result. The median time to onset was also similar between these studies and our results (median, 14.8–19.2 months). Several studies reported that younger age was the predictive factor for PSA bounce [6, 7, 9]. In this study, younger age at implant was a significant predictive factor for PSA bounce, as in other reports. On the other hand, pretreatment prostate volume was also a significant predictive factor for PSA bounce in our study, but few studies detected pretreatment prostate volume as the predictive factor [16]. However, several studies reported that the median pretreatment prostate volume in PSA bounce patients was larger than that in other patients [8, 11]. Therefore, we should carefully follow-up young patients with a high pretreatment prostate volume, looking out for the possibility of PSA bounce.
According to the ASTRO Phoenix definition, biochemical failure after BT is defined as nadir +2 ng/ml [15]. When patients who meet biochemical failure criteria are observed, we must distinguish PSA bounce +2 from biochemical failure to ensure accurate estimates of treatment efficacy and avoid unnecessary salvage treatments. However, few studies have investigated large-magnitude PSA bounce [10–12], and the predictive factors for PSA bounce +2 are unclear. In addition, a sufficient follow-up duration is needed in order to distinguish PSA bounce +2 from biochemical failure. Kanzaki et al. investigated the helpful factors for distinguishing biochemical failure from large-magnitude PSA bounce [12]. Nevertheless, they did not identify a significant predictive factor. We think one of the reasons for this is the small sample size due to the single-centre design. In this two-institution study, age at implant was a significant predictive factor for PSA bounce +2. Thompson et al. mentioned that PSA bounce +2 patients were significantly younger than those with biochemical failure, as we also found [10]. Therefore, as mentioned above, younger age is a predictive factor for PSA bounce and PSA bounce +2.
Several guidelines for follow-up after BT for prostate cancer have been described [17, 18]. However, these studies do not mention the factors that distinguish biochemical failure from PSA bounce. When we observe a PSA level of ≥2 ng/ml above the nadir, we check for the presence or absence of recurrence lesions by imaging diagnostic methods, including CT and bone scan. If the increase in PSA levels continues without detectable recurrence lesions, we discuss whether we are observing biochemical failure or PSA bounce, and whether salvage treatment is needed. In this study, the median duration from the date of PSA bounce +2 to the date when the PSA level decreased was 4.5 months, while the maximum duration was 1 year. Sagalovich et al. evaluated the impact of timing of androgen deprivation therapy on survival in a cohort of patients with biochemical failure after BT for prostate cancer [19], but identified no significant difference in survival between immediate and delayed salvage hormonal therapy. The median delay till salvage androgen deprivation therapy in their study was 19 months. We found that a 1-year follow-up after increasing PSA level of ≥2 ng/ml above the nadir with no evidence of proven recurrence did not affect the prognosis of prostate cancer patients. In addition, the time to onset was significantly earlier in PSA bounce +2 than in biochemical failure, as mentioned in other reports mentioned [10–12]. Therefore, 1 year of additional follow-up was useful for distinguishing between biochemical failure and PSA bounce in cases of an increasing PSA level to ≥2 ng/ml above the nadir in patients who were young, had a short time to onset and no evidence of proven recurrence.
This study had several limitations, including its retrospective design, which introduced potential biases, and its small sample size. Biochemical failure was not always pathologically proven, and 17 patients were diagnosed with recurrence only on the basis of an increasing PSA level. Despite these limitations, we were able to distinguish between biochemical failure and PSA bounce +2.
In conclusion, age at implant was the significant predictive factor for PSA bounce and PSA bounce +2. Early onset and 1 year of follow-up after an increasing PSA level of ≥2 ng/ml above the nadir were useful for distinguishing between biochemical failure and PSA bounce +2.
CONFLICT OF INTEREST
The authors declare that there are no conflicts of interest.
FUNDING
None.
