


Abstract
Prior research in sub-Saharan Africa reports dyslipidemia in perinatally human immunodeficiency virus (HIV)-infected children receiving ritonavir-boosted lopinavir (LPV/r) compared with efavirenz; however, interpretation of findings is limited by lack of comparison data from HIV-uninfected children.
We conducted a cross-sectional analysis of lipid profiles and growth within a larger longitudinal cohort study of perinatally HIV-infected and HIV-uninfected children aged 4–9 years in Johannesburg, South Africa. At enrollment, anthropometrics, viral load, CD4, total cholesterol (TC), high-density lipoprotein, low-density lipoprotein (LDL), and triglycerides were measured. Weight-for-age Z-score (WAZ), height-for-age Z-score (HAZ), and body mass index-for-age Z-score (BAZ) were calculated. United States pediatric thresholds for dyslipidemia were used.
Five hundred fifty-three HIV-infected and 300 HIV-uninfected children (median age 6.9 years) of similar demographic characteristics were enrolled. Of the HIV-infected children, 94.8% were on combination antiretroviral therapy (cART) (65.4% on LPV/r- and 28.6% on efavirenz-based regimens). Among the treated, 94.3% had a viral load <200 copies/mL. Median CD4% was 34.4. The HIV-infected children had lower mean WAZ (−0.7 vs −0.3, P < .01) and HAZ (−1.1 vs −0.7, P < .01) compared with HIV-uninfected children. A lower proportion of HIV-infected children were overweight (BAZ >1) compared with HIV-uninfected children (14.4% vs 21.7%, P = .04). Whether on LPV/r or efavirenz, a higher proportion of HIV-infected children had borderline/elevated TC or abnormal triglycerides than HIV-uninfected children, although a higher proportion of those on LPV/r had borderline/elevated TC, borderline/elevated LDL, or abnormal triglycerides than those on efavirenz.
In a South African cohort of HIV-infected children and population-appropriate HIV-uninfected children, unfavorable alterations in lipid profiles were detected in HIV-infected children regardless of treatment regimen compared with HIV-uninfected children. The HIV-infected children were of smaller size than HIV-uninfected children, but there was a high prevalence of overweight in both groups. Strategies for optimizing growth and early life management of lipid alterations may be warranted.
Combination antiretroviral therapy (cART) has dramatically reduced mortality among human immunodeficiency virus (HIV)-infected children [1–3]. With increased survival, long-term outcomes have emerged as important areas of research, particularly in sub-Saharan Africa, where 90% of HIV-infected children live [4]. Although cART greatly improves the growth of HIV-infected children, a number of studies from low- and middle-income countries (LMIC) demonstrate that growth often remains impaired [5–9]. Poor growth can indicate failure of cART and is a risk factor for early mortality [10–12], long-term economic consequences, as well as adult life morbidity and mortality [13]. Because few studies of HIV-infected children in LMIC have included HIV-uninfected comparison groups, the contribution of background factors to poor growth, such as undernutrition and enteric infections [14, 15], from those related to HIV or HIV treatments [5–8] are largely unknown.
In addition to questions regarding growth in HIV-infected children in LMIC, the impact of cART on metabolic abnormalities and body composition also warrants further study. Lipodystrophy [16, 17] and dyslipidemia, including elevated levels of total cholesterol (TC), low-density lipoprotein (LDL), and triglycerides, are reported among HIV-infected children in association with protease inhibitor (PI) use [17–25]. Nonnucleoside reverse-transcriptase inhibitors (NNRTIs) have also been implicated [19, 24, 26], as has the nucleoside reverse-transcriptase inhibitor stavudine in adults [27, 28]. We recently reported a high prevalence of dyslipidemia among South African HIV-infected children on cART [20, 29], including elevated TC and triglycerides especially among children maintained on a PI compared with those switched to NNRTI-based cART. However, as is the case with many prior studies conducted in sub-Saharan Africa, due to the lack of an HIV-uninfected comparison group, we were unable to distinguish the risk of dyslipidemia due to HIV or cART from those related to underlying socioeconomic and genetic factors [30, 31].
The aim of this study was to compare the lipid profiles, growth, and body composition of HIV-infected children, stratified by treatment regimen, to a control group of uninfected children from the same population.
METHODS
Study Sample
This is a cross-sectional analysis of baseline data from Childhood HAART Alterations in Normal Growth, Genes, and aGing Evaluation Study (CHANGES), a longitudinal cohort study of perinatally HIV-infected and HIV-uninfected children aged 4–9 years in Johannesburg, South Africa. The overall purpose of the study is to examine how the effects of early childhood events influence the control of HIV and development of later comorbidities.
Two sites participated in the study: Empilweni Services and Research Unit (ESRU) at Rahima Moosa Mother and Child Hospital and Perinatal HIV Research Unit (PHRU) at Chris Hani Baragwanath Hospital. At ESRU, the study recruited HIV-infected children who had initiated cART before 3 years of age and who had been previously enrolled in 2 clinical trials [32, 33], one of which compared outcomes in children randomized to continue on ritonavir-boosted lopinavir (LPV/r) with children randomized to switch to efavirenz. At PHRU, children receiving care at the site who were previously enrolled in a trial of early treatment and treatment interruption [34, 35] or who had initiated cART under 2 years of age were recruited. A healthy HIV-uninfected control group was recruited from children accessing preventive care at the 2 study sites and from siblings and household members of the HIV-infected study participants. Children with chronic medical conditions or lack of documented negative HIV test result were excluded.
Measurements
Household characteristics and assets were determined during interviews with the childrens’ guardians, including number of rooms and the presence of inside faucet, toilet, electricity, television, radio, refrigerator, computer, and car. Using principal component analysis, these 9 variables were reduced to a single continuous variable, that is, a wealth index [36]. The households were then categorized into the lowest 40%, middle 40%, and highest 20%, by wealth index.
Weight to the nearest 0.1 kilogram and height to nearest 0.1 centimeter were measured by a digital scale and a wall-mounted stadiometer, respectively. Body mass index (BMI) was calculated as weight divided by height squared. Weight-for-age Z-score (WAZ), height-for-age Z-score (HAZ), and BMI-for-age (BAZ) were calculated using the WHO Child Growth Standards [37]. Underweight, stunted, overweight, and obese were defined as WAZ ≤−2, HAZ ≤−2, BAZ >1, and BAZ >2, respectively. The average of 3 measurements each of mid-upper arm circumference, maximum hip circumference (MHC), and mid-waist circumference (MWC) in centimeters using a flexible anthropometric tape measure with spring tension attachment was obtained. Waist-hip ratio (WHR) was defined as MWC divided by MHC. The average of 3 measurements each of bicep, tricep, subscapular, suprailiac, umbilical, and mid-thigh skinfolds in millimeters using a Harpendon caliper (Baty International, West Sussex, UK) was also obtained [38]. Sum of skinfolds, an estimate of total body subcutaneous fat, was computed by adding the 6 skinfolds together. Lean mass and fat mass in the upper arm and upper leg were estimated by using the equations for upper arm fat area and upper arm muscle area developed by Rolland-Cachera et al [39] and adapted for upper leg fat area and upper leg muscle area. Systolic blood pressure (SBP) and diastolic blood pressure (DBP) were measured using a Spot Vital Signs device (Welch Allyn) and categorized as elevated if greater than the 95th percentile for age, sex, and height as per US pediatric standards [40].
In addition, HIV viral load, CD4 percentage, nonfasting TC, high-density lipoprotein (HDL), and triglycerides were measured by COBAS INTEGRA 400 system (Roche Holding AG, Basel, Switzerland). Undetectable viral load was defined as <200 copies/mL. Low-density lipoprotein was calculated using the Friedewald equation [41]. Non-HDL was calculated as TC minus HDL. To allow for comparison with other studies, we used 2 sets of US pediatric guidelines to determine dyslipidemia: the National Cholesterol Education Program Expert Panel on Cholesterol Levels in Children guidelines [42, 43] and the National Heart, Blood, and Lung Institute Expert Panel on Integrated Guidelines for Cardiovascular Health and Risk Reduction in Children and Adolescents (NHBLI) guidelines [44]. The thresholds for abnormal lipids are specified in (Table 3).
Statistical Analysis
Outcomes of the HIV-infected and HIV-uninfected children were compared using Student t tests or Wilcoxon tests for continuous variables and χ2 tests or Fisher’s exact tests for categorical variables with P < .05 as a level of significance. In addition, the HIV-infected children were stratified by treatment regimen. Three group comparisons were performed using analysis of variance and Tukey-Kramer tests. All analyses were repeated stratified by sex. Sum of skinfolds and regional fat and muscle areas were compared among the groups using linear regression while controlling for categorical age, sex, height, and weight. To reduce the probability of Type I error, we used P < .01 as the level of significance for the subgroup analyses. All analyses were performed using SAS version 9.4 (SAS Institute Inc., Cary, NC).
RESULTS
Characteristics
Between February 2013 and August 2014, 553 HIV-infected and 300 HIV-uninfected children between 4 and 9 years old were enrolled. Table 1 shows characteristics of the children at baseline. There were no differences in age or household wealth index between HIV-infected and HIV-uninfected children. Of the HIV-infected children, 524 (94.8%) were on cART—361 (65.4%) on LPV/r- and 158 (28.6%) on efavirenz-based treatment. The remaining were either on nevirapine-based treatment or not currently on cART because their treatment had been interrupted as part of a clinical trial [34, 35]. The distribution of regimens for those on cART is shown in (Figure 1.) Median CD4 percentage was 34.4, and 494 (89.5%) had undetectable plasma HIV ribonucleic acid ([RNA] <200 copies/mL). Of those currently on cART, 493 (94.3%) had HIV RNA <200 copies/mL. Among the HIV-uninfected children, 36.3% were perinatally exposed to HIV.
Enrollment Characteristics of a Cohort of 553 HIV-Infected and 300 HIV-Uninfected Children Aged 4–9 at Two Study Sites in Johannesburg, South Africa
| Characteristic | All (n = 853) | HIV Infected (n = 553) | HIV Uninfected (n = 300) | P Value |
|---|---|---|---|---|
| Site, N (%) | ||||
| ESRU | 433 (50.8) | 283 (51.2) | 150 (50.0) | .7430 |
| PHRU | 420 (49.2) | 270 (48.8) | 150 (50.0) | |
| Age, years, median (IQR) | 6.9 (5.6–7.9) | 6.9 (5.6–7.8) | 7.0 (5.3–8.1) | .7887 |
| Male, N (%) | 417 (48.9) | 255 (46.1) | 162 (54.0) | .0278 |
| Highest Grade Completed by Caregiver, N (%) | ||||
| No school | 8 (0.9) | 3 (0.5) | 5 (1.7) | .0561 |
| 1–7 (any primary school) | 63 (7.4) | 49 (8.9) | 14 (4.7) | |
| 8–11 (any high school) | 392 (46.0) | 249 (45.1) | 143 (47.7) | |
| 12+ (finished high school) | 389 (45.7) | 251 (45.5) | 138 (46.0) | |
| Household Wealth Index | ||||
| Lowest (0%–40%) | 216 (39.2) | 125 (41.7) | .6016 | |
| Middle (40%–80%) | 217 (39.4) | 119 (39.7) | ||
| Highest (80%–100%) | 118 (21.4) | 56 (18.7) | ||
| HIV-1 RNA, copies/mL, among children on cART, N (%) | ||||
| Undetectable (<200) | 493 (94.3) | |||
| 200–1000 | 13 (2.5) | |||
| >1000 | 17 (3.3) | |||
| CD4%, median (IQR) | 34.4 (30.1–39.3) | |||
| Age at ART initiation | ||||
| <6 months | 339 (61.4) | |||
| ≥6 months | 213 (38.6) | |||
Abbreviations: ART, antiretroviral therapy; cART, combination ART; ESRU, Empilweni Services and Research Unit; HIV, human immunodeficiency virus; IQR, interquartile range; PHRU, Perinatal HIV Research Unit; RNA, ribonucleic acid.
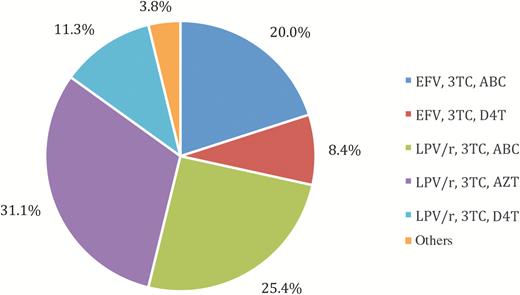
Distribution of regimens for 524 human immunodeficiency virus-infected children on combination antiretroviral therapy aged 4–9 at 2 study sites in Johannesburg, South Africa. ABC, abacavir; AZT, zidovudine; D4T, stavudine; EFV, efavirenz; LPV/r, rotanivir-boosted lopinavir; 3TC, lamivudine.
Growth and Body Composition
Growth outcomes of the cohort are shown in (Table 2). Overall, HIV-infected children were smaller for age than HIV-uninfected children with lower mean WAZ (−0.7 vs −0.3, P < .01) and mean HAZ (−1.1 vs −0.7, P < .01). Although stunting was more prevalent among HIV-infected children compared with HIV-uninfected children (18.4% vs 9.3%, P < .01), few in either group were underweight. Among the HIV-uninfected children, mean WAZ (−0.24 vs −0.37, P = .28) and mean HAZ (−0.74 vs −0.67, P = .52) was not significantly different between those perinatally exposed and not exposed to HIV.
Growth and Body Composition Outcomes of a Cohort of 553 HIV-Infected and 300 HIV-Uninfected Children Aged 4–9 at Two Study Sites in Johannesburg, South Africa
| Measurement | HIV Infected (N = 553) | HIV Uninfected (N = 300) | P Value |
|---|---|---|---|
| WAZ, mean (SD) | −0.7 (1.0) | −0.3 (1.0) | <.0001 |
| WAZ, N (%) | |||
| ≤−2 underweight | 38 (6.9) | 13 (4.3) | .1308 |
| ≥−2 | 512 (93.1) | 287 (95.7) | |
| HAZ, mean (SD) | −1.1 (1.0) | −0.7 (1.0) | <.0001 |
| HAZ, N (%) | |||
| ≤−2 stunted | 101 (18.4) | 28 (9.3) | .0004 |
| ≥−2 | 448 (81.6) | 272 (90.7) | |
| BAZ, mean (SD) | −0.02 (1.0) | 0.1 (1.1) | .0457 |
| BAZ, N (%) | |||
| ≤−2 wasted | 13 (2.4) | 9 (3.0) | .0261 |
| [−2, −1] | 63 (11.5) | 39 (13.0) | |
| [−1, 1] | 394 (71.8) | 187 (62.3) | |
| >1 overweighta | 79 (14.4) | 65 (21.7) | |
| Waist-hip ratio, mean (SD) | 0.91 (0.05) | 0.88 (0.05) | <.0001 |
| Upper arm muscle area, mean (SD)b | 15.9 (2.0) | 16.0 (1.8) | .2767 |
| Upper arm fat area, mean (SD)b | 5.6 (1.9) | 6.4 (1.7) | <.0001 |
| Upper leg muscle area, mean (SD)b | 66.0 (8.2) | 66.6 (7.6) | .8327 |
| Upper leg fat area, mean (SD)b | 15.3 (6.6) | 18.5 (6.0) | <.0001 |
Abbreviations: BAZ, body mass index for age Z-score; HAZ, height-for-age Z-score; HIV, human immunodeficiency virus; SD, standard deviation; WAZ, weight-for-age Z-score.
aTwelve (2.2%) HIV-infected children and 14 (4.7%) HIV-uninfected children were obese (BAZ >2).
bAdjusted for sex, age, height, and weight.
A greater proportion of children on efavirenz-based cART were underweight compared with the HIV-uninfected children (10.8% vs 4.3%, P < .01). Compared with those on LPV/r, children on efavirenz-based cART were on average shorter for age (HAZ −1.3 vs −1.0, P < .01), although the proportion stunted was similar (22.9% vs 17.6%, P = .15).
Overall, a smaller proportion of HIV-infected children were overweight compared with HIV-uninfected children (14.4% vs 21.7%, P = .04) (Table 2). This difference appears to be due to a low proportion of overweight among those on LPV/r in contrast to children on efavirenz-based cART (11.7% vs 20.3%, P < .01). The difference in overweight between those on LPV/r versus efavirenz-based treatment was explained by existing baseline differences in overweight among a subgroup randomized to remain on LPV/r in an earlier clinical trial (data not shown). However, mean WHR, a measure of central adiposity, was slightly greater among HIV-infected children compared with HIV-uninfected children (0.91 vs 0.88, P < .01).
There were no differences in growth outcomes between children on stavudine and those on abacavir, regardless of whether they were taking LPV/r- or efavirenz-based cART. When stratified by sex, both HIV-infected boys and girls had lower mean HAZ and WAZ and a greater proportion of stunting than HIV-uninfected children (all P < .01). More HIV-infected boys were overweight than HIV-uninfected boys (15.5% vs 23.5%, P = .04), but there were no differences in overweight among girls (13.5% vs 19.6%, P = .10).
There were no differences in age, sex, height, and weight adjusted arm or leg muscle area between the HIV-infected and uninfected subjects (Table 2). We did not observe significant differences between children on LPV/r and those on efavirenz in adjusted arm (15.9 vs 15.8 cm2, P = .88) or leg muscle area (65.5 vs 66.8 cm2, P = .11). Overall, HIV-infected children had significantly lower fat measures; the mean values of sum of skinfolds were significantly lower in HIV-infected compared with HIV-uninfected children after adjusting for age, sex, height, and weight (P < .01). Differences in regional fat distribution were also observed; the mean arm fat area adjusted for age, sex, height, and weight was lower among HIV-infected compared with uninfected (P < .01) as was the mean leg fat area adjusted for age, sex, height, and weight (P < .01) (Table 2). There were differences in regional fat between the treatments; those on LPV/r had greater age, sex, height, and weight adjusted leg fat area compared with those on efavirenz (15.8 vs 13.7 cm2, P < .01). Girls had a higher mean adjusted sum of skinfolds than boys, regardless of whether they were HIV-infected (41.5 vs 34.2 mm, P < .01) or uninfected (48.0 vs 37.9, P < .01), on LPV/r (41.5 vs 34.3 mm, P < .01) or efavirenz (38.8 vs 33.3, P < .01).
Blood Pressure
We did not observe differences in mean SBP Z-score or proportion of hypertension by HIV status, sex, or LPV/r versus efavirenz. HIV-uninfected children (0.65 vs 0.41, P < .01) and children on efavirenz (0.69 vs 0.41, P < .01) had higher mean DBP Z-score than the children on LPV/r. Similarly, among girls, those on efavirenz-based cART had higher mean DBP Z-score than those on LPV/r-based cART (0.77 vs 0.41, P < .01); however, the differences among boys by LPV/r versus efavirenz were not significant (0.40 vs 0.61, P = .29).
Lipids
A higher proportion of HIV-infected children had elevated TC, LDL, non-HDL, or triglycerides than HIV-uninfected children, regardless of which dyslipidemia guidelines were used (Table 3). Elevated triglycerides were common even in uninfected children—22.0% under NHBLI guidelines. Compared with HIV-uninfected children, a greater proportion of HIV-infected children had 2 or more dyslipidemias (29.1% vs 11.7%, P < .01).
Lipids of a Cohort of 553 HIV-Infected and 300 HIV-Uninfected Children Aged 4–9 at Two Study Sites in Johannesburg, South Africa, Stratified by HIV Status
| Lipid, mg/dL | HIV Infected (N = 553) | HIV Uninfected (N = 300) | P Value |
|---|---|---|---|
| Total Cholesterol, N (%) | |||
| Acceptable: (<170) | 266 (48.5) | 229 (76.3) | <.0001 |
| Borderline: (170–199) | 163 (29.7) | 56 (18.7) | |
| Elevated: ≥200 | 120 (21.9) | 15 (5.0) | |
| LDL, N (%) | |||
| Acceptable: (<110) | 384 (70.0) | 260 (86.7) | <.0001 |
| Borderline: (110–129) | 90 (16.4) | 28 (9.3) | |
| Elevated: (≥130) | 75 (13.7) | 12 (4.0) | |
| Non-HDL, N (%) | |||
| Acceptable: <120 | 305 (55.6) | 235 (78.3) | <.0001 |
| Borderline: 120–144 | 114 (20.8) | 46 (15.3) | |
| Elevated: ≥145 | 130 (23.7) | 19 (6.3) | |
| HDL, N (%) a | |||
| Abnormal: (<35) | 38 (6.9) | 23 (7.7) | .6878 |
| Normal: (≥35) | 511 (93.1) | 277 (92.3) | |
| HDL, N (%) b | |||
| Low: (<40) | 77 (14.0) | 49 (16.3) | .6611 |
| Borderline (40–45) | 72 (13.1) | 39 (13.0) | |
| Acceptable: (>45) | 400 (72.9) | 212 (70.7) | |
| Triglycerides, N (%) a | |||
| Normal: (≤150) | 429 (78.1) | 276 (92.0) | <.0001 |
| Abnormal: (>150) | 120 (21.9) | 24 (8.0) | |
| Triglycerides, N (%) b | |||
| Acceptable: (<75) | 132 (24.0) | 164 (54.7) | <.0001 |
| Borderline: (75–99) | 115 (21.0) | 70 (23.3) | |
| Elevated: (≥100) | 302 (55.0) | 66 (22.0) | |
| Number of Dyslipidemiasb | |||
| 0 | 187 (34.1) | 196 (65.3) | <.0001 |
| 1 | 202 (36.8) | 69 (23.0) | |
| 2 | 111 (20.2) | 33 (11.0) | |
| ≥3 | 49 (8.9) | 2 (0.7) | |
Abbreviations: HDL, high-density lipoprotein; HIV, human immunodeficiency virus; LDL, low-density lipoprotein.
aCategories based on National Cholesterol Education Program Expert Panel on Cholesterol Levels in Children [42, 43].
bCategories based on Expert Panel on Integrated Guidelines for Cardiovascular Health and Risk Reduction in Children and Adolescents [44].
Dyslipidemias were considerably more prevalent among children on LPV/r. Two or more dyslipidemias were found in 33.2% of those on LPV/r compared with 19.8% of children on efavirenz (P < .01). The proportions of children with elevated TC, triglycerides, LDL, and non-HDL were also significantly higher in the LPV/r than the efavirenz group (all P < .01). However, even the efavirenz group had higher proportions with elevated lipids than the HIV-uninfected group (Figure 2). No differences in abnormal HDL were seen across the 3 groups. Regardless of whether the children were on LPV/r or efavirenz-based cART, there were no differences in proportion with abnormal TC, LDL, non-HDL, or HDL, between children on stavudine and children on abacavir.
![Percentage of children with borderline or elevated lipids in a cohort of 553 human immunodeficiency virus (HIV)-infected and 300 HIV-uninfected children aged 4–9 at 2 study sites in Johannesburg, South Africa, stratified by HIV status and combination antiretroviral therapy regimen. *This figure uses the guidelines from the Expert Panel on Integrated Guidelines for Cardiovascular Health and Risk Reduction in Children and Adolescents [44]. Under guidelines from the National Cholesterol Education Program Expert Panel on Cholesterol Levels in Children [42, 43], 26.3% of the rotanivir-boosted lopinavir (LPV/r) group, 14.0% of the efavirenz (EFV) group, and 8.0% of the HIV-uninfected group had abnormal triglycerides. HDL, high-density lipoprotein; HIV−, HIV-uninfected; LDL, low-density lipoprotein; TC, total cholesterol.](https://oup.silverchair-cdn.com/oup/backfile/Content_public/Journal/jpids/7/2/10.1093_jpids_pix026/1/m_pix02602.jpeg?Expires=1749773854&Signature=etplmcccMiIFLtzkww1-2RCTgq0wMXH1jquRsq9cwIY6Q-aiPOnwqlxxZt~N8hrXBIpDEwFuPXBDLi7c3yDCu1w-X7PbANEm8d0gIJer9iBNGrnL~82gDzSXc3N9RMVxb7VrzIno~1go6hY1ZmrVsx2JQu7YdkjBHE1BInQ7jz6hmpVWO9QS1ApMk5Tn87oPzvzm7aJnBWF72ew8~StXrTtyI8vviFNxDMXQGTZMrLa0DDkqGI2E43RaT0dVaUzNyfoBFGtVifb0IBbT11rXXPCboRp32M8FVmaCazlJD9smFQpG4xtKr9jU6oCIkf58cMam3muhILNdFLxjQKDxvQ__&Key-Pair-Id=APKAIE5G5CRDK6RD3PGA)
Percentage of children with borderline or elevated lipids in a cohort of 553 human immunodeficiency virus (HIV)-infected and 300 HIV-uninfected children aged 4–9 at 2 study sites in Johannesburg, South Africa, stratified by HIV status and combination antiretroviral therapy regimen. *This figure uses the guidelines from the Expert Panel on Integrated Guidelines for Cardiovascular Health and Risk Reduction in Children and Adolescents [44]. Under guidelines from the National Cholesterol Education Program Expert Panel on Cholesterol Levels in Children [42, 43], 26.3% of the rotanivir-boosted lopinavir (LPV/r) group, 14.0% of the efavirenz (EFV) group, and 8.0% of the HIV-uninfected group had abnormal triglycerides. HDL, high-density lipoprotein; HIV−, HIV-uninfected; LDL, low-density lipoprotein; TC, total cholesterol.
No sex differences in lipid profiles were observed between HIV-infected and HIV-uninfected children. The proportion with elevated triglycerides (under NHBLI guidelines) was lower among those on efavirenz-based cART compared with those on LPV/r-based cART among girls (40.7% vs 59.6%, P < .01) and boys, but the difference among boys was not significant (61.2% vs 48.7%, P = .17).
DISCUSSION
In this large South African cohort, perinatally HIV-infected children have less favorable growth and lipid profiles compared with HIV-uninfected children of similar sociodemographic background. Despite early life initiation of cART and largely well controlled disease, growth deficits are detectable in the HIV-infected children in comparison to both World Health Organization (WHO) norms and HIV-uninfected children. Height appears to be impaired more severely than weight, and stunting is more prevalent than underweight. Other sub-Saharan African studies of children on cART have also observed more pronounced residual height than weight deficits [5, 7, 8]. In general, other sub-Saharan African studies using WHO norms report growth deficits of similar or greater magnitude [5–9, 45–47]. In some cases, the growth deficits of greater magnitude may be due to a shorter duration or later initiation of cART than the children in our study [7, 45–47]. In addition, greater growth deficits reported may be due to a higher prevalence of undernutrition in the general population [47]. Our findings suggest that other measures besides early initiation of cART may be required to ensure that HIV-infected children achieve optimal childhood growth and avoid reductions in final adult height [48].
In addition to stunting, we observed overweight among both the HIV-infected and HIV-uninfected children, and some are both stunted and overweight. This “double burden of malnutrition”, in which undernutrition and overweight coexist, is currently being experienced by many LMIC, including South Africa [49, 50]. It is a consequence of several trends, including increased urbanization, decreased physical activity, and dietary changes [51].
Although lower attained growth was detected in our sample of children with HIV infection, muscle mass was comparable to the healthy children. This preservation of lean body stores may represent at least partial restoration of normal anabolism and contrasts to findings from older studies in which decrements in lean body mass out of proportion to fat stores were reported [52, 53]. Our findings are consistent with more recent studies from high-income countries that found no differences in lean body mass between HIV-infected childred receiving cART and HIV-uninfected children but reduced fat mass among HIV-uninfected children [54, 55]. Studies assessing strength and aerobic capacity are needed to evaluate the potential functional benefit of this finding.
The clinical significance of slightly but significantly greater DBP Z-score in the efavirenz group and HIV-uninfected children compared with the LPV/r group is not known but suggests that more detailed drug-specific studies of cardiac function may be warranted.
As expected [17–25], children on LPV/r-based regimens have the highest prevalence of hyperlipidemia, but lipids were also elevated relative to the HIV-uninfected among children taking efavirenz. Unlike many studies of lipids in HIV-infected children on cART, our study includes a group of HIV-uninfected children for comparison. Thus, although the efavirenz group has a more favorable lipid profile than the LPV/r group, it is still quite abnormal, with almost double the proportion of children with high TC, high triglycerides, or high LDL compared with the HIV-uninfected children. Additional studies are required to determine whether some or all of the alterations observed among the children receiving efavirenz reflects residual effects of prior LPV/r exposure. Of interest, we did not find differences in growth or lipids between children on stavudine and children on abacavir. This was unexpected because stavudine has previously been reported in association with lipid alterations [27, 28].
Dyslipidemia in HIV-infected children is of particular concern for several reasons. Dyslipidemia has been linked to preclinical atherosclerosis during childhood and adolescence [56–58], reflecting the early life origins of adult cardiovascular disease. HIV-infected children have been shown to have higher levels of preclinical atherosclerosis than HIV-uninfected children, as measured by intima-media thickness [59–63]. Several studies observe that HIV-infected adults are at increased risk of cardiovascular events, including myocardial infarction [64–66] and cerebrovascular accidents [67, 68]. Given that HIV-infected children will remain on lifelong cART, it is important that dyslipidemia and other cardiovascular disease risk factors are minimized in childhood. A number of potentially modifiable determinants of lipid concentrations and other cardiovascular disease risk factors have been identified in South Africans including diet and physical activity [50], and targeting these and electing antiretroviral drugs such as efavirenz that have more modest adverse effects on lipids may improve long-term cardiovascular health.
A major strength of this study is the control group. In the absence of established norms for the South African population, having an HIV-uninfected control group allows for meaningful interpretation of results. In addition, this is a large, well characterized clinically stable cohort, with well controlled viral loads, who initiated cART early in life as is currently recommended. However, this study has several limitations. First, it is a cross-sectional study, so we cannot observe changes in growth and lipid outcomes as the children age. However, Friedman et al [69] found that elevated childhood LDL and TC between the ages of 5 and 10 and 5 and 11 years track into adulthood. Second, lipids were measured in a nonfasting state so they may be inaccurate; yet Steiner et al [70] observed that the small differences between fasting and nonfasting LDL, TC, and HDL are probably not clinically significant.
CONCLUSIONS
Although HIV continues to be associated with undernutrition in urban South African settings, overweight appears to be increasing. Nutritional interventions for HIV-infected children in these settings should address not only undernutrition but also overweight. In resource-limited settings, avoiding prolonged use of LPV/r or switching those with elevated lipids from LPV/r to efavirenz are potential strategies for preventing and reducing dyslipidemia. However, because HIV infection appears to be associated with dyslipidemia even with efavirenz, other strategies for optimizing growth and early life management of lipid alterations should be developed.
Notes
Author contributions. M. F., A.C., R. S., A. V., A. L., S. M. A., and L. K. designed the study and developed the protocol. A. L., R. S., F. Pi., and F. Pa. were responsible for clinical oversight. S. M. R., S. S., S. M. A., and L. K. carried out the data analysis. All authors were involved in the interpretation of the findings and the writing of the report.
Acknowledgments. We acknowledge Mofan Gu for work on the wealth index.
Disclaimer. The funder had no role in study design or collection, analysis, and interpretation of data or in writing the manuscript.
Financial support. This study was funded by the National Institute of Child Health and Human Development (Grants HD 073977 and HD 073952).
Potential conflicts of interest. All authors: No reported conflicts of interest.All authors have submitted the ICMJE Form for Disclosure of Potential Conflicts of Interest. Conflicts that the editors consider relevant to the content of the manuscript have been disclosed.
