


Abstract
The mechanism by which species richness affects variation in ecosystem functioning both within and among ecosystems remains a key question at the interface of community and ecosystem ecology. Statistical averaging (the smoothing of average system performance via consideration of additional components) and the insurance effect (reduced variation in system performance by inclusion of asynchronously varying components) predict that more diverse communities should vary less both between replicates and internally. We experimentally tested these theories in small plant assemblages.
We constructed plant assemblages modeled after old-field plant communities. We varied species richness, species composition and initial densities while holding functional group richness constant in replicate assemblages under glasshouse conditions.
The inverse of the coefficient of variation of aboveground biomass production, a proxy measure of reliability, increased with higher diversity when examined at the level of the assemblage (i.e. among-replicate assemblages) but not at the levels of functional group or species. These stabilizing processes were weakest in low-diversity, low-density assemblages. This experiment demonstrates the utility of hierarchical analysis of ecosystem reliability at the assemblage, functional group and species level.
Introduction
The potential consequences of species loss for ecosystem functioning (Balvanera et al. 2006; Hooper et al. 2005; Loreau et al. 2001) and services (Duraiappah and Naeem 2005) demand creative approaches to investigating this relationship. Average trends of ecosystem functions have been assessed in great detail, yet how the variation in ecosystem performance responds to biodiversity loss still poses unanswered questions. Two key questions are (i) how is variation in functioning at the community level represented at component functional group and species levels? and (ii) how does species diversity interact with density at different levels of organization to determine the variation in ecosystem functioning?
Species richness has been hypothesized to alter the variation in productivity either absent any environmental variation (reliability; e.g. Yachi and Loreau 1999) and in response to disturbance (stability; e.g. Tilman and Downing 1994). Theoretical studies have proposed that ecosystem stability should rise with increasing species richness, while populations of individual species should experience increasing variability as more species are added to the system (Naeem 1998; Tilman 1996). Empirical evidence has supported this hypothesis for both species diversity in plant, microbial and reef communities (Kiessling 2005; McGrady-Steed et al. 1997; Naeem and Li 1997) and genetic diversity within an aquatic plant species (Hughes and Stachowicz 2004). However, exceptions have been observed in an annual plant community, where population and community stability covaried (Valone and Hoffman 2003), and in microbial communities where population-level fluctuations may have been strong enough to increase community variability (Petchey et al. 2002). Notably, stability as measured by resistance to perturbation may decrease, even while overall diversity–productivity relationships remain positive (Pfisterer and Schmid 2002). These studies have generally considered only stability of the aggregate community function, without analyzing the stability of component groups within the community.
While the stability of ecosystem functioning can be measured by continuous monitoring of ecosystem variables over time, in response to environmental variation, the reliability of ecosystem functioning is both conceptually and practically more difficult to deal with. Using experimentally established replicate ecosystems, Naeem and Li (1997) demonstrated that rising numbers of species per functional group (trophic level) led to an increase in the reliability of biomass and density across similarly diverse artificial microcosms. Likewise, McGrady-Steed et al. (1997) found that among-replicate variation (‘predictability’, in their terminology) in space as well as within-replicate variation in time in the production of carbon dioxide, an alternative measure of ecosystem functioning, decreased with increasing species richness. However, such patterns have rarely been tested in plant communities where the results can be directly compared to the major body of biodiversity–ecosystem functioning research (but see Weigelt et al. 2008). A complication in diversity–stability research has been the fact that experimental systems at the high end of the diversity gradient can have greater self-similarity in species composition, and therefore may access resources in similar ways, leading to more reliable ecosystem functioning (Fukami et al. 2001). Using multiple species composition combinations at each diversity level mitigates this problem (see also Weltzin et al. 2003).
In addition to diversity, the density of organisms within an ecosystem may also affect ecosystem functioning and reliability. For example, effects of a high total number of individuals may to some extent compensate for the effects of a low number of species (He et al. 2005). Community density is likely to alter the shape of biodiversity–ecosystem function relationships because under greater competition for scarce resources, the advantages of niche differentiation should be more apparent. Thus, diversity should interact with density so that the effect of diversity is greatest under high-density conditions. However, empirical analysis of how density modifies diversity–ecosystem functioning relationships remains scarce. In experimental communities of aquatic detritivores, manipulated density levels revealed that mitigation of intraspecific interference via higher richness at higher densities was a major factor contributing to the positive diversity–ecosystem functioning relationship (Jonsson and Malmqvist 2003). In a previous analysis of the data presented here, we observed density-for-diversity compensation in experimental assemblages of old-field plant species, i.e. high-density systems could still achieve high yield at a richness of three species, whereas low-density systems only reached high yield at a richness of 12 species (He et al. 2005). Here we present a novel analysis to consider how functioning at different levels of organization (species, functional group and assemblage) differentially respond to changes in both diversity and density.
We examine the influence of plant species richness and planting density on the reliability of biomass production between and within replicate model grassland assemblages under controlled environmental conditions. Reliability here means consistency of biomass accumulation across assemblages of equal species richness as measured by the inverse of the coefficient of variation (CV). Species richness and planting density were manipulated in a 3 × 3 two-way factorial design to test the effect of these experimental factors on among-assemblage variation in biomass production at the levels of the entire assemblage and of constituent plant functional groups and species. A priori functional groups were used in lieu of trait-based groupings of species in the original study design, and despite serious shortcomings in describing ecosystem-level responses (Craine et al. 2001; Wright et al. 2006), these groups have utility as rough approximations of biologically relevant groupings of species by their ecological role (see Discussion).
In addition, in the course of the experiment it became evident that the presence of a strong competitor, Ambrosia artemisiifolia, could alter the outcomes of the diversity and density treatments on stability of biomass production. If diversity loss leads to greater variability of functioning under at high density because of greater competitive pressure, with Ambrosia, the loss of other species will lead to reduced reliability of biomass accumulation.
We predicted that (i) species loss would lead to less reliability of biomass accumulation at the level of the whole assemblage but not at the levels of functional groups and species; (ii) at greater planting density, species loss would have a more pronounced effect on biomass accumulation reliability; and (iii) the presence of Ambrosia should be a significant factor in determining total assemblage response to diversity loss.
Materials and Methods
Experimental design and growth conditions
This study was conducted in an environmentally controlled glasshouse at Harvard University, Cambridge, MA, USA in summer 2001. We constructed replicate plant assemblages at three densities using plants from a pool of 15 species representative of old-field plant communities of the Midwestern United States (see Supplementary material online for species list). Assemblages were constructed in a nested hierarchy of 3, 6 and 12 species, with two species combinations at each diversity level and six replicates per combination, resulting in 108 assemblages (3 richness × 3 density × 2 combinations per richness × 6 replicates = 108). All assemblages contained the same three functional groups of plants (C3, C4 and legumes), that is, species richness was manipulated independently of functional group richness (see He et al. 2005; Schmid et al. 2002). Plant genotype diversity was not controlled for in this design. The six different richness × combination treatments were composed of two low- (3 species per community, 1 from each functional group), two intermediate- (6 species per community, 2 from each functional group) and two high-diversity combinations (12 species per community, 3 species each of C4 and legumes plus 6 species of C3). The assemblages were established at densities of 440, 1050 or 2525 seedlings per m2 and had attained densities of 454, 1078 or 2291 plants per m2 by the final harvest; relative abundances of species fluctuated through the experiment, but no treatment lost species entirely. Germination ratios, based on greenhouse trials, were used to calculate the mass of seeds needed to produce equal numbers of individuals per community regardless of how many species each community contained.
We sowed the plant assemblages in 28.5 × 33.5 × 20 cm (length × width × height) plastic bins filled with a 1:4 mixture of garden soil:Pro-Mix general-purpose growing medium (Red Hill, PA, USA). Four holes were drilled into the bottom of each bin to provide drainage. To these bins were added 15 g Osmocote, a controlled release fertilizer (% N:P:K = 14:14:14). Soon after germination, we inoculated each bin with both Rhizobium leguminosarum biovar. trifolli and Rhizobium leguminosarum biovar. viciae (MicroBio RhizoGen Corporation, Saskatoon, SK, Canada).
The experimental assemblages were randomly assigned to three modules of an environmentally controlled glasshouse. The temperature in all modules was maintained at 25°C from 08:00 to 20:00 h and 19°C over night. Lighting was provided by natural sunlight filtered through the roof of the glasshouse, which reduced light levels by ≈28%. The bins were rerandomized once a week within modules to reduce variation in growing conditions; modules were randomized twice over the course of the experiment and bins moved accordingly. The plants were watered daily.
Greater stability in functioning among ecosystems of higher rather than lower diversity may be due to increasing overlap in species compositions and abundance distributions, a proposition which has been supported in a simulation study (Fukami et al. 2001). In experiments like ours, such increasing similarity may undermine the ability to test the role of species richness on community stability per se. However, our design demonstrated no clear increase in similarity with increasing species richness, using Jaccard similarities based on species presence–absence. (Jaccard similarities = 0.50, 0.71 and 0.60 for low, medium and high species richness, respectively). In addition, in our analysis we avoided such a ‘variance-reduction’ effect (Schmid et al. 2002) by calculating reliability only across replicated ecosystems of identical species composition.
Measurements
The experiment started on 7 May 2001 and lasted for 4 months. The harvest was conducted when fruits of most species were ripe but had not fallen. However, at this point Plantago lanceolata, Poa annua, Vicia cracca, Trifolium pratense and Trifolium dubium still had not flowered. All plants were cut off at ground level, dried and weighed. In at least three of the six replicates of each density × species richness × combination treatment, the harvested aboveground parts of the plants were separated into functional groups and species (a total of 62 bins). These bins were chosen at random from the full set. To estimate total productivity of the root system, we took root subsamples from the middle of each bin using stainless steel cores (15 cm diameter × 20 cm deep). In addition, we obtained intact whole-community root systems from 36 bins by carefully washing away the soil. A linear regression between root biomass of entire bins and core subsamples was used to estimate the whole-system root biomass of the remaining 72 bins. No attempt was made to separate roots by species or functional group. Roots and shoots were dried at 65°C for 1 week before measuring dry weight.
Data analysis
The reciprocal of the CV was used as a proxy for the reliability of the biomass production of assemblages, functional groups and species. CVs have been used previously to assess the degree of variability in an ecosystem process across replicates (e.g. Bai et al. 2004; Mouillot et al. 2005); here we use 1/CV and term it reliability to distinguish it from temporal stability. Means, variances and standard deviations of community, functional group and species biomass at harvest were calculated for each density × species richness × combination treatment. The resulting tables with 18 rows (3 diversities × 3 densities × 2 species composition combinations at each richness level) were used for all subsequent analyses. We analyzed reliability, CV and variance with generalized linear models, using normally distributed errors for the first two and gamma-distributed errors for variances. However, the analysis of reliability resulted in residuals that did not meet the distributional assumptions; therefore, we used the analysis of CV to derive fitted values that were then converted to reliabilities. The analysis of variance values with the gamma-distributed errors gave similar results to the analysis of CV values and therefore we only report the latter in the text. In addition to the analysis of CV values at assemblage, functional group and species levels, we also analyzed correlations between the biomass of functional groups as dependent variables (n = 18; distributional assumptions of general linear model fulfilled with normal errors).
The fitted generalized linear model included the terms log density, species richness (partitioned into linear contrast and deviation from linearity), the interaction of these two and combination (partitioned into a contrast for presence/absence of Ambrosia and remainder). The contrast for Ambrosia was included as a planned comparison of Ambrosia presence since it became clear in the course of the experiment that this strong competitor had the potential to alter the experimental outcomes. We used the generalized linear model module of the SAS statistical software package version 8.01 (SAS 1999) and the Genstat software (Payne et al. 1993) with sequential sums of squares (Schmid et al. 2002). Note that due to the factorial design of the experiment, changing the sequence of fitting terms had little effect on calculated sums of squares.
Because within-functional group species richness was similar across species-richness treatments, the summary data from the 18 combinations of diversity × density × combination could be used to test the effect of functional group identity across richness treatments. However, this was not the case for the individual plant species because they did not occur in all treatments. Thus, following references to ‘species-level’ analysis refers to analyses of those four species that occurred in nearly all treatments: Abutilon theophrasti, n = 15; Ambrosia artemisiifolia, n = 12; Setaria italica, n = 18 and Trifolium pratense, n = 18 (hereafter referred to by genus). In addition, we calculated a combined analysis with an additional term for species identity and its interactions with the other terms that were fitted after species. For this analysis, we used summary data consisting of reliability values of all species in the different treatments.
Results and Discussion
Reliability of biomass production clearly varied with species richness at the assemblage level and not at the functional group or species level. At the assemblage level, biomass production was less reliable at low than at intermediate and high species richness or density (Fig. 1, Table 1). Surprisingly, and especially at high density, assemblages with intermediate richness (6 species) were more reliable than systems with high richness (12 species), perhaps because functional group evenness was lower at the highest richness level (with 6 C3, 3 C4 and 3 legume species) than at the two lower ones (which had equal numbers of species in each functional group). The presence of Ambrosia also significantly increased the reliability of above- but not belowground biomass production (Table 1).
Summary of analysis of variance results for effects of species richness and density on assemblage-level and functional group-level reliability of biomass production
| df | SS | F | SS | F | SS | F | ||||
| Assemblage | Total biomass | Aboveground biomass | Belowground biomass | |||||||
| Treatment | ||||||||||
| Log density | 1 | 0.03870 | 37.37 | *** | 0.02923 | 17.07 | ** | 0.12333 | 5.69 | * |
| Species-richness linear | 1 | 0.00905 | 8.74 | * | 0.02146 | 12.53 | ** | 0.01786 | 0.82 | |
| Species-richness deviation | 1 | 0.02472 | 23.87 | *** | 0.02471 | 14.43 | ** | 0.03266 | 1.51 | |
| Log density × species-richness linear | 1 | 0.00707 | 6.83 | * | 0.00504 | 2.94 | 0.03504 | 1.62 | ||
| Log density × species-richness deviation | 1 | 0.00096 | 0.93 | 0.00008 | 0.05 | 0.01187 | 0.55 | |||
| Ambrosia presence | 1 | 0.01033 | 9.98 | * | 0.01667 | 9.73 | * | 0.00885 | 0.41 | |
| Combination within species-richness | 2 | 0.00368 | 1.78 | 0.00701 | 2.05 | 0.00060 | 0.01 | |||
| Residual | 9 | 0.00932 | 0.01541 | 0.19500 | 5.69 | |||||
| Functional group | C3 | C4 | Legume | |||||||
| Treatment | ||||||||||
| Log density | 1 | 0.00003 | 0.00 | 0.26074 | 13.64 | ** | 0.0506 | 0.36 | ||
| Species-richness linear | 1 | 0.05935 | 5.91 | * | 0.04173 | 2.18 | 0.1175 | 0.83 | ||
| Species-richness deviation | 1 | 0.02709 | 2.70 | 0.01363 | 0.71 | 0.2864 | 2.03 | |||
| Log density × species-richness linear | 1 | 0.00468 | 0.47 | 0.00057 | 0.03 | 0.1195 | 0.85 | |||
| Log density × species-richness deviation | 1 | 0.02650 | 2.64 | 0.10151 | 5.31 | * | 0.0068 | 0.05 | ||
| Ambrosia presence | 1 | 0.02763 | 2.75 | 0.01756 | 0.92 | 0.0676 | 0.48 | |||
| Combination within species-richness | 2 | 0.02607 | 1.30 | 0.00682 | 0.18 | 0.0125 | 0.04 | |||
| Residual | 9 | 0.09043 | 0.17209 | 0.2690 | ||||||
The inverse of reliability, i.e. the CV was analyzed because it had better distributional properties required for the analysis. Asterisks denote level of significance: <0.05 = *, <0.01 = **, <0.001 = ***.
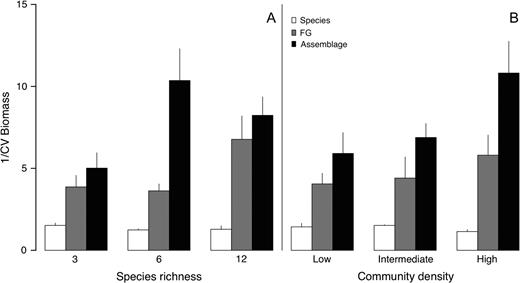
comparison of biomass production reliability (1/CV) at species, functional group and assemblage levels. At every level of manipulated species diversity (A) and planting density (B), reliability increased with organizational level. Bars represent mean reliability ± 1 SE.
For the data derived from the 62 bins in which aboveground biomass was separated into functional groups and species, the whole-system biomass production was more reliable than the component biomass production of functional groups (Fig. 2). There was only weak evidence that the reliability of functional group biomass production increased with species richness (C3 functional group) or with density (C4 functional group; Fig. 2, Table 1). Thus, increasing the number of species within the C4 or legume functional groups from 1 to 2 to 3 did not increase their reliability, whereas increasing the number of species within the C3 functional group from 1 to 2 to 6 did increase the reliability of this functional group. The high community reliability at the intermediate species-richness level was in fact not related to a high functional group reliability but rather to a strongly negative correlation between C3 and C4 functional groups at this richness level (r = −0.74 at the intermediate richness level, compared with 0.11 at the lowest and 0.06 at the highest; P = 0.015 for deviation from linearity of species-richness contrast). In contrast, the correlation between C3 and legume functional groups was negative at the lowest species-richness level (P = 0.003 for linear contrast of species richness) and there was no correlation between the biomass productions of C4 and legume functional groups. These results show that there can be several ways in which variation of individual functional groups or covariation between functional groups may decrease variation and thus increase reliability of production at the community level.
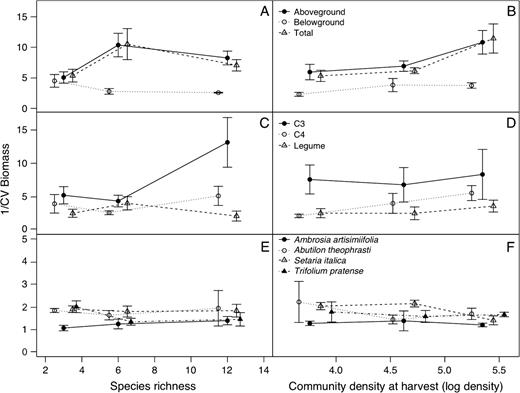
Assemblage (A and B), functional group (C and D) and species (E and F) level reliability of biomass production varied with manipulated species diversity and planting density (left and right hand frames, respectively). n = 18. Note the different y-axis scale for panels E and F.
Just as whole-system aboveground biomass production appeared to be more reliable than functional group production, so functional group production appeared to be more stable than individual species production (Fig. 2). The 15 species differed significantly in their reliability of biomass production (P < 0.001) and did not show any general pattern of reliability response to density or species richness. This was also the case for the four species that occurred in most of the treatments. When the four selected species were analyzed individually, none of them exhibited a clear trend in response to the diversity treatment (Fig. 2; P > 0.05 for all species-richness effects); and only in Setaria did biomass production reliability increase with increasing planting density (Fig. 2; P < 0.001).
Interestingly, while the populations of Ambrosia demonstrated no increase in reliability of biomass production across diversity levels (Fig. 2), assemblages with Ambrosia present performed more reliably (Table 1). It is possible that this strong competitor for nitrogen ‘evens out’ assemblage-level biomass production by drawing down soil resources to a uniformly low level; this is possible since these experimental assemblages were grown in small bins. This result ran counter to our initial prediction that heightened competitive pressure at lower diversity and with the presence of Ambrosia would result in reduced reliability.
In this study, we found that increases in both species richness and total community density generally enhanced reliability of functioning at the assemblage level but not at the functional group or species levels. These results suggest that the dynamics of assemblage components may, by averaging and compensation, increase stability of a system as a whole. Furthermore, this stabilizing effect increases with increasing numbers of components, in this case species (Cottingham et al. 2001; Doak et al. 1998; Tilman 1996). Similar patterns have been found in aquatic (Aoki 2003), microbial (McGrady-Steed et al. 1997; Morin and McGrady-Steed 2004; Mouillot et al. 2005) and terrestrial systems (Bai et al. 2004). Similarly, temporal stability in biomass production of single plots increased with species richness at the community level in two grassland biodiversity experiments (Pfisterer et al. 2004; Tilman et al. 2006), whereas it decreased at the species level in another (Tilman 1996). Our results, investigating reliability across replicates instead of stability through time showed an increase or no clear change in between-replicate reliability of population-level biomass production with increasing species richness; population-level variation does not need to increase for community-level variation to decrease.
Reliability increased across treatments when looking from the species, to the functional group, to community levels of biomass production reliability (see Fig. 1). This supports previous evidence from experimental aquatic microcosms that such higher level ecosystem attributes stabilize with greater species richness (McGrady-Steed and Morin 2000). Further evidence of such hierarchical increases in ecosystem properties comes from an observational study of Inner Mongolian grasslands of China, where both stability of biomass production and overall productivity increased from species, to functional group, to whole-ecosystem levels (Bai et al. 2004). Similar to the results of Bai et al. (2004), the stabilization of biomass production at the whole-system level in our study was in part due to negative correlations between the biomasses of functional groups and in part may have resulted from statistical averaging, which clearly increases with increasing number of species. Since experimental plots were harvested before all species flowered, we do not know how this increasing reliability of biomass production might translate across generations, but this would be a valuable question to answer in future research.
In addition, we hypothesized that a high number of individuals in an ecosystem may have similar effects as a high number of species. Indeed, high-density levels ensure high productivity even at low-diversity levels (He et al. 2005). Similarly, we showed here that high density also leads to high reliability of biomass production across similarly diverse systems. If density is a proxy for competitive strength, then this suggests that higher species richness contributes to reducing ecosystem process variability via reduced competition for limiting resources. Interestingly, ‘reduced’ reliability of ecosystem processes via ‘increased’ resource availability was observed in another study, where an increase in limiting resources destabilized freshwater animal microcosms (Romanuk et al. 2006), suggesting a powerful relationship between competitive interactions, diversity and ecosystem variation, which appears to operate in similar ways for both grassland plants and freshwater invertebrates.
The use of the three functional groups, C3, C4 and legumes, accurately captures biologically important groupings of plants, and each is relevant to diversity–functioning relationships (van Ruijven et al. 2003). Unfortunately, substantial variation may exist within these a priori groupings, such that they may not be distinguishable from random groupings in terms of power to predict ecosystem functioning (Wright et al. 2006). This has led to an increased interest in using continuous metrics of functional trait diversity (Mason et al. 2005; Petchey 2004), which could be applied to a hierarchical analysis such as this if functional groups could be clearly delineated by carefully chosen traits. Indeed, an analysis of reliability of biomass production across replicate grass communities was predicted well by a continuous measure of functional diversity in one recent study (Weigelt et al. 2008). However, our current analysis remains relevant because we focus on how considering different groupings of individuals—into species, functional groups, or the whole assemblage—alters the conclusions about the effect of diversity on reliability of a key ecosystem function, biomass accumulation.
Supplementary Data
Supplementary material is available at Journal of Plant Ecology online.
We thank R. Stomberg for managing the glasshouse facilities. J.-S.H. and D.F.B.F. were supported by the State Key Basic Research and Development Plan (2002CB412502) and the Natural Science Foundation of China (90211016), with additional support from Harvard Forest LTER and the Andrew Mellon Foundation. B.S. was supported by the Swiss National Science Foundation (nr. 31–65224.01) and the Deutsche Forschungsgemeinschaft (nr. FOR 456 - WE 2618/6-1 to WW Weisser). Comments from S. Naeem greatly improved the manuscript.


