


Abstract
Large hurricanes have profound impacts on temperate forests, but owing to their infrequent nature these effects have rarely been examined in detail. In 1996, Hurricane Fran significantly damaged many long-term tree census plots in the Duke Forest on the North Carolina Piedmont, thereby providing an exceptional opportunity to examine pre- and post-hurricane forest compositional trajectories. Our goal was to examine immediate, short-term (0–4 years) and longer term (∼5 year) hurricane-induced structural, spatial and compositional changes in the tree population (stem d.b.h > 1 cm) in the context of our detailed, long-term knowledge of the dynamics of these forests.
We surveyed stem damage and tree mortality in 34 long-term permanent plots (ca. 70-year record; 404–1 012 m2) and 7 large mapped tree stands (ca. 20-year record; 5 250–65 000 m2) representing both transition-phase, even-aged pine stands and uneven-aged upland hardwood forests. We employed three types of damage measures to quantify stand-level damage severity: percentage of stems damaged, percentage of basal area lost and a ‘stand-level damage index’. Second-order spatial analysis (Ripley's K-function) was used to investigate patterns in tree mortality.
Our study found hurricane effects on the structural attributes of Piedmont forests to be variable and patchy. Changes in tree species composition, however, were modest. Uprooting was the major damage type for the overstory trees [diameter at breast height (d.b.h.) >10 cm] apparently due to the exposure of the crowns to high wind combined with heavy rainfall prior to and during the storm. Saplings, juvenile trees and small trees (1–10 cm d.b.h.) of the understory and midstory were mainly damaged by being pinned or bent by their damaged large neighbors. Hurricane-induced tree mortality varied weakly among species, was positively correlated with pre-hurricane tree size and remained up to 2-fold higher than pre-hurricane background mortality 5 years after the hurricane. Spatial point pattern analysis revealed a patchy distribution of tree mortality during the hurricane sampling interval. Hurricane Fran resulted in a dramatic increase in average gap size from ca. 400 m2 pre-hurricane to ca 1100 m2 after the hurricane, whereas maximum gap sizes reached 18–34 times larger than the pre-hurricane levels.
Introduction
Hurricanes and typhoons have long been recognized to have profound impacts on temperate zone forests (e.g. Bromley 1939; Spurr 1956) and have been viewed as a potential key factor driving long-term variation in vegetation structure, species composition, community dynamics and ecosystem processes (e.g. Allen et al. 1997; Boose et al. 1994, 2001; Foster 1988; Foster and Boose 1992; Merrens and Peart 1992; Platt et al. 2000; Putz and Sharitz 1991). However, owing to their infrequent and unpredictable nature, these effects have rarely been examined in detail. In particular, long-term pre-hurricane and post-hurricane data are critical for partitioning of confounding effects (Everham and Brokaw 1996), yet only rarely are such data available.
Hurricanes are the most destructive type of natural disturbance encountered in eastern North America. Major hurricanes disturb the typical Piedmont forest on average every 50 years (Barnes 2001; Xi 2005). In September 1996 Hurricane Fran, a large category-3 hurricane struck central North Carolina and caused substantial tree damage and mortality in Coastal Plain and Piedmont forests. The storm passed directly over the Duke Forest, an ecological research area for which many years of baseline data on tree, seedling and sapling dynamics are available, in some cases dating to the early 1930s. The occurrence of Hurricane Fran provided an exceptional opportunity to examine in a long-term context the impacts of a large, infrequent wind event on a series of forest sites varying in species composition, habitats and stand history.
Our overall goal was to examine the impact of Hurricane Fran on the Duke Forest including immediate damage patterns, hurricane-induced short-term (0–4 years) structural, spatial and compositional changes in the tree population [stems > 1 cm diameter at breast height (d.b.h.), 1.37 m, d.b.h.] as well as the delayed effects evident in the 5-year period following the hurricane. Our specific objectives were to: (i) assess both the landscape scale and the within-stand forest damage; (ii) examine immediate and delayed species- and size-specific tree mortality; (iii) quantify within-stand, hurricane-induced gap formation rates (GFR) and the changes in forest structural heterogeneity and (iv) assess likely long-term compositional change.
Methods
Study area
This study was conducted in the Duke Forest, Orange and Durham Counties, NC, USA (∼35° 52′ N, 79° 59′ W; Fig. 1). The region is floristically diverse with >80 native tree species identified in our permanent plot network. Prominent stand types in the Duke Forest include even-aged successional loblolly pine (Pinus taeda) forest (ca. 80–100 years old) and mature, uneven-aged upland deciduous hardwood forest. The current pine stands in the Duke Forest are the result of reversion from past farmland abandonment and are in the transition phase of the on-going succession back to hardwood dominance (Peet 1992; Peet and Christensen 1987, 1988). The uneven-aged hardwood forest type is close to the putative original or ‘climax’ forest type of the Piedmont (Braun 1950; Oosting 1942), though current uneven-aged hardwood stands have been variously influenced by the past disturbances (e.g. chronic low-intensity wildfires prior to 1900, selective cutting and grazing in 1800s and episodic windstorm damage).
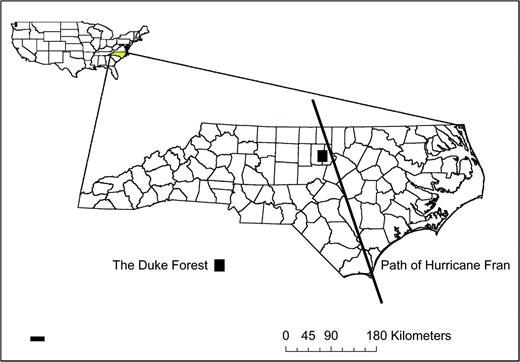
The location of the Duke Forest and the path of 1996 Hurricane Fran in North Carolina, USA.
The Duke forest has served as a model system for studies of community dynamics and has been home to a wide range investigations since its establishment in the early 1930s (e.g. Billings 1938; Bormann 1953a, 1953b; Christensen 1977; Christensen and Peet 1981, 1984; Keever 1950; Korstian and Coile 1938; Oosting 1942; Peet and Christensen 1980, 1987, 1988, see review by Peet 1992). More detailed descriptions of site conditions, community types and successional dynamics can be found in previous research papers (e.g. Bormann 1953b; Kaverna et al. 2005; McDonald et al. 2003; Oosting 1942; Palmer et al. 2007; Peet 1992; Peet and Christensen 1987, 1988).
Permanent vegetation plots
Duke Forest contains a series of long-term permanent plots distributed across the forest. A set of 51 permanent sample plots (PSPs, 404–1012 m2) was established during the 1930s to monitor tree growth and changes in species composition within stands of various age, site condition and management. These plots have been surveyed at roughly 5-year intervals since establishment to record for all woody plant stems >1 cm d.b.h. (prior to 1978 >2.5 cm), stem coordinates, species, survival, diameter, diameter growth, height, height growth and tree condition (live, dead, missing, die back, cut or damaged by Hurricane Fran in 1996). A total of 34 PSPs including 28 even-aged P. taeda (loblolly pine) stands and 6 uneven-aged deciduous hardwood stands remain actively monitored (Table S1 is available at Journal of Plant Ecology online).
To supplement the permanent plot network and facilitate study of spatial patterns and processes in tree population dynamics, all trees were mapped in six mapped permanent plots (MPPs) in the late 1970s by Peet and Christensen. Prior to this, there had been only one large MPP in the Duke Forest, which was established by F. H. Bormann in 1950 (Bormann 1950, see Christensen 1977). These large, extensively mapped forest stands vary in size from 5 250 to 65 536 m2, and essentially the same information was recorded as in the PSPs except for more limited measurement of tree height. The seven MPPs represent two major forest types of different successional status in North Carolina Piedmont forests: transition phase of older but even-aged P. taeda stands with a hardwood understory (ca. 80–100 years old) and mature, uneven-aged upland deciduous hardwood forest (Table 1, Peet 1992). As with the PSPs, resurvey of these MPPs has been carried out at ∼5-year intervals since their establishment. Botanical nomenclature follows Kartesz 1999.
Characteristics of the seven mapped plots (MPPs) in the Duke Forest, North Carolina, USA
| Name | Size (m2) | Establishment (year) | Habitat | Disturbance history |
| Pine stands | ||||
| Graveyard | 13 000 | 1978 | Dry upland | Selective cutting prior to 1930, some salvage cutting lowing Hurricane Hazel in 1954 |
| Land's end | 9 900 | 1978 | Dry upland | Selective cutting prior to 1930 |
| Upland hardwood stands | ||||
| Rocky | 20 400 | 1978 | Dry upland | Selective cutting prior to 1930 |
| Wooden Bridge | 5 250 | 1984 | Dry mesic upland | Selective cutting prior to 1930 |
| Bormann | 19 600 | 1952 | Dry upland | Selective cutting prior to 1930 |
| Bryan Center | 19 400 | 1986 | Dry mesic upland | Old field, abandoned circa 1780 |
| Oosting | 65 536 | 1990 | Dry mesic upland | Selective cutting prior to 1930 |
Hurricane Fran
Duke Forest was significantly damaged in 1996 by Hurricane Fran, one of the most destructive hurricanes in North Carolina history and the fourth most costly hurricane on the United States mainland in the 20th century (Barnes 2001). Hurricane Fran was a large category-3 hurricane when it made landfall near Cape Fear on the southeast coast of North Carolina. After making landfall, it moved from southeast to the northwest across North Carolina's Coastal Plain and Piedmont (Fig. 1). On 6 September 1996, Fran struck the Duke Forest and adjacent areas, its eye passing ∼24 km to the east of the forest. Although wind intensity had begun to decrease, Hurricane Fran caused substantial forest damage in these central North Carolina Piedmont forests.
The maximum sustained wind speed at Raleigh–Durham International Airport, the nearest official weather station to the Duke Forest, was just under 27 m/s. The maximum wind gust recorded was 31.85 m/s. Beside the high winds, Hurricane Fran brought a huge amount of rainfall along its path. The total rainfall at Raleigh–Durham International Airport was 224 mm during the 2-day hurricane period. In addition, the Duke Forest had received ∼76 mm of rainfall 2 days prior to Hurricane Fran and another 51 mm immediately afterward. Overall, this forest region experienced ∼423 mm rainfall total for September 1996, the highest ever in a single month since 1908 (The National Hurricane Center, The State Climate Office of North Carolina). The large amount of rainfall softened the soils and greatly facilitated tree blowdown during Hurricane Fran.
Tree stem damage assessment
In the summer of 1997, the first growing season following Hurricane Fran, we resurveyed all 34 PSPs and 3 of 7 MPPs in the Duke Forest. The other four MPPs were resurveyed the subsequent summer. During the surveys, in addition to continuing measurement of vitality, diameter, height (for PSPs) and survival, we quantified hurricane damage status for each stem in the plots with four ordinal stem damage codes representing uprooting, breakage, leaning and leaned on (see below). The azimuth of each fallen bole was measured by compass. In all, ∼45,800 trees >1 cm d.b.h. were evaluated for damage status across a total 178 500 m2 (17.85 ha) of sampling area. All trees in the 34 PSPs and the 7 MPPs were remeasured in the summers of 2000 and 2001 for their tree condition, stem d.b.h. and (for PSPs) tree height.
As tree stems often suffered multiple damage types and events, we created an ‘integrated stem damage code’ by combining all information on uprooting, breakage, leaning and leaned on into a single code ranging from 0 to 3. We defined a damaged stem as code 3 if a tree sustained severe damage (i.e. completely uprooted, > = 90% canopy lost or leaning on the ground), code 2 if a tree sustained substantial damage (i.e. partially uprooted, 35–90% canopy loss, leaning but supported by other trees or was pinned on the ground by fallen neighbors) and code 1 if a tree sustained modest damage (i.e. 10–35% canopy loss, leaning >10% or bent with >10% crown displacement. Code 0 is for minor or no damage. The integrated stem damage code reflects multiple damage attributes for a stem and, therefore, should more accurately reflect tree damage status than the individual components.
Stand damage severity and tree mortality analysis
We employed three damage measures to quantify stand-level damage severity: percentage of stems damaged, percentage of basal area lost and the ‘stand-level damage index’. Stand-level damage index was computed based on damage codes of all stems within a survey area. We first created the integrated stem damage code for each stem by combining the indices of uprooting, breakage, leaning and leaned on into a single code ranging from 0 to 3 as described above. We then weighted the code by multiplying the stem relative basal area (the basal area of the stem divided by the total basal area of the plot).
To minimize the sample size effects, we divided all the large mapped stands into subplots of ∼1 000 m2 before we compared the values across the various-sized PSPs and MPPs. To compare changes in species dominance, we calculated species importance values [IV = (relative density + relative basal area)/2)] for all species. To examine population changes of trees in different vertical strata, all tree stems were assigned to one of five strata by diameter class: sapling (1 cm < d.b.h. ≤ 2.5 cm), juvenile (2.5 < d.b.h ≤ 5 cm), small (5 cm < d.b.h. ≤ 10 cm), medium (10 cm < d.b.h. ≤ 25 cm) and large tree (d.b.h. > 25 cm). We compared changes of species importance value over three measurement intervals (the pre-hurricane period, 1989/90–1992/93; the hurricane period 1992/93–1997/98 and the post-hurricane period, 1997/98–2000/01).
We analyzed changes in mortality for the three sampling intervals by calculating the annual mortality rate (m) for each of the five size classes by species for those species with 20 or more individuals in the size class. In this study, the mean annual mortality rate was derived from the exponential model of population growth (or decline) and was calculated as m = (ln (Nt/N0))/t, where N0 and Nt are the number of (alive) stems at the beginning of the interval t (years) and the number of those still alive at the end of the interval. We calculated stem density for each PSP and each subplot of the seven MPPs for each of the three sampling intervals mentioned above. We examined stand-level basal area loss by calculating the percentage difference in stand basal area between the projected 1996 basal area and post-hurricane surveys. The annual basal area increase for each plot was derived from pre-hurricane period data (i.e. 1988/89–1992/93). To project 1996 basal area, we assumed a constant annual diameter growth for all plots during the pre-hurricane period from 1988/89 to 1996.
Newly created gap number, total gap size and GFR [(percentage of gap area at the end of interval t minus percentage of gap area at the beginning of interval)/t] were measured for two sampling intervals (pre-hurricane 1989–1992 and hurricane period 1992–1997) for all large mapped stands. We used Runkle's (1982) expanded gap concept to define the gap size and adopted 25 cm d.b.h. as the minimum diameter of the trunk of a tree that can form a gap when it dies or falls.
Tree spatial pattern analysis
We investigated pattern in tree mortality in two MPPs based on second-order spatial analysis (Ripley's K-function) with SPPA software (Haase 2002). Ripley's K-function is based on the empirical distribution of point-to-point distance (Diggle 1983; Haase 1995; McDonald et al. 2003; Ripley 1976, 1981; Skarpe 1991). We started the analysis at a radius t of 0.25 m with 0.25 m increments up to 40 m. We calculated the sample statistic-based Ripley's K-function (K(t) = λ−1E(t), where E(t) is the expected number of points within a distance t from any arbitrary points). λ, the mean intensity, is estimated as n/A, where n is total number of trees and A is total area sampled. We then performed the transformation to yield a linear plot of the sample statistic against t and a further transformation of a derived K-function .
After transformation, L(t) = 0 gives an expectation of zero for any value of t when spatial pattern is Poisson randomness (Skarpe 1991). A significant positive sample statistic suggests a clumped distribution of sample points, whereas a significant negative sample statistic suggests a regular (uniform) pattern (Diggle 1983). The K-function L(t) was generated from the survey data and then these data were randomized to generate the test of significance as confidence limits. In this study, we used the lowest and highest L(t) of 99 randomizations to define the lower and upper bound of a 99% confidence interval. If the sample statistic remains within the bounds of the confidence interval at any given t, the null hypothesis of complete spatial randomness cannot be rejected (Haase 2002).
Results
Stem damage levels
Uprooting was the major form of damage for medium and large trees (d.b.h. > 10 cm) resulting from Hurricane Fran. Overall, across all MPPs 9.2% of previously existing medium and large trees (n = 605) were either partially or completely uprooted. In the 28 pine PSPs, 9.7% of the medium and large trees were uprooted. In the six uneven-aged upland hardwood PSPs, an average of 6.6% of existing medium and large stems were uprooted. Within the two mapped pine stands during the hurricane, 16.1% (Graveyard) and 10.5% (Land's end) of existing medium and large trees were uprooted. In the two significantly damaged upland hardwood plots, 16.5% (Bormann) and 16% (Rocky) of the large and medium trees were uprooted. The variance of the uproot rate was high within and among the plots, reflecting the spatial heterogeneity of the storm impacts. In the 34 PSPs, the percentage of uprooting varied from 0 to 53.3%, whereas the percentage of uprooting varied from ∼4 to 16.5% in the seven large MPPs.
Large canopy trees (d.b.h. > 25 cm) were the most damaged tree-size group in both pine and hardwood forests. In the 28 pine PSPs, 11.7% of large canopy trees were uprooted. In the two large mapped pine stands, 22.5 and 13.3% of large trees were uprooted, whereas 24.3 and 27% of large trees were uprooted in the two most heavily damaged mapped hardwood plots. In addition, uprooting rates showed the greatest among-plot variation in this size class. The uprooting percentages varied from 0 to 66.7% among 28 pine PSP stands and 10.8 to 24% among the six uneven-aged hardwood PSPs. In the three less damaged mapped hardwood plots (MPPs), 6.5–9% of large canopy trees were uprooted by the hurricane (Table 2).
Stem damage (%) by 1996 Hurricane Fran in the seven MPPs in the Duke Forest, North Carolina, USA
| Uprooting | Breakage | Leaning | Bent | Pinned | |
| Pine stands | |||||
| Graveyard | |||||
| d.b.h. > 25 cm | 22.46 | 6.15 | 20.62 | 0.23 | 0.46 |
| d.b.h. > 10 cm | 16.10 | 9.09 | 14.13 | 3.12 | 0.86 |
| d.b.h. ≤ 10 cm | 3.06 | 8.50 | 3.06 | 3.56 | 2.27 |
| d.b.h. > 2 cm | 7.30 | 8.69 | 6.66 | 2.67 | 1.90 |
| Land's end | |||||
| d.b.h. > 25 cm | 13.33 | 6.64 | 11.28 | 0.51 | 0.00 |
| d.b.h. > 10 cm | 10.45 | 9.15 | 6.32 | 2.61 | 3.05 |
| d.b.h. ≤ 10 cm | 1.44 | 6.48 | 2.02 | 4.32 | 17.13 |
| d.b.h. > 2 cm | 3.61 | 7.00 | 3.03 | 3.82 | 13.38 |
| Upland hardwood stands | |||||
| Bormann | |||||
| d.b.h. > 25 cm | 24.33 | 4.00 | 21.33 | 0.67 | 2.00 |
| d.b.h. > 10 cm | 16.48 | 8.95 | 12.64 | 2.13 | 4.55 |
| d.b.h. ≤ 10 cm | 3.75 | 7.98 | 2.90 | 4.47 | 13.59 |
| d.b.h. > 2 cm | 6.95 | 8.20 | 5.34 | 3.88 | 11.32 |
| Rocky | |||||
| d.b.h. > 25 cm | 27.06 | 5.00 | 16.76 | 0.59 | 4.12 |
| d.b.h. > 10 cm | 15.96 | 5.03 | 9.07 | 1.97 | 3.50 |
| d.b.h. ≤ 10 cm | 1.91 | 3.71 | 1.01 | 3.52 | 8.66 |
| d.b.h. > 2 cm | 5.48 | 4.06 | 3.06 | 3.12 | 7.32 |
| Bryan Center | |||||
| d.b.h. > 25 cm | 6.58 | 6.58 | 0.41 | 0.00 | 0.00 |
| d.b.h. > 10 cm | 4.02 | 6.35 | 0.17 | 1.34 | 0.67 |
| d.b.h. ≤ 10 cm | 0.28 | 2.65 | 0.00 | 3.11 | 2.46 |
| d.b.h. > 2 cm | 1.09 | 3.45 | 0.04 | 2.73 | 2.07 |
| Wooden Bridge | |||||
| d.b.h. > 25 cm | 9.18 | 1.02 | 8.16 | 2.04 | 2.04 |
| d.b.h. > 10 cm | 4.95 | 4.95 | 6.31 | 1.35 | 4.50 |
| d.b.h. ≤ 10 cm | 3.16 | 3.94 | 4.47 | 2.63 | 6.58 |
| d.b.h. > 2 cm | 3.82 | 3.82 | 5.15 | 2.16 | 5.81 |
| Oosting | |||||
| d.b.h. > 25 cm | 6.53 | 2.46 | 0.92 | 0.23 | 0.46 |
| d.b.h. > 10 cm | 4.09 | 1.61 | 0.04 | 3.12 | 0.86 |
| d.b.h. ≤ 10 cm | 0.74 | 2.95 | 0.21 | 3.56 | 2.27 |
| d.b.h. > 2 cm | 1.75 | 3.06 | 0.44 | 2.67 | 1.90 |
Note: stem damage percentage was computed as the percent of uprooting, breakage, leaning, bending and pinned stems against their stem number pre-disturbance (1992/93) in each size category. Uprooting including both partial and complete uprooting stems. Breakage includes stems with >35% canopy losses.
In contrast to the medium and large trees, the damaged understory saplings, juveniles and midstory trees (d.b.h. ≤ 10 cm) appeared mostly to be pinned or bent by their large neighbors. The ranking of damage types for the understory saplings, midstory juveniles and small trees was pinned > bent > breakage > leaning > uprooted. Again, the variation in damage was high among plots. In one large loblolly pine stand (Graveyard), 17% of previous saplings, juveniles and small trees were pinned, whereas in another large loblolly pine stand (Land's end), the percent of pinned stems was only 2.27%. Our results suggest that understory and midstory trees experienced highly uneven indirect damage caused by direct, hurricane-induced damage to their large neighbors.
Among-stand variation in damage and within-stand spatial heterogeneity
We used the weighed mean stem damage index to define stand-level tree damage severity and examined the degree of hurricane-induced spatial heterogeneity of damage. The index should be a sensitive indicator as it provides an integrated assessment for stand damage. Our results show a high degree of variation in forest stand damage severity among the 34 PSPs that span the landscape of the Duke Forest (Table 3). Stand-level tree damage severity on the 1–3 index varied significantly among both PSP pine stands (n = 28, mean damage index = 0.34 ± 0.45 standard deviations) and PSP hardwood stands (n = 6, mean damage index = 0.36 ± 036 standard deviations). The mean damage indices of the seven mapped plots divided into ∼1000 m2 subplots (therefore comparable with PSPs) ranged from 0.07 ± 0.11 to 0.64 ± 0.53. These results suggest a complex, patchy pattern of hurricane damage across the landscape.
Within-stand damage variation in two mapped pine and five mapped hardwood plots and among-stand damage variation in 34 permanent sampling plots in the Duke Forest, North Carolina, USA
| Plot names | N | Mean | Standard deviation | Minimum | Maximum |
| Pine stands | |||||
| Graveyard | 12 | 0.58 | 0.42 | 0.10 | 1.48 |
| Land's end | 9 | 0.52 | 0.47 | 0.12 | 1.34 |
| PSP pine stands | 28 | 0.34 | 0.45 | 0.01 | 1.54 |
| Upland hardwoods | |||||
| Bormann | 16 | 0.50 | 0.37 | 0.01 | 1.22 |
| Rocky | 20 | 0.64 | 0.53 | 0.03 | 1.83 |
| Bryan Center | 20 | 0.11 | 0.10 | 0.00 | 0.39 |
| Wooden Bridge | 6 | 0.24 | 0.36 | 0.00 | 0.96 |
| Oosting | 64 | 0.07 | 0.11 | 0.00 | 0.55 |
| PSP hardwoods | 6 | 0.36 | 0.36 | 0.00 | 0.70 |
The damage severity was examined by using stand damage index.
Note: stand damage index was computed based on all stems >2 cm within a stand. We first created an integrated stem damage code for each stem in the stand by combining all the information of uprooting, breakage, leaning and leaned up to a single code ranging from 0 to 3 (see ‘Methods’ for detailed code criteria), we then weighted the code by multiplying the stem relative basal area (i.e. the basal area of the stem divided by the sum of all stem in the plot). The stand damage index was the average value of the weighted stem integrated stem damage code of all stems in the stand. The range of stand damage index by definition is from 0 to 3. N is the number of subplot divided in each mapped plot and the amount of the PSPs. The size of subplots varied slightly but was generally close to 1000 m2.
There was substantial variation in damage within the seven large, intensively surveyed MPPs, each of which had consistent within-plot species composition, structure and disturbance history (Table 3). The subplots in the two mapped pine stands (Graveyard 1.3 ha and Land's end ∼1 ha) had mean damage indices of 0.58 ± 0.42 and 0.52 ± 0.47, respectively. The mean damage indices of the other five large mapped hardwood plots ranged from 0.07 to 0.64, with standard deviations either greater than the mean damage indices or close to their means. This indicated that Hurricane Fran had substantial within-stand spatial heterogeneity, and this small-scale damage heterogeneity needs to be taken into consideration in evaluating hurricane effects on forests and simulating forest recovery from large wind disturbance events.
Treefall pattern
In contrast to the observed large variation among plots in damage severity, our data showed striking similarities in treefall orientations among the scattered tree plots in the Duke Forest. The uprooted stems generally fell toward the SSW, and the maximum percentage of azimuths in most mapped plots was 200–210° (Fig. 2), indicating the local surface wind direction when Hurricane Fran struck the Duke Forest. Azimuths of the fallen trees among the plots were primarily aligned within 45°, suggesting that the treefalls were formed within a very short time period during the hurricane, and strong wind gusts were the major cause of uprooting of large canopy trees.
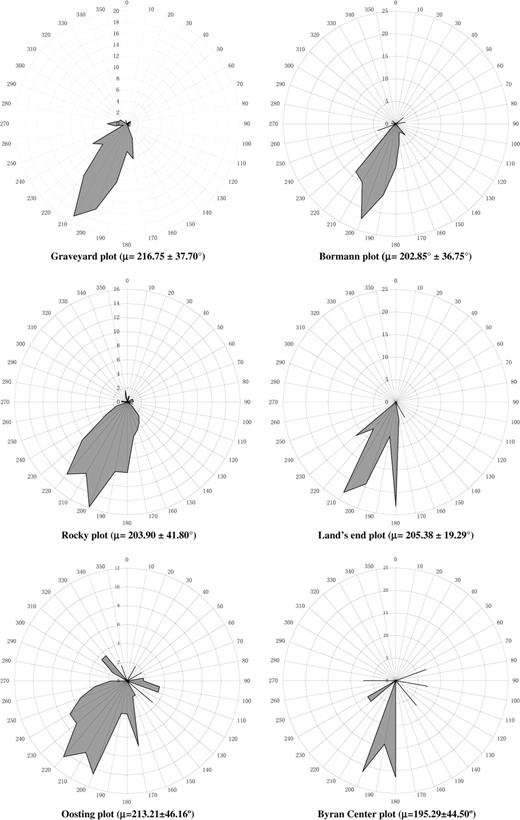
Percentage of azimuths of uprooting trees in six mapped plots in the Duke Forest, NC, USA. Note: another mapped plot in the Duke Forest (Wooden Bridge plot) is not included due to only three trees were uprooted in the hurricane event. The azimuths of the three trees were 202° and 230°. μ is the mean vector of all fallen tree orientations and values after ± are circular standard deviations of each plot.
Changes in spatial pattern of trees
Second-order spatial point pattern analysis of two MPP stands, one pine and one hardwood dominated, revealed a clumped and patchy distribution of hurricane-induced tree mortality respectively (Graveyard and Bormann, 1.3 and 1.96 ha, Figs 4a, b and 5, Figures S1 and S2 are available at Journal of Plant Ecology online). Immediately after Hurricane Fran (ca. 1 year after the hurricane), the distribution of the dead canopy trees in the Graveyard mapped pine stand was clumped at middle scales (12–38 m; Fig. 5). In this P. taeda plot, the upper layer tree deaths subsequent to the hurricane (1–5 years) were clumped at both small (4–18 m) and the whole stand level (∼1.3 ha). The direct hurricane mortality patterns in the mapped hardwood stand (Bormann) appeared patchy at the stand scale but mortality over the next 5 years was less conspicuously clumped. These results suggest that hurricane-induced tree mortality was significantly clumped within a forest stand, probably due to small-scale spatial heterogeneity in wind gusts (microbursts) and the different abilities of tree species to resist high winds, and to some extent this pattern carried over to mortality in the 5 years following the storm.
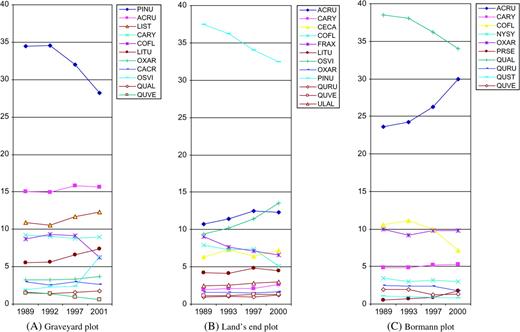
change in importance value (IV) of major tree species in three mapped plots in three periods (pre-hurricane, hurricane period and post hurricane) >10 years. Data are shown for all species with IV ≥1 over the three periods. The total value of IV is 100. The survey years for each plot pre-hurricane vary from 1989 to 1993 and post hurricane vary from 2000 to 2001. Species abbreviations: PINU, Pinus spp.; ACRU, Acer rubrum; LIST, Liquidambar styraciflua; COFL, Cornus florida; LITU, Liriodendron tulipifera; OXAR, Oxydendrum arboreum; CACR, Carpinus carolina; OSVI, Ostrya virginiana; QUAL, Quercus alba; QUVE, Quercus velutina; CARY, Carya spp.; CECA, Cercis canadensis; FRAX, Fraxinus spp.; QURU, Quercus rubra; ULAL, Ulmus alata; NYSY, Nyssa sylvatica; PRSE, Prunus serotina; QUST, Quercus stellata.
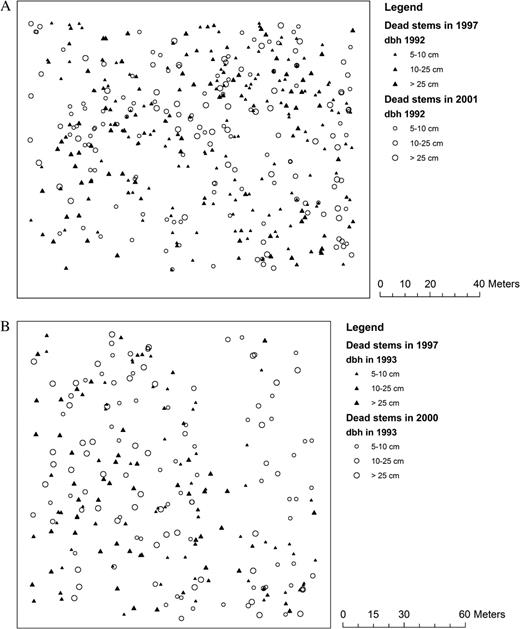
(a) Pattern of tree mortality (stem d.b.h. ≥ 5 cm) in a loblolly pine stand (Graveyard plot) in the Duke Forest after the 1996 Hurricane Fran, NC, USA. (b). The mortality stem (d.b.h. ≥ 5 cm) maps of Bormann plot in the Duke Forest after the 1996 Hurricane Fran, NC, USA.
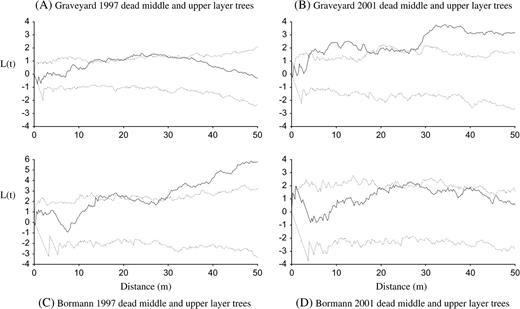
Transformed Ripley's K(d) for tree mortality over time in Graveyard and Bormann plot for the middle and upper layer trees (i.e. d.b.h. > 10 cm) in the Duke Forest, NC, USA. The sample statistic L(t) is plotted against t (solid line). The dotted lines give a 99% confidence envelope for complete spatial randomness.
The spatial distributions of the residual living overstory trees in the two damaged MPPs become more clumped due to the hurricane damage. This pattern is particularly evident in the Graveyard pine plot in that pre-hurricane upper layer trees (d.b.h. > 25 cm) became substantially more clumped from 6 m to the whole stand scale after the hurricane. In the mapped upland hardwood plot (Bormann), the pre-hurricane distribution of living upper layer trees was regular at small scales (0–14 m) but became clumped at the whole stand scale after the hurricane. The midstory of both the mapped pine and upland hardwood stands remained visually unchanged with the exception that understory saplings in the hardwood stand became more clumped at scale of 8–40 m. Overall, the sapling and juvenile trees in understory in the mapped pine stand (Graveyard) changed little in spatial distribution, whereas the understory in the mapped hardwood plot became more clumped.
GFR and gap size
The major source of the increased within-stand and landscape-scale spatial heterogeneity in the Duke Forest was the uneven gap formation caused by uprooting during Fran. Table 5 shows the substantially increased but greatly variable average annual GFR of the seven MPPs during the hurricane as compared to the pre-hurricane baseline GFR. The annual tree GFR in the two damaged pine MPPs (Graveyard and Land's end) increased about 5- to 12-fold from the pre-hurricane period (1989–93) 1.8 and 0.9 to the hurricane period (1993–97) 9.7 and 10.8%, respectively. The changes in annual GFR in the five mapped hardwoods plots varied greatly, ranging from no significant increase in the less damaged stands (Oosting and Wooden Bridge) to about a 12-fold increase in the substantially damaged stands (Graveyard and Bormann).
The hurricane not only greatly increased the frequency of gap formation in the damaged areas but also resulted in a greater diversity of treefall gap sizes. The maximum sizes of tree gaps in the MPPs after the hurricane increased dramatically, 18- to 34-fold as compared to the baseline level (Table 5). The average gap sizes after the hurricane in the seven mapped plots increased 2- to 7-fold (ca. 400–1000 m2) as compared to the pre-hurricane level (ca. 100–250 m2). The minimum sizes of hurricane-induced gaps in the seven MPPs either remained relatively similar to pre-hurricane levels or slightly decreased because some smaller trees had been uprooted to form a set of smaller tree gaps during the hurricane.
Species susceptibility and delayed mortality
Hurricane Fran resulted in increased tree death in damaged plots in the 5 years following the storm as compared to the pre-hurricane background mortality. Table 4 shows annual size-specific mean mortality rates of major species in three periods (i.e. pre-hurricane, hurricane period and post-hurricane period) in two selected MPPs (Graveyard loblolly pine and hardwood Bormann plot). Overall, all size classes of trees experienced increased annual morality. Particularly striking is that large canopy trees, which normally have the lowest background mortality, become the highest mortality tree group with mortality rates up ∼19-fold from 0.22 to 4.22 %/year in the pine stand, and up ∼5.5-fold from 0.68 to 3.74%/year in the uneven-aged upland hardwood plot. This clearly suggests that a major consequence of hurricane damage has been an inversion of the ‘normal’ tree morality pattern where smaller trees usually experience higher mortality than large trees.
Mean annually mortality (%/year) in the Graveyard and the Bormann plot in the Duke Forest, North Carolina, USA
| Mean annually mortality (%/year) | |||
| Pre-hurricane (1989–93) | Hurricane-period (1993–97) | Post-hurricane (1997–2000) | |
| Pine stand (Graveyard plot) | |||
| 2.5–5 cm | 2.82 | 3.67 | 3.61 |
| 5–10 cm | 2.86 | 3.75 | 3.76 |
| 10–25 cm | 1.14 | 1.82 | 2.28 |
| >25 cm | 0.22 | 4.22 | 3.18 |
| Upland hardwood (Bormann plot) | |||
| 2.5–5 cm | 1.52 | 2.55 | 4.13 |
| 5–10 cm | 0.93 | 2.06 | 2.74 |
| 10–25 cm | 0.71 | 1.87 | 2.18 |
| >25 cm | 0.68 | 3.74 | 5.92 |
Note: changes in tree mortality for each of the three sampling intervals (i.e.1989/90–1992/93 as pre hurricane period, 1992/93–1997 as hurricane period and 1997–2000/2001 as post hurricane period). Mean annual mortality rate derived from the common exponential model of population growth (or decline) and was calculated by: m = (ln (Nt/N0))/t where Nt and N0 are the number of (alive) stems at the beginning and end of interval t (years).
Comparison of GFR for seven mapped plots in the Duke Forest before and after Hurricane Fran
| Period | New gaps | Gap size (m2) | GFR (%/year) | ||
| Average | Maximal | Minimal | |||
| Pine stands | |||||
| Graveyard | |||||
| Pre-hurricane (1989–92) | 2 | 240.00 | 352.67 | 127.33 | 0.86 |
| Hurricane period (1992–97) | 6 | 1172.53 | 4341.65 | 78.11 | 10.82 |
| Land's end | |||||
| Pre-hurricane (1989–93) | 4 | 180.84 | 390.87 | 86.17 | 1.83 |
| Hurricane period (1993–97) | 10 | 382.51 | 2126.45 | 45.13 | 9.66 |
| Upland hardwoods | |||||
| Rocky | |||||
| Pre-hurricane (1985–90) | 6 | 187.86 | 447.77 | 60.55 | 3.42 |
| Hurricane period (1990–97) | 10 | 1084.59 | 8029.15 | 64.82 | 13.29 |
| Wooden Bridge | |||||
| Pre-hurricane (1986–91) | 3 | 75.14 | 110.64 | 47.50 | 0.86 |
| Hurricane period (1991–98) | 6 | 178.32 | 260.44 | 81.77 | 2.91 |
| Bormann | |||||
| Pre-hurricane (1989–93) | 6 | 145.59 | 228.56 | 79.48 | 1.01 |
| Hurricane period (1993–97) | 9 | 1092.52 | 6156.67 | 47.52 | 12.54 |
| Bryan Center | |||||
| Pre-hurricane (1986–91) | 17 | 204.08 | 489.31 | 66.30 | 3.58 |
| Hurricane period (1991–98) | 15 | 357.92 | 1063.23 | 72.14 | 3.59 |
| Oosting | |||||
| Pre-hurricane | N/A | N/A | N/A | N/A | N/A |
| Hurricane period (1990–98) | 53 | 349.43 | 1313.71 | 32.89 | 3.53 |
Note: we used Runkle's expanded gap concept to define gap size and adopted 25 cm d.b.h. as the minimum diameter of the trunk of a tree that can form a gap when it dies or falls. The gap size was measured for the stem maps by using ArcGIS 9.0 (ESRI Inc. 2004). The GFR was calculated as the percentage of gap area at the end of an intervals minus the percentage of gap area at the beginning of interval) divided by t (years).
In the pine-dominated Graveyard plot, the annual mean mortality across all species increased from the pre-hurricane level of 2.86 to a post-hurricane level of 3.98 %/year (Table S2 is available at Journal of Plant Ecology online). P. taeda, Quercus rubra, Oxydendrum arboreum, Nyssa sylvatica, Cornus florida and Liriodendron tulipifera experienced significantly higher morality rates (about double), whereas a few trees such as Carya spp., Fraxinus america, Liquidambar styraciflua and Ostrya virginiana appeared resistant to hurricane damage and experienced reduced mortality rates in both the hurricane and post-hurricane periods. In the hardwood-dominated Bormann stand, the annual mean mortality for all species combined increased from pre-hurricane 1.32 to 3.21%/year. Most of the trees had a large increase (2- to 3-fold) in tree mortality with the exception of N. sylvatica, this exception being consistent with the observation of Abrams (2006) that Nyssa is particularly long lived and resistant to stress. Major dominant Quercus species and C. florida had quite high mortality. The variable degree of increase of tree mortality among tree species indicated uneven tree species susceptibility and tree damage.
In addition to the overall increase in tree mortality immediately after the hurricane, we found substantial delayed tree mortality for loblolly pine and many hardwood species. Mortality rates of several dominant species such as P. taeda, Acer rubrum, L. tulipifera and Quercus velutina in the Graveyard plot and Quercus alba, Q. rubra and Carya spp. in the Bormann plot increased substantially in the post-hurricane period. In the Graveyard plot, Hurricane Fran caused about an 8.7-fold tree mortality rate increase for the P. taeda trees, and this remained 9-fold higher 5 years post-hurricane.
The midstory hardwood species in the mapped pine plots, including C. florida, A. rubrum and Q. velutina, sustained mortality rates in the post-hurricane period roughly double their rates during the hurricane period. Delayed tree morality was also found in the understory. Juvenile trees (2.5–5 cm) and small trees (5–10 cm) in the Graveyard plot experienced an increase in annual mortality rate of 30% from 2.8 to 3.7%/year with the hurricane but increased even more in the post-hurricane period reaching 3.8%/year.
In the oak-dominated Bormann plot, tree mortality of large canopy trees (d.b.h. > 25 cm) during the hurricane period was 5.5-fold higher than that of the pre-hurricane period and increased even higher to about a 9-fold increase in the post-hurricane period. In this forest, annual mortality rates in the post-hurricane period were roughly tripled for small trees (5 ≤ d.b.h. ≤ 10 cm) and doubled for juveniles (2.5 ≤ d.b.h. ≤ 5 cm) compared to the mortality rates of the pre-hurricane period.
Stand density and basal area
The decrease in stand density resulting from Hurricane Fran varied significantly among the MPPs from no detectable change in the less damaged plots to 10.5% in the substantial damaged plots. The decrease in density of large trees (>10 cm d.b.h.) in both heavily damaged pine and hardwood plots was due primarily to the high rate of uprooting. Variances of basal area loss were high within the plots due to the patchiness of hurricane-induced damage. Moreover, there was a continuous decline in basal area in the damaged stands following the hurricane as a result of the delayed post-hurricane tree mortality. The degree of decline was different between pine and hardwood forests. Two substantially damaged mapped pine plots (Graveyard and Land's end) declined in stand basal area by about 1–2%, whereas the heavily damaged Bormann plot declined 10–11% in stand basal area in the 5 years following Fran. The large difference in rates of basal area decline between pine and hardwood stands (1–2 versus 9%) in large part was the result of differences in post-hurricane mortality characteristics of pine trees (often completely dead within a year of uprooting) and large hardwood trees with delayed mortality.
Tree species composition and relative abundance
Overall, the total number of tree species present in the plots increased moderately by 5 years after the hurricane. There were no tree species lost through Hurricane Fran, and 5 years after the hurricane a modest increase in number of exotic species and shrubs was evident in both pine stands and in uneven-aged upland hardwood stands. In the Graveyard pine stand, the shade intolerant, fast-growth Ailianthus altissima, along with Carya ovalis and three deciduous shrub species, Viburnum acerifolium, Viburnum prunifolium and Viburnum rafinesquianum, recruited into the stand. The 1.96-ha Bormann oak stand gained four woody species in 2000 including Ilex opaca, Ostrya virginiana, Juglans nigra and Ulmus rubra. Major new species in other MPPs were Asimina triloba, Celtis laevigata, Ligustrum japonicum, Ligustrum sinense and Rhododendron periclymenoides.
Discussion
Hurricane disturbance and major damage types
Hurricane Fran caused various forms of damage to trees in the Duke Forest, with the stem damage types varying in association with pre-hurricane stem size and vertical strata (Table 2). The primary impact of Hurricane Fran on the Duke Forest was on canopy trees with tree damage and stem size showing a strong positive correlation (Xi et al. 2002). This finding is consistent with widely observed, size-specific damage patterns documented as occurring during strong windstorm events in many tropical and temperate forests (see Everham and Brokaw 1996). Hurricane-induced understory damage has been less frequently reported in the literature. We found that understory saplings and small trees often had their stems bent or pinned by their large fallen neighbors but were relatively less damaged than overstory trees, largely due to a possible ‘shield effect’ from the canopy trees. Studies in the French West Indies (Imbert et al. 1996), New Hampshire (Foster 1988) and Minnesota (Webb 1988) have shown similar results.
The amount of total rainfall immediately prior to the storm event is an effective indicator of major tree damage types (DeCoster 1996). In the present study, uprooting was the major damage type for the medium and large trees, and the pits and mounds caused by uprooting greatly increased microsite variation in the damaged stands providing diverse habitats for potential colonization of herbs, shrubs and trees. Hurricane Fran brought ca. 224 mm of rainfall to the Duke Forest and adjacent areas during the 2-day hurricane period, and perhaps as importantly there was a heavy rainfall event (ca. 76 mm) 2 days before Fran that had already saturated the soil. Similar patterns have been reported in central New England (Foster and Boose 1992), the southern Appalachians (Greenberg and McNab 1998) and in Japan (Naka 1982). In contrast, Hurricane Hugo, an even more intense storm that crossed the Carolina Piedmont in 1989 but with much less rain, caused substantially more breakage relative to uprooting, both in bottomland (Sharitz et al. 1992) and upland forests (DeCoster 1996).
Our finding of a consistent azimuth of treefall combined with the patchy nature of damage, even on relatively flat uplands, is consistent with the proposed intense small-scale (sub-kilometer scale) boundary layer rolling effects reported by meteorologists for Hurricane Fran (Wurman and Winslow 1998). We found that despite the fact that there was large spatial damage variation, the azimuths of uprooted boles were strikingly similar in our widely scattered plots across the Duke Forest.
Variation in damage
Our results are consistent with widely reported patchy damage patterns of hurricanes and other windstorms across forested landscapes (Bellingham et al. 1992; Brokaw and Walker 1991; Foster 1988). Consequently, we can expect that the wind-damaged Piedmont stands will experience considerable variation in subsequent, post-hurricane successional recovery paths.
A related issue is the hurricane-induced increase in size of gaps. Hurricanes create a complex mosaic of patches within a forest stand by creating canopy gaps. The gaps created by Hurricane Fran have distinctive aspects compared with the gaps created by more frequent, small-scale treefalls. The size of newly formed, hurricane-induced gaps varied dramatically, ranging from about 40 m2 to several thousands m2 (Table 5), whereas in the absence of large hurricanes, the mortality of an individual tree or a small group of trees tends to create gaps of limited size (in this case, 100–150 m2). These large gaps are critically important for major tree species regeneration in temperate forests since the small gaps created by individual treefalls may not be big enough to maintain the extant tree species diversity of temperate forests (e.g. Beckage et al. 2000). Large canopy gaps from severe hurricane damage greatly increase light variability in the understory and have profound effects on tree individual growth and regeneration (Merrens and Peart 1992; Runkle 1998).
Increased and delayed tree mortality
Our long-term pre-hurricane and post-hurricane data confirm the widely speculated but little documented phenomena of delayed tree mortality (see Allen et al. 1997; Sharitz et al. 1992; Walker et al. 1992). In the case of Hurricane Fran's impact on the Duke Forest, an immediate post-storm survey of tree mortality would have produced a significant underestimate of storm-induced mortality. This strongly suggests that the effects of hurricane damage on tree mortality and subsequent changes in species diversity and dynamics must be assessed over a longer time scale. For our study, a period of at least 5 years would have been needed to detect the overall tree mortality process and subsequent compositional change.
Compositional change
The effects of hurricanes on species composition of temperate forests can be variable between studies as a result of different minimum tree sizes studied. In this study of woody species, we failed to detect significant changes in tree (>1 cm d.b.h.) species composition, either from an immediate loss or a significant increase in species. The 5-year post-hurricane data showed that this hurricane event, which had strong impacts on the forest structure, had only modest immediate effects on tree species composition. A few woody, light-demanding, earlier successional shrub and exotic trees species invaded the new gaps. However, we have not yet seen significant increases in exotic tree species. Our findings contrast with the more common expectation that a significant change in species composition typically results from catastrophic wind disturbances (e.g. Whigham et al. 1999). The most likely explanation for this modest composition change is that the damage effect on species composition may be delayed and the compositional changes in tree species may have considerable time lag, reflecting the generally low seedling and sapling growth rates. We expect that the data from the next survey to provide a more complete picture of tree composition change following large hurricanes in this region.
Hurricane effects on forest succession
The disproportionably high tree mortality of large canopy dominants and subsequent structural changes have different effects on the pine forests as compared with the hardwoods of the study area. In particular, the hurricane speeded up the rate of succession in the damaged pine stands and increased diversity in the uneven-aged hardwood forests.
In the absence of severe disturbance, 80- to 100-year-old pine stands will gradually change to uneven-aged hardwoods (Peet and Christensen 1987). In these stands Hurricane Fran reduced the dominance of the even-aged pine trees and increased the dominance of hardwood species already present in the understory, such as A. rubrum and L. styraciflua. In this regard, Hurricane Fran ‘accelerated’ the succession process of pine forests to a later successional stage.
Large, infrequent hurricane events have complex effects on the uneven-aged hardwood forests. The enhanced but uneven increase in tree mortality created by Hurricane Fran resulted in a complex mosaic that contained simultaneously multiple developmental states. Overall, strong windstorms have profound effects on the structure of the hardwood forest communities in the Piedmont and have, to a certain extent, resulted in divergent successional trajectories reflecting species’ differential tolerances to wind damage and differential growth response after release.
Historically, disturbance and succession have strongly shaped the structure and composition of Piedmont forests (Cowell 1998; Peet and Christensen 1987). Exclusion of wildfires over the last century has been assumed to be one of the major causes for the wide-spread trend toward increase dominance of A. rubrum in the Duke Forest and across much of eastern United States (Abrams 1998; McDonald et al. 2003). Although our data do not allow explicit comparison of the recovery patterns following wind versus fire disturbance, our results showed that large-scale hurricane disturbance appeared to contribute to the trend of increasing A. rubrum dominance due to substantially increased growth of the well-developed understory seedling and sapling population following damage to the established canopy.
Conclusions
Our study, based on analysis of both long-term baseline data and 5 years of post-hurricane recovery data, demonstrates the variable effects of hurricanes on the structural attributes of Piedmont forests. Changes in tree species composition, however, were modest. Hurricane Fran significantly altered forest structure by selectively removing larger canopy trees, by increasing both within-community structural heterogeneity and landscape patchiness and by unevenly increasing the growth rates of existing midstory and understory tree species. Our study showed that wind-induced mortality can be subtle, complex and delayed depending on several contributing factors such as species of interest, individual size and life form. These hurricane-induced changes are likely to lead to less predictable successional development.
The effects of intensive hurricanes vary greatly among forest types and are closely related to the pre-hurricane community attributes and tree species mixtures in specific stand. For pine forests, Hurricane Fran appeared to accelerate the on-going successional transition process from earlier successional pine forests to the late successional, uneven-aged hardwood forests. For the uneven-aged hardwood forests, the varied hurricane damage set back their succession to an earlier hardwood stage with higher variation among patches. This led the whole hardwood forest toward a more diverse forest of greater spatial complexity. The significant within and between stand variation in wind damage, as demonstrated in our study, inserted strong and longer term impact on subsequent forest development. Consequently, we anticipate more diverse and less predictable hardwood forests in impacted areas of the Piedmont, at least for the near future.
The next 5–10 years of observation of these plots is critical for a better understanding of the long-term recovery process, particularly the underlying mechanisms of forest recovery from large disturbances. Nonetheless, the general patterns we report in this paper should be applicable to Piedmont forests and more generally to adjacent areas of the southeastern United States.
Supplementary Data
Supplementary material is available online at Journal of Plant Ecology online.
We thank staff of the Duke Forest and in particular Judson Edeburn and Richard Broadwell who provided logistic help. Meteorologists Joel Cline in National Weather Service and Ryan Boyles in State Climate Office of NC provided climate data. We are grateful to two anonymous reviewers for their constructive comments on the manuscript of this paper. We also would like to thank our many dedicated assistants for their help with fieldwork. This work was supported by W.C. Coker and A.H. Beers fellowships and a Dissertation Completion Fellowship from the University of North Carolina at Chapel Hill to W.X. and a grant from the National Science Foundation (DEB-97-07551) to R.K.P. and D.L.U.


