


Abstract
To examine the effect of 24-h shift work on autonomic nervous system function via heart rate variability (HRV) methodologies.
Electronic databases (indexed in either PubMed, MEDLINE, CINAHL, SPORTDiscus, or OpenDissertations) were searched from January 1964 to March 2023. A modified Downs and Black checklist was used for assessing methodological quality and the Grading of Recommendation, Assessment, Development, and Evaluation (GRADE) approach was used to evaluate the quality of evidence. Study design, study population, study sample, shift work description, and assessment of HRV metrics and methods were extracted from each study.
A total of 58 478 study articles were identified, of which 12 articles met inclusion criteria. Sample sizes varied from eight to 60 participants, with the ratio of low- to high-frequency HRV (LF/HF) as the most common frequency-domain variable reported. Of the nine included studies that observed LF/HF, three (33.3%) demonstrated a significant increase after 24-h shift work. Moreover, of the five studies that reported HF, two (40%) noted a significant decrease after 24-h shift work. When observing risk of bias, two (16.6%) studies were low quality, five (41.7%) were moderate quality, and five (41.7%) were high quality.
There were inconsistent findings demonstrating an effect of 24-h shift work on autonomic function, with a suggested shift away from parasympathetic dominance. Discrepancies in HRV methodologies, such as the duration of recordings and hardware used for measurement, may have contributed to the disparity in findings. In addition, differences in roles and responsibilities across occupations may explain the incongruence in findings across studies.
INTRODUCTION
Shift work, characterized by irregular and/or long work hours, is a common practice in various occupational settings. In fact, 20%-30% of US employees work some type of irregular work shift, particularly in health care, emergency response, and industrial settings.1,2 Shift work may involve any schedule outside of the period of 7 a.m. to 6 p.m., greater than 8.5 h a day (greater than 40 h per work week), including a rotating schedule.3,4 A number of negative health effects have been associated with shift work schedules including a higher prevalence of physical inactivity, poor diet, smoking, and excess weight compared to non-shift workers.5 Increases in anxiety, depression, and adverse cardiovascular events have also been suggested.6 Torquati and colleagues7 found that shift work was associated with a 26% increased risk of coronary heart disease morbidity and a 20% increased risk of coronary heart disease and cardiovascular disease mortality. Moreover, for every five additional years of shift work, there was a 7.1% increase in developing any cardiovascular disease and a 3% increase in breast cancer risk in females.7,8
Some specific types of shift work operate on a “compressed” schedule, where the individual works 36-40 h per week in fewer than 5 days.4 Such concentrated work schedules are common in occupations like health care and emergency response, where individuals are actively on shift for 24 h. This 24-h shift work is associated with additional physiological and psychological burdens that often lead to worse health outcomes for individuals subject to these work schedules. For example, higher incidences of burnout have been observed for individuals in emergency response, with a proportional increase in years of service and burnout observed in firefighting.9,10 Increased tobacco usage, alcohol consumption, and obesity are all factors reported in shift workers.11 Moreover, higher injury hazard rates have been reported in jobs with exposure to extended hours per week (≥60 h) and extended hours per day (≥12 h).12 Therefore, more targeted research is needed that furthers the understanding of how compressed shift work contributes to these health effects and how we can better monitor and intervene.
The autonomic nervous system (ANS), a part of the peripheral nervous system that helps to regulate physiological processes like heart rate, blood pressure, respiration, and digestion, is significantly impacted by extended shift work.13,14 The ANS comprises three systems, the sympathetic, parasympathetic, and enteric nervous systems. The sympathetic and parasympathetic systems work together to uptake information from the environment and to coordinate responses to internal and external demands.15 The sympathetic system is primarily responsible for energy mobilization (e.g., via enhanced metabolism and blood oxygenation), whereas the parasympathetic system predominates during rest, with the coordination between the activity of the two systems often working to mobilize resources in response to an organism’s needs as well as to restore and maintain homeostasis.15 Alterations in autonomic nervous system activity, including decreases in parasympathetic activity, have been reported in occupational settings including surgeons and nurses,16,17 police officers and firefighters,18,19 as well as industrial settings.20 Evidence of night shift work has shown significant changes in autonomic function, with authors suggesting a shift away from parasympathetic dominance of the autonomic nervous system, as well as circadian variation in autonomic regulation.21,22 Changes in autonomic function may not only compromise workers to perform their daily job tasks in the short term, but it may also influence a shift worker’s physical health outcomes long term.23,24 Little consensus has been gathered regarding the impact of 24-h shift work on ANS response, as such, this systematic review aims to consolidate and interpret the existing empirical literature on 24-h shift work and ANS outcomes.
Heart rate variability (HRV) is a common, non-invasive, and reliable method of assessing autonomic nervous system function. HRV analyzes the variability of time between successive R waves (also called NN distances or the inter-beat interval).25 The distances between successive R waves (i.e., variability) have been implicated in the autonomic nervous system’s capacity to regulate and rapidly cope with an ever-changing environment.26 Observing the impact of autonomic response over a 24-h shift on HRV may provide insight into the interplay between systems and its capacity to mobilize, and then subsequently restore, resources in response to external or internal stimuli.
Measurements of HRV may vary from short (e.g., 5 min) to continuous (e.g., 24 h) recordings. The resulting time series in milliseconds can then be processed in both the time and frequency domains to describe the mechanisms regulating individual heart rate.27 Time-domain measurements quantify the amount of HRV observed during recording periods.28 Commonly used time-domain parameters are the standard deviation of the inter-beat interval of normal sinus beats (SDNN) and root mean square of successive differences between normal heartbeats (RMSSD) (for an exhaustive list of HRV measures, see Table S1). In addition to time domains, the frequency component separates HRV into specific bands identified at different frequency ranges including ultra-low-frequency (ULF) band (≤0.003 Hz), very low-frequency (VLF) band (0.0033–0.04 Hz), low-frequency (LF) band (0.04-0.15 Hz), and high-frequency (HF) band (0.15-0.4 Hz).28 There is disagreement about the contribution of the sympathetic and parasympathetic nervous system to the ULF band.28 However, the VLF band is suggested to be influenced by the renin-angiotensin system and is associated with sympathetic activity.28 While evidence suggests that the HF band is reflective of primarily parasympathetic nervous system activity, the LF component of HRV may be produced by both sympathetic and parasympathetic activity under different conditions.29,30 As a result, the ratio of low- to high-frequency HRV (LF/HF) has been previously intended as an estimator to assess cardiovascular autonomic regulation; however, due to the combined contribution of both parasympathetic and sympathetic activity, the suitability of the LF band, and therefore the LF/HF ratio, has come into question.29,30
The impact of 24-h shift work on ANS response in occupational settings remains unclear and its effect on autonomic function has not been previously reviewed. Therefore, the purpose of the current study was to review the effect of 24-h shift work on autonomic nervous system function measured as HRV in occupational settings. This study is critical because occupations subjected to 24-h shifts are often in positions where physical readiness is key to job success (e.g., firefighters, physicians, nurses, etc.). Furthermore, whether changes in autonomic function vary across distinct occupational settings remains to be determined as differences in job task demand may influence sympathetic and/or parasympathetic activity. As such, it is imperative to monitor autonomic nervous system activity in emergency responders and others that are subject to 24-h shift work as it may capture whether physiological mobilization or restoration is hampered given the extended shift schedules.
METHODS
Search strategy and selection criteria
Our target population was occupational-focused settings that were associated with extended shift work, or shift work greater than or equal to 24 h in duration. The focus of the current review was to observe the effect of extended shift work on autonomic function. As such, neither an intervention nor a control group was required. Articles were selected for inclusion in the present review if the following was fulfilled: (1) the publication described shift work and/or autonomic function (i.e., HRV) in the title or abstract, (2) the length of shift work was equal to or greater than 24 h of continuous shift work for a single shift, (3) the data and/or data set was assessed using HRV metrics, at the minimum, in the frequency domain, (4) the publication was written in English. In addition, articles were excluded from the current review if: (1) shift work was not a primary variable of assessment, (2) heart rate was the only variable assessed and/or frequency domain variables were not conducted or described, (3) sleep is included as and used as an experimental condition, (4) the publication was a case study/series, poster presentation, or systematic review, and (5) the publication was not conducted on human participants.
A primary search was conducted using PubMed, MEDLNE, CINAHL, SPORTDiscus, and OpenDissertations from January 1964 to March 2023. EBSCOhost was used for an aggregated search. EBSCOhost is a central database that provides access to multiple databases at once and, therefore, allowed for multiple searches to be conducted via each database listed above. The search was performed using a combination of two sets of keywords. “Shift work*”, “shiftwork”, “overtime”, “extended hours”, “shift schedule”, “night shift*”, “on call”, and “work shift*”, were combined with the following keywords in separate searches: “autonomic function”, “heart rate variability”, “cardiac autonomic function”, and “autonomic nervous system”. The two sets of keywords were linked by the Boolean operator AND (Table S4). To identify any additional articles, reference lists of primary articles and review papers were also screened.
One reviewer (J.J.) independently screened the abstracts and titles of each study were first screened for relevance to the current review. Inclusion and exclusion criteria were then reviewed and selected studies were identified and included in the review by two reviewers (J.J. and J.R.). Any disagreements between the reviewers, including article inclusion, were resolved by consensus. However, a third individual (N.H.) acted as arbiter if no resolution was made between the two reviewers. Two reviewers (J.J. and J.R.) independently conducted a risk-of-bias assessment of the included studies using a methodological screening criteria checklist adapted from Downs and Black.31 Each question was scored as either a ‘yes’, ‘no’, or ‘unable to determine’. One point was awarded for each ‘yes’ that was scored, except for one item that awarded two points for ‘yes’ and one point for ‘partially’. The risk-of-bias assessment score for each study was then calculated by the summation of all points awarded. Disagreements in the assessment were resolved by discussion. If no resolution arrived after discussion, then a third individual (N.H.) acted as arbiter. Study quality was scored based on established criteria,31 with studies <60% of the applicable criteria considered as low quality, 60%–74% as moderate quality, and >75% as high quality.
Data analysis
The quality of the evidence assessment was considered using the Grading of Recommendation, Assessment, Development, and Evaluation (GRADE) approach. GRADE is described as a systematic approach and framework to the development and presentation of the evidence.32–34 The four levels of evidence to discern the certainty of the evidence were defined as very low, low, moderate, and high.35,36 Level of certainty was determined based on GRADE domains, including risk of bias, imprecision, inconsistency, indirectness, and publication bias.37 One reviewer (J.J.) independently assessed the quality of the evidence.
Assessment of publication bias was assessed in two ways. First, Orwin’s fail-safe N test was used to assess the robustness of the observed overall effect of extended shift work on autonomic nervous system function. Orwin’s fail-safe N test indicates the minimum of missing studies that would be needed to nullify the pooled effect sizes included in the analysis.38 The criterion for a “trivial” Hedge’s g was analyzed from 0.10 to 0.05. In addition, a funnel plot was used to evaluate the existence of publication bias. The funnel plot will be considered an exploratory analysis if less than 10 articles are retained.
A one-study-removed analysis, also referred to as a leave-one-out analysis, was used to assess how each study included in the meta-analysis affected the overall point estimate. The analysis repeats the meta-analysis multiple times by removing each study individually to determine the resulting overall effect with its omission.
The relevant data included for analysis were extracted and categorized by names of the authors and year of publication, study design, sample description, HRV metrics (e.g., frequency and time domain variables), method of HRV collection, HRV sample duration, description of shift work, and study results/conclusions. If no study design was explicitly stated by the original authors, then a reviewer designated what was deemed as the appropriate study design.
Measures of central tendency and variability for HRV-specific outcome measures were extracted for calculating effect sizes. Calculations were provided to measure the magnitude of the differences within each measure. Hedge’s g effect sizes were used due to the small samples of some included studies.39 Effect sizes were determined based upon previous literature40 and were interpreted as trivial (0.0), small (0.2), moderate (0.6), large (1.2), very large (2.0), nearly perfect (4.0), and perfect (infinite). Studies were omitted from effect size calculations if the appropriate measurements of central tendency and variability were unable to be extracted. For the meta-analysis, all procedures were performed in Comprehensive Meta-Analysis Software (version 2.0, BioStat). A random-effect method was used to pool individual study findings using the quantified Hedge’s g effect size calculations and 95% confidence intervals to determine the magnitude of change in autonomic function in individuals after 24-h shift work. Studies that reported within-shift differences of the LF/HF ratio, the LF band, and the HF band were quantified for the meta-analysis to provide consistency across experimental methodology and study populations.
The method for determining effect size for selected studies is described. The range was used to calculate the standard deviation for one study41 according to Hozo et al. (2005),42 where SD = range/4 is recommended as the best estimate for sample sizes of 15 through 70. A web plot digitizer was used for two studies43,44 to convert the data from a figure. One study45 was not included for effect size calculations as the resulting values were greater than three standard deviations from the data set. Data for effect size calculations were unable to be extracted for two studies.46,47
RESULTS
Literature search
The identification of studies via databases, along with the assessment process, is described in Figure S1. The database search yielded a total of 58 478 study articles. After the removal of duplicates and screening, 72 studies were assessed for eligibility. Twelve studies13,41,43–52 fulfilled the criteria for inclusion and were eligible for the current systematic review. Of the 60 articles that were excluded, two studies53,54 were considered ineligible for review because frequency-domain metrics were not assessed or reported. One study55 was excluded because it described a theoretical framework for studying cardiovascular strain. Thirty-six studies16,22,56–89 were excluded because they did not investigate a 24-h shift and 15 studies90–104 did not have a continuous shift or had an unclear or undefined shift length. One study105 was excluded because it did not compare the effect of shift work after 24 h. In addition, one study106 was excluded because it was not available in the English language, three studies107–109 used sleep as an experimental condition, and one study110 was a letter to the editor. The excluded studies, with reasons for exclusion at full-text screening, are described in Table S3.
Description of studies
The data extraction and summary of the included studies are described in Table 1. Sample size varied from eight to 60 participants. All studies reported variables in the frequency domain in varying degrees. The LF/HF ratio was the most common frequency-domain variable reported, with nine studies13,43,44,47–52 including it in their respective investigations. Two studies41,46 only analyzed the LF band and one study45 only analyzed the HF band. However, four studies47–49,52 reported LF, HF, and the LF/HF ratio, as well as time-domain metrics.
Data extraction and summary of selected studies.
| Author, year | Study design | Sample description | HRV metrics | HRV method | HRV duration | Shift description | Difference in frequency domain between on shift versus off shift | Difference in time domain between on shift versus off shift | Checklist scorea |
|---|---|---|---|---|---|---|---|---|---|
| Aasa et al. (2006) | Cross-sectional | Ambulance personnel (n = 26) | LF | DL 700 Holter Recorder | 1-h recording | 24-h on-duty vs. 48-h off-duty | LF higher work shift (24 on) vs. both work-free days (48 off) 1 (P = .025) and 2 (P = .038); Participants with many health complaints had higher LF (P < .001) and lower HF (P < .001) | 13/16 | |
| Ernst et al. (2014) | Cross-over | Residents and senior physicians (n = 30) | LF, LFnorm | CardioMem CM3000 Holter Monitor | 5-min recording | On-call duty vs. not on-call | LFnorm higher in night of on-call duty (P < .05); No difference in LF between groups | 9/16 | |
| Harbeck et al. (2015) | Prospective cross-over | Physicians (n = 20) | LF/HF | Applanation Tonometer Interface (n.s.) | 10-min recording | 24-h on-call duty vs. 24-h not on-call duty (control) | LF/HF increased, but not significant (P = .177); Cardiac arrhythmia seen in one physician after on-call shift | 11/16 | |
| Langelotz et al. (2008) | Quasi-experimental | Surgeons (n = 8) | LF, HF, LF/HF, SDNN, RMSSD, pNN50 | Polar S810 Heart Rate Monitor | 10-min recording | 24-h shift vs. 12-h off | Increase in LF and HF after 24-h shift (P < .001 and P = .04, respectively). No change in LF/HF ratio (P = .15) | SDNN, RMSSD, and pNN50 increased after 24-h shift (P < .001). Changes between pre- and post-shift SDNN were correlated (r = 0.830, P < .001) | 9/16 |
| Lyytikainen et al. (2017) | Quasi-experimental | Male firefighter rescuers (n = 14) | LF/HF, SDNN | Bodyguard HRV Recorder | 24-h and 2.5-h night recording | 24-h on-duty vs. 72-h off-duty | LF/HF higher during work day vs. 2nd and 3rd rest day (P < .05) | SDNN lower during work day vs. 2nd and 3rd rest days (P < .05 and P < .001, respectively) | 11/16 |
| Mitani et al. (2006) | Quasi-experimental | Male ambulance personnel (n = 9) | LF/HF, HF/(HF+LF) | Marquette Series 800 Holter Analyzer | 5-min recording | 24-h on-duty vs. 24-h off-duty | No difference in LF/HF between awake and asleep while on-duty (P = .56), indicating disturbed circadian variation of cardiac ANS. LF/HF higher when awake while off-duty (P = .03) | 11/16 | |
| Morales et al. (2019) | Comparative cross-sectional with repeated measures | Medical residents (n = 58) | LF, HF, LF/HF, LnRMSSD | RS800 Polar Pulsometer and Polar Electro Oy Encoded Transmitter | 5-min recording | 24-h on-call duty vs. normal work day | LF and LF/HF higher after 24-h on-call vs. control; HF lower after 24-h on-call vs. control | LnRMSSD lower after 24-h on-call vs. control group | 14/16 |
| Neufeld et al. (2017) | Quasi-experimental | Male emergency medical technicians (n = 14) | HF, SDNN | BioHarness-3 | n.s. | 24-h shift vs. non-work days | HF reduced during sleep while on shift (P < .001) | SDNN reduced during sleep while on shift (P < .001) | 10/16 |
| Suzuki et al. (2016) | Cross-sectional | Female ambulance paramedics (n = 8) | LF/HF, HF/(HF+LF) | ActiHR4 Monitoring System | n.s. | 24-h on-duty vs. off-duty days | LF/HF higher while awake on-duty (P <.001) and off-duty compared to sleeping (P < .001); No difference in LF/HF while awake on-duty vs. off duty nor sleeping on-duty vs. off duty | 11/16 | |
| Thurman et al. (2017) | Cross-sectional | Obstetricians (n = 22) | LF, HF, LF/HF, SDNN, RMSSD, pNN50 | Faros 180 eMotion HRV Monitor | 5-min recording | 24-h call vs. 14-h call | No differences in HRV between 24-h on-call shifts and 14-h night shifts | No differences in HRV between 24-h on-call shifts and 14-h night shifts | 13/16 |
| Tobaldini et al. (2013) | Quasi-experimental | Residents (n = 15) | VLF, LF, LFnu, HF, HFnu, LF/HF | Electrocardiogram (n.s.) | n.s. | On-call duty vs. not on-call (control) | No differences in VLF, LF, and HF between baseline and on-call. However, LFnu and LF/HF higher and HFnu lower after on-call duty (P < .01, P < .01, and P < .01, respectively) | 12/16 | |
| Nantsupawat et al. (2022) | Cross-sectional | Residents, interns, and externs (n = 60) | LF, HF, LF/HF, SDNN, SDANN, RMSSD, pNN50 | GE Seer Light Extend Holter Monitor | 24-h recording | Pre-24-h on-call duty vs. post-24-h on-call duty | No differences in LF, HF, and LF/HF after 24-h on-call | No differences in SDNN, SDANN, RMSSD, or pNN50 between pre-on-call and post-on-call duty | 12/16 |
Abbreviations: HF, high-frequency band; HF/(HF+LF), parasympathetic power ratio; HFnu, relative value of HF in proportion to total power; LF, low-frequency band; LF/HF, ratio of low- to high-frequency heart rate variability; LFnorm, normalized low-frequency band; LFnu, relative value of LF in proportion to total power; LnRMSSD, natural log of RMSSD; n.s., not specified; pNN50, percentage of successive R-R intervals that differ by more than 50 milliseconds; RMSSD, root mean square of successive R-R interval difference; SDNN, standard deviation of N-N intervals; VLF, very low-frequency band.
Checklist Score: Adapted Downs and Black checklist.
Emergency responders and health care personnel were the primary study populations included in the current review. More specifically, five studies13,43,45,46,50 investigated emergency responders, including emergency medical technicians,45 ambulance personnel,13,46,50 and firefighters,43 and seven studies41,44,47–49,51,52 observed health care personnel, such as medical residents41,49,51,52 and physicians.41,44,47,48
Risk of bias
Table 2 presents the overall assessment of the risk of bias in the included studies. Of the 11 studies, two studies41,48 were considered low quality, five studies13,43–45,50 were considered moderate quality, and five46,47,49,51,52 were considered high quality. The distribution of principle confounders was included in over 90% of studies; however, only six studies44,47,49–52 included adjustment for confounders in the analyses of their main findings.
Overview of risk-of-bias assessment of studies using an adapted Downs and Black checklist.
| Itemsa | |||||||||||||||||
|---|---|---|---|---|---|---|---|---|---|---|---|---|---|---|---|---|---|
| Author, year | 1 | 2 | 3 | 5 | 6 | 7 | 10 | 11 | 12 | 15 | 16 | 18 | 20 | 21 | 22 | 25 | Total |
| Aasa et al. (2006) | Y | Y | Y | Y | Y | Y | Y | Y | Y | N | Y | Y | Y | N | N | N | 13 |
| Ernst et al. (2014) | Y | Y | N | P | Y | Y | N | N | Y | N | Y | Y | Y | N | N | N | 9 |
| Harbeck et al. (2015) | Y | Y | N | Y | Y | Y | Y | N | N | N | Y | Y | Y | N | N | Y | 11 |
| Langelotz et al. (2008) | Y | Y | Y | N | Y | Y | Y | N | N | N | Y | Y | Y | N | N | N | 9 |
| Lyytikainen et al. (2017) | Y | Y | Y | Y | Y | Y | Y | N | N | N | Y | Y | Y | N | N | N | 11 |
| Mitani et al. (2006) | Y | Y | Y | Y | Y | Y | Y | N | N | N | Y | Y | Y | N | N | N | 11 |
| Morales et al. (2019) | Y | Y | Y | Y | Y | Y | Y | N | N | N | Y | Y | Y | Y | Y | Y | 14 |
| Neufeld et al. (2017) | Y | Y | N | Y | Y | Y | Y | N | N | N | Y | Y | Y | N | N | N | 10 |
| Suzuki et al. (2016) | N | Y | Y | Y | Y | Y | Y | N | N | N | Y | Y | Y | N | N | Y | 11 |
| Thurman et al. (2017) | Y | Y | Y | Y | Y | Y | Y | Y | Y | N | Y | U | Y | N | N | Y | 13 |
| Tobaldini et al. (2013) | Y | Y | Y | Y | Y | Y | Y | N | N | N | Y | Y | Y | N | N | Y | 12 |
| Nantsupawat et al. (2022) | Y | Y | Y | P | Y | Y | Y | Y | N | N | Y | Y | Y | N | N | Y | 12 |
Abbreviations: N, no; P, partially; U, unable to determine; Y, yes.
(1) Is the hypothesis/aim/objective of the study clearly described? (2) Are the main outcomes to be measured clearly described in the Introduction or Methods section? (3) Are the characteristics of the subjects included in the study clearly described? (5) Are the distributions of principle confounders in each group of subjects to be compared clearly described? (6) Are the main findings of the study clearly described? (7) Does the study provide estimates of the random variability in the data for the main outcomes? (10) Have actual probability values been reported (e.g., 0.035 rather than <0.05) for the main outcomes except where the probability value is less than 0.001? (11) Were the subjects asked to participate in the study representative of the entire population from which they were recruited? (12) Were those subjects who were prepared to participate representative of the entire population from which they were recruited? (15) Was an attempt made to blind those measuring the main outcomes? (16) If any of the results were based on ‘data dredging’, was this made clear? (18) Were the statistical tests used to assess the main outcomes appropriate? (20) Were the main outcome measures used accurate (valid and reliable)? (21) Were the subjects (i.e., controls and shift workers) recruited from the same population? (22) Were study subjects (i.e., controls and shift workers) recruited over the same period of time? (25) Was there an adequate adjustment for confounding in the analyses from which the main findings were drawn?
Publication bias and sensitivity analysis
The indication of any publication bias is found in Figure 1. Based on the distribution of studies in the funnel plot, and their relative effect sizes, publication bias did not appear to play a role in the results of the meta-analysis. Moreover, the results from Orwin’s fail-safe N test indicated that a range of 59–64 additional studies would be needed to nullify the overall summary effect.
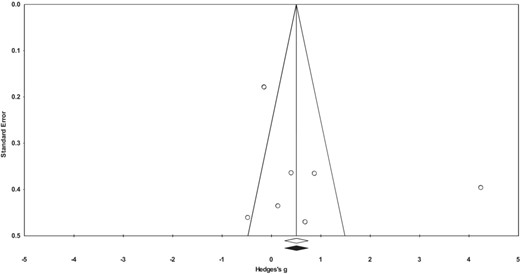
Funnel-plot analysis for publication bias.
The results of the one-study-removed analysis found that the overall effect for the majority of included studies remained moderately strong to strong (range = 0.811–1.030; 95% CI = −0.502, 2.273) (Figure S2). The associated P-values ranged from .105 to .226. However, the removal of one study49 decreased the point estimate to 0.222 (95% CI = −0.185, 0.629). The associated P-value with study removal was 0.285.
Statistical significance and meta-analysis
Means, standard deviations, effect sizes, and associated confidence intervals for outcomes of interest are reported in Table S2. Of the nine included studies that observed the LF/HF ratio, three studies43,49,51 demonstrated significant increases in the LF/HF ratio after 24-h shift work. One study44 reported a non-significant increase in the LF/HF ratio after 24-h shift work but noted cardiac arrhythmia was seen in one participant after shift. In addition, four studies41,46,48,49 demonstrated significant increases in LF after 24-h shift work. However, the results of HF were mixed. Of the five studies that reported HF, one study48 demonstrated a significant increase after shift work, two studies45,49 noted a significant decrease, and three studies47,51,52 did not observe any difference.
Of the 29 effect sizes that were calculated, two49 were interpreted as nearly perfect or perfect and two44,50 were viewed as large, with 95% confidence intervals not crossing over zero. In addition, nine13,49–51 were described as moderate, ten13,41,43,48,49,51 were viewed as small, and six13,41,50,52 were interpreted as trivial, with 95% confidence intervals encompassing zero.
Pooled effect size calculations were then aggregated for the meta-analysis. Across all groups, the overall effect of 24-h shift work on autonomic function was 0.821, indicating that individuals experienced a moderate increase in the LF/HF band after 24-h shift work (Figure 2). An assessment of groups by profession indicated varied shifts away from parasympathetic dominance after 24-h shift work. More specifically, individuals in health care demonstrated a moderate to large increase in the LF/HF band after 24-h shift work (1.125; 95% CI = −0.810, 3.060) and those in emergency response noted a small effect (0.401; 95% CI = −0.071, 0.873), as described in Figures S3 and S4. However, it is important to note that both confidence intervals crossed zero, thereby indicating a lack of statistical effect.
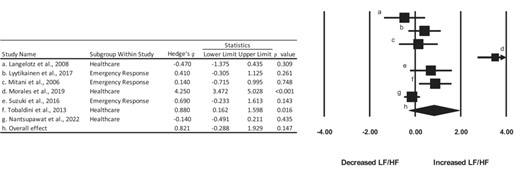
Summary of Hedge’s g effect sizes and 95% confidence intervals for the included studies. dConfidence interval exceeded 4.0.
Pooled effect size calculations for the LF and HF bands were also aggregated for four studies.48,49,51,52 The overall effect for the LF and the HF band was 0.283 and −0.198, indicating a small increase in the LF band and a small decrease in the HF band, respectively (Figures 3 and 4). The confidence intervals for both the LF and HF bands crossed zero, thereby indicating a lack of statistical effect.
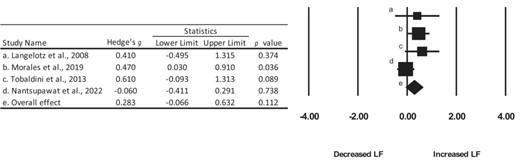
Summary of Hedge’s g effect sizes and 95% confidence intervals for the included studies.
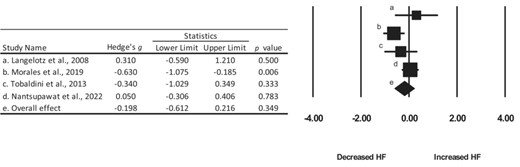
Summary of Hedge’s g effect sizes and 95% confidence intervals for the included studies.
Level of evidence
The results of the systematic review indicated a low rating when observing the certainty of the evidence. The rating was given because of the risk of bias observed (e.g., selection bias and lack of blinding), imprecision in 95% confidence intervals, as well as inconsistency in reported findings.
DISCUSSION
The purpose of the current review was to quantify the effect of 24-h shift work on autonomic nervous system function measured as HRV in occupational settings. The results demonstrate a transition away from a parasympathetic dominant state after 24-h shift work, as evidenced by a decrease in HF activity.
A trend away from parasympathetic nervous system dominance secondary to shift work has been previously shown.16,56,70 A growing body of evidence has indicated a relationship among autonomic balance, HRV, and disease risk factors (for a review, see Thayer et al., 200924). More specifically, chronic sympathetic dominance as a reported condition has been associated with several diseases, including cardiovascular disease,111,112 hypertension,113 chronic pain,114,115 and chronic fatigue syndrome.116,117 An increase in risk of myocardial infarction, coronary events, and ischemic stroke has been noted in shift workers,118 although it is unclear if this trend is a causal factor of shift work or if other factors, such as poor health habits,11 may contribute to this effect. Moreover, workers on extended work shifts (e.g., 24-h shift work) experience higher incidences of burnout and injury hazard rates.9,10,12 Adequate physiological recovery after long work shifts, therefore, becomes paramount in order to counterbalance the increased strain on both the cardiovascular and nervous systems. Decreased HRV metrics in the time domain and a decrease in HF activity, indicative of reduced parasympathetic dominance, after night shift work and 24-h shift work have been shown.16,43,45,46,49,56,70,90,119 As such, acute decreases in parasympathetic activity, with an absence of adequate recovery, may compromise the system’s capacity to mobilize and restore its resources in response to environmental and social demands.
Evidence of lifetime shift work exposure and diminished components of cardiac regulation have been suggested.120 While a plausible link between chronic autonomic imbalance and cardiovascular disease has been hypothesized,24 evidence indicates that acute recovery of the autonomic nervous system after shift work may be possible.43 In fact, Lyytikäinen and colleagues43 found that at least 2 days are required to restore changes in autonomic activity after 24-h shift work. However, it is unclear if acute recovery of the autonomic nervous system after shift work is a sufficient deterrence to reported long-term negative health outcomes. Disparities across occupational settings may make direct comparisons of HRV metrics difficult to compare.
The variation observed in the current review is likely due to inconsistencies in study methodology and differences in participant recruitment. Inconsistent findings in studies investigating shift work have been previously reported.27 The Task Force of the European Society of Cardiology and the North American Society of Pacing and Electrophysiology are a set of guidelines detailing standards of measurement for investigations conducted using HRV to provide clinical findings using practical recommendations across studies.121 Of the 11 studies included in the review, only four44,45,48,49 reported using procedures according to the task force as part of their standard of measurement. Implementing a standardized method of investigating shift work would prove beneficial as this may improve study replication within and across occupational settings.
One review27 noted that differences in findings may result from studying different schedules and occupations. For example, of the five articles that observed first responders, three43,45,46 (60%) observed decreases in metrics representative of parasympathetic nervous system activity after 24-h shift work. In contrast, only one study49 assessing health care providers noted a distinct decrease in HRV methods linked to parasympathetic activity. Occupational stress has been associated with lowered HRV, indicating reduced parasympathetic activation.122 As such, HRV can be an informative method of measuring workplace stressors, particularly during shift work.122 However, comparisons in 24-h shift work across occupations prove difficult as levels of stress exposure may vary. Moreover, caution should be taken comparing different recording lengths as their physiological meanings may differ.28 In other words, while the response to internal or external stressors produces the same physiological cascade, the frequency or duration of stressors may be variable across occupations. For example, a sample of obstetricians observed no differences in HRV metrics over a 24-h call after seeing an average of 10 patients.47 However, a significant reduction in HF was noted in emergency medical technicians, who yielded an average of 4.4 sleep disruptions due to alarms over an 8-h period (11 p.m.–7 a.m.).45 Whether disruptions in sleep may have more notable impacts on HRV response between occupational settings remains to be determined. Previous literature has found that sleep deprivation reduces time to exhaustion despite no changes in neuroendocrine response during exercise.123 As such, the cognitive and emotional response to a challenge may become compromised even while physiological responses might remain intact.124 This is supported by another study125 that found sleep loss increases the negative emotional effects of disruptive or unforeseen events.
Sleep is undoubtedly a confounding variable when investigating the effect of shift work across occupational settings. Objective methods of monitoring sleep such as through polysomnography, while common practice, may not be conducive to occupations that are active throughout a 24-h shift. Other objective methods like actigraphy have shown to be a reliable method for tracking sleep126 and some subjective measures, such as a sleep diary/log127 or via sleep scales128,129 (e.g., Pittsburgh Sleep Quality Index, the RU-SATED sleep health scale, the Karolinska Sleepiness Scale, and Epworth Sleepiness Scale) may be useful for capturing different dimensions of sleep. Only five13,44–47 (45.4%) of the included studies explicitly reported using sleep logs in their respective analyses. None of the included studies reported using sleep scales in their respective analyses.
The exclusion of sleep as a confounding variable is a critical flaw as sleep length and sleep quality may be compromised in shift-work-related occupations.130 In fact, changes in autonomic activity and circadian variation in autonomic regulation due to shift work have been documented.16,56,70 Previous literature has observed a plausible link between chronic sleep deprivation and autonomic imbalance,131 with acute sleep loss demonstrating increases in sympathetic modulation and a reduction in vagal control.132,133 Moreover, chronic stress facilitates an imbalance in autonomic activity, highlighted by a decrease in parasympathetic activity and high norepinephrine levels.131 A reduction in sleep duration over a 24-h shift, therefore, may contribute to changes in autonomic nervous system activity.
In addition to possible restrictions in sleep duration, differences in job tasks within occupations may also alter autonomic activity. For example, the LF band was notably higher after 24-h on-call duty in medical residents (Pre-on-call, 34.28 ± 13.14 m2 vs. Post-on-call, 40.73 ± 14.25 m2)49; however, no differences in LF were found in a sample of residents and senior physicians after 24-h on-call (On-call, 2.3 × 10⁻⁶ m2 (0.8 x 10⁻⁶–77.9 × 10⁻⁶) vs. Not on-call, 2.9 × 10⁻⁶ (0.5 × 10⁻⁶–84.0 × 10⁻⁶) m2).41 In addition, it remains unclear whether the acute effects of shift work are dose dependent. For instance, Thurman and colleagues47 found no differences in HRV metrics between 24-h and 14-h shift work in obstetricians. In contrast, an analysis of emergency physicians110 found significant increases in reported mental and physical fatigue and a decrease in RMSSD after 24-h shift work, yet no differences in the LF/HF ratio when compared to a 14-h shift. As such, comparisons within specific occupations (e.g., health care) and between occupations may prove difficult when assessing the effects of extended shift work on autonomic activity. Moreover, inconsistency in reporting of shift start and end times across studies creates a potential limitation when comparing within and between occupational settings. Differences in roles and responsibilities across occupations, as well as differences in job demand, may explain the wide disparity across studies included in the current review. Future research should continue to investigate whether differences in autonomic activity are dependent on the number of h worked and how job task responsibilities may influence autonomic activity. In addition, studies incorporating larger sample sizes and/or longitudinal studies (e.g., cohort) are warranted to elucidate the long-term effects of extended shift work on autonomic function.
There were some limitations to the current review. Assessment of autonomic function in the frequency domain limited the number of included studies. A broader search including both time-domain only and time- and frequency-domain analyses may capture a wider range of investigations. Whether a more consistent trend in autonomic function after 24-h shift work would be observed remains to be determined. In addition, as a result of the current literature to date and the inclusion/exclusion criteria, only emergency responders and health care workers were retained for analysis in the current review. As such, the observations found may not be generalizable to other populations that experience different types of extended shift work, such as military settings. Lastly, as reported by Shea et al. (2017),134 pre-registration of search criteria can help minimize potential for selection bias. The current review was not pre-registered a-priori. However, this study lists in detail the methods and search criteria to help minimize such bias.
CONCLUSION
The current systematic review indicates a shift away from parasympathetic dominance in occupational settings that include 24-h shift work. Moreover, the systematic review revealed wide ranges of HRV assessment, which led to inconsistencies in findings across the studies included. Differences in HRV assessment, such as duration of recordings and hardware used for measurement, as well as exclusion of sleep as a possible confounder may explain differences between and within occupations. More unified methods of assessment and analysis may prove beneficial, particularly when comparing across shift work populations.
FUNDING INFORMATION
The authors received no financial support for the research, authorship, and/or publication of this article.
CONFLICT OF INTEREST STATEMENT
The authors report that there are no competing interests to declare.
DATA AVAILABILITY STATEMENT
The data from the analyses found in this study are available from the corresponding author upon reasonable request.
DISCLOSURE
Informed consent: N/A. Registry and Registration Number of Study/Trial: N/A. Animal Studies: N/A.
