


Abstract
In this study, we conducted a cluster randomized controlled trial to verify the effectiveness of a treatment work balance support (TWBS) program promoted by occupational health nurses (OHNs) in small and medium-sized enterprises (SMEs) using a web meeting system.
We analyzed data from 64 managers (32 each in the control and intervention groups) and 541 workers (246 and 295 in the control and intervention groups, respectively) from 22 SMEs (11 in each group) with less than 200 workers. The TWBS program comprised online consultations for managers and seminars for workers by an OHN. TWBS leaflets were distributed among both groups. The “Recognition and Attitude Scale toward TWBS” was administered and workplace climate, psychological safety (PS), and work engagement (WE) scores were measured at baseline and endpoint. The increase in scores of each group was analyzed using a linear mixed-effects model.
Increases in managers’ scores on all three recognition and attitude subscales were significantly greater in the intervention than in the control group (P = .048, .003, and .032, respectively). Workers’ score increases were significantly higher on two subscales—recognition of workplace initiatives and understanding of professionals’ roles—in the intervention than in the control group (P = .043 and .001, respectively). There was no difference between the two groups in the amount of increase in PS and WE, as perceived by managers and workers.
The TWBS program promoted by OHN increased recognition and attitude among SME managers and workers, indicating the usability of promoting TWBS in SMEs.
INTRODUCTION
Small and medium-sized enterprises (SMEs) with less than 300 workers in Japan account for 99.7% of all companies and the number of workers in these companies constitute approximately 80% of the total workforce.1 Japan’s declining birthrate and aging population are accelerating, and with the working-age population continuing to decline, the shortage of workers in SMEs is becoming graver.2 Owing to advances in medical technology, one in three workers continues to work while undergoing treatment for an illness, and more than 90% of them wish to continue working.3 However, the 34% turnover rate after a cancer diagnosis has become a social problem,4,5 and securing the workforce, especially in SMEs, has become an urgent issue.
To balance the treatment of illness and work, the Ministry of Health, Labour and Welfare (MHLW) formulated the “Treatment Work Balance Support (TWBS) guidelines” in 2016.6,7 Since 2017, the Japan Organization of Occupational Health and Safety has provided one-day basic training course on TWBS guidelines for physicians, nurses, labor and social security attorneys, and human resource staff (HR staff) who have no knowledge of TWBS to promote multi-agency and inter-professional collaboration.8 The course provides TWBS coordinator qualifications without examination.
Large companies employ full-time occupational physicians (OPs) and sometimes occupational health nurses (OHNs), providing health support, such as early detection and treatment; support for leave and return to work; and consideration for work conditions as part of disease management.9
However, SMEs do not employ full-time occupational health professionals, and only about 10% of workers are aware of the TWBS guidelines.10–12 This lack of awareness among managers and workers in SMEs makes it difficult to achieve company initiatives13 and reduce worker’s reluctance to seek help, leading further to unwanted turnover due to illness; thus, urgent measures are needed.
Research on the role of OHNs in TWBS has focused on support for balancing cancer treatment and work.14–17 In large companies, it has been reported that OHNs provide support before and after diagnosis—in cooperation with OPs—at the time of leave and return to work, as well as along the course of treatment, not only to workers with illnesses but also to their managers, coworkers, and HR staff. In SMEs that do not have full-time OPs, OHNs play a central role in providing support to promote health in the workplace.18–20
The authors believe that it is necessary to conduct empirical research on the effectiveness of the TWBS program promoted by OHNs in SMEs, as no previous research has been conducted on this topic. The authors developed the “Recognition and Attitude Scale toward TWBS in SMEs” (“Recognition and Attitude Scale”) as an evaluation index in a preliminary study.21 It is expected that this scale will make it possible to assess the current status of TWBS and the effectiveness of interventions at each company.
During the protracted COVID-19 era, web meeting systems became increasingly popular.22 To promote TWBS in SMEs, the use of information and communication technology (ICT), including web meeting systems, should be considered. However, no studies have verified the effectiveness of TWBS programs using a web meeting system.
Therefore, this study aimed to verify the intervention effect of the TWBS program promoted by OHNs in SMEs using a web meeting system, which will provide suggestions for the effective diffusion and promotion of TWBS in SMEs.
METHODS
Participants
The study design was based on the CONSORT statement.23,24 The selection criteria of the participants included executives, HR staff (managers), and workers of SMEs in Japan—with a workforce ranging between 20 and 200—from construction and manufacturing industries in which no OHNs were employed; these SMEs were certified as health and productivity management organizations by the Ministry of Economy, Trade and Industry or equivalent.
In recruiting eligible company, we identified eligibility companies by obtaining information from a list of companies recognized as health and productivity management organizations and from each company’s website. We sent a request for research cooperation via an inquiry form on each company’s website. Appointments were made by telephone with companies that expressed interest in participation. A web meeting system by Zoom meetings were held to explain the contents of the written request for research cooperation to managers. We also explained the exclusion criteria and confirmed that no OHNs were employed; if they were still willing to participate, they completed a research consent form.
To estimate the sample size25 in the cluster randomized controlled trials design, we assumed a medium effect size of 0.50,26 as suggested by Cohen, as there were no previous studies to estimate the effect size. We assumed that the within-class correlation coefficient = 0.10, referring to the fact that the coefficient is at most 0.10 for educational surveys in schools.27 Therefore, a sample size of at least 320 workers was needed, assuming a group size of 20 companies, α = 0.05, and power = 0.80. In planning this survey, we assumed that the response rate would be about 10% or less because of COVID-19.
Randomization
The cluster randomized controlled trial was conducted. Although blinding is common in cluster randomization, it was not feasible in this study because of the nursing intervention.28 Companies that agreed to participate were stratified by industry (construction or manufacturing) and size of workers (20–49, 50–200) and assigned to the intervention or control group using the envelope method (Figure 1).
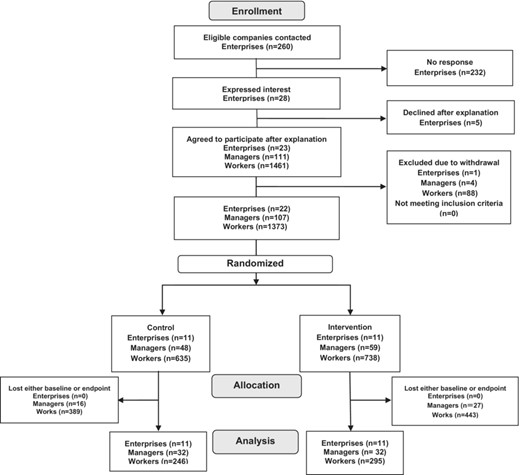
Flow of participants through each stage of a cluster randomized controlled trial.
Intervention
Interventions were conducted by one OHN with 13 years of experience in TWBS at large companies and SMEs, and with OHN specialist certification and TWBS coordinator qualification. A web meeting system by Zoom was used for online consultations and seminars.
Table 1 shows all participants received an information leaflet on TWBS resources. The online consultations with managers in the intervention group were conducted once a month for 60 min (4 times over a 5-month period). During the first consultation, we gathered information, assessed on company health issues. For the second, we compared data of the company with data of whole companies based on the results of the baseline survey and shared the company’s strengths and weaknesses. We responded to questions from managers and provided information on other companies’ initiatives. In the third, we made suggestions regarding internal systems and initiatives related to TWBS that met the company’s needs and consulted with managers regarding workers who need TWBS including how to cooperate with hospital physician. In the fourth, we explained how occupational health center (OH center) consultations work (There is one OH center in each prefecture and OHNs of the center provide free assistance in TWBS to SMEs). By sharing the website of the OH center, we explained how to ask for consultation by OHNs in OH center, so that the company’s TWBS could be continued. We also introduced social resources (the website of MHLW about “Support Navi for TWBS”) and described how to use each tool in the website.
Treatment work balance support program.
 |
|---|
|
|---|
Treatment work balance support program.
|
|---|
|
|---|
Between the second and third consultations, managers and workers attended a 40-min seminar. An original cartoon was developed by the authors and used in the seminar to illustrate the story of a worker with illnesses who, with the encouragement of the employer, was able to receive early medical attention and treatment, and with the cooperation of his workplace colleagues, was able to return to work and continue to work. The significance of TWBS and the contents of the guidelines were conveyed to employees through lectures that included cartoons.
Questionnaire survey
Questionnaires (web-based and paper) were self-administered at baseline and endpoint between December 2021 and May 2022. Web-based surveys were created using Google Forms, and its URL was emailed to managers; the results were collected directly by the researchers. Paper-based questionnaires were sent to managers to distribute among workers. Managers placed collection boxes at each company and returned them to the researchers.
Measures
The survey sought to determine the industry type, employee size, and participant information in terms of gender, age, years of service, job title, and employment type. Participants were asked to provide the last four digits of their date of birth in the questionnaire to link them at baseline and at endpoint. If data linkage was difficult only using the 4-digits, matches were found within each company according to gender, age, position, employment type, and years of service.
Primary outcome
The amount of increase of the “Recognition and Attitude Scale”21 developed by the authors was used as primary outcome, which was defined as endpoint score minus baseline score. The “Recognition and Attitude Scale” was originally designed to measure workers’ recognition and attitude. In this study, we prepared two different questionnaires, one for workers and one for managers with slightly modified wording.
The first subscale of the recognition and attitude comprised nine items, such as the company informs workers about the company’s policy on TWBS and workplace initiatives (recognition of workplace initiatives). Workers were originally asked “Is the company committed to some initiatives on TWBS,” while managers were asked “Are you taking the lead to implement some initiatives on TWBS.”
The second subscale measured understanding of professionals’ roles in TWBS (understanding of professionals’ roles), and comprised five items, such as understanding the roles of OHNs, OPs, HR staff, and the support they provide.
The third subscale, attitude and self-efficacy toward TWBS (attitude and self-efficacy), comprised six items, such as being able to act voluntarily with regard to TWBS.
The items were a six-point scale ranging from “strongly agree” (5) to “strongly disagree” (0). Because subscales 2 and 3 are related to an individual’s recognition and attitude, the same wording items were posed to the workers and managers. The total score of 20 items (range: 0–100) was termed the recognition and attitude score.
Awareness of TWBS guidelines, measured by a four-point scale ranging from “do not know” (1) to “have a good grasp of the contents” (4) was used as an additional primary outcome.
Secondary outcome
A safe and active workplace climate (workplace climate) as secondary outcome included psychological safety (PS)29,30 and work engagement (WE),31,32 which were set as external criteria for the Recognition and Attitude Scale in the scale development study.21 Recognition and Attitude were significantly correlated with PS and WE, respectively, suggesting that the OHN intervention may increase PS and WE. The amount of increase, the secondary outcome, was defined as endpoint score minus baseline score.
The previous qualitative study33 by the authors showed that SMEs with good practices of TWBS had a sense of mutual respect and support, as well as a sense of safety and support from the workplace, which seems similar to the concept of PS,34,35 which is defined as “the belief that one will not be punished or humiliated for speaking up one’s ideas et al.,”29,30 and has received increased attention in recent years. PS was measured by seven items including “I am usually not blamed when I make mistakes in the team,” using a six-point scale ranging from “strongly disagree” (0) to “strongly agree” (5).
WE31,32 defined as “a positive, fulfilling, work-related state of mind,” is used as an indicator of job satisfaction. It has been reported that managers’ support was an important factor with respect to TWBS as well as associated with improved WE,36 suggesting that there is a link between TWBS and WE. Nine items using a seven-point scale ranging from “never” (0) to “always” (6) are included.
In addition, respondents were asked about one item, “There is an atmosphere of mutual support when people become ill (an atmosphere of mutual support),” using a 4-point scale ranging from “not at all” (1) to “yes” (4).
As for changes in feelings toward TWBS, managers and workers were asked only at endpoint about four items (relating to counseling of workers with illnesses, mutual public assistance, how TWBS prevented turnover, and intention to use OH centers) on a six-point scale ranging from “strongly disagree” (0) to “strongly agree” (5).
Statistical analysis
Basic statistics
Basic statistics were performed for all items. For basic attributes, Fisher’s exact test, Pearson’s chi-square test, and t-test were performed to compare the control and intervention groups at baseline. For total TWBS scores, t-test was conducted to compare the control and intervention groups at baseline and endpoint. Paired t-test was also performed to compare baseline and endpoint within each group.
Linear mixed-effects model
The intervention effect on managers was assessed based on the extent of increase in recognition and attitude toward TWBS, awareness of TWBS guidelines, and workplace climate as an outcome variable, with or without intervention and employee size as fixed effects, companies as random effects, and the baseline score as covariates. Changes in feelings toward TWBS were analyzed using a linear mixed-effects model, excluding the aforementioned covariates.
In addition to the abovementioned procedures, the analysis of workers used the seminar as fixed effects, since the intervention for workers was provided only by a seminar. Statistical significance was set at two-sided P < .05. All statistical processing was performed using IBM SPSS Statistics Ver. 26 for Windows.
Ethical considerations
Each company’s manager was explained to about the study purpose, duration, participants, intervention, survey items using questionnaires, and anonymization of institutional and personal information. The participation in the study was voluntary. If some companies agreed to cooperate in the research, we asked them to return a research consent form and obtained their consent.
The managers and workers were asked to cooperate in the survey out of their own free will by explaining the purpose of the research, the time required to answer, the fact that the questionnaire was anonymous on the cover page. Consent was deemed to have been obtained upon return of the questionnaire. After the endpoint survey, similar support as the intervention group was provided to the control group. This study was conducted with the approval of the Institutional Review Board for Clinical Research of Tokai University (21R-127) and the registration at UMIN (UMIN ID: 000050135).
RESULTS
Among 260 companies invited to participate in the study, 28 companies (10.8%) expressed interest. Of those, 23 companies agreed to participate but one company dropped out; ultimately, 22 companies (95.7%) were selected for analysis. Finally as shown in Figure 1, the study included 64 managers (32 each in the control and intervention groups) and 541 workers (246 and 295 in the control and intervention groups, respectively). The valid response rate was 59.8% for managers and 39.4% for workers.
The participation rate in TWBS seminars was 100% for managers and 73.9% for workers. The average number of TWBS seminars held per company was 2.5 ± 1.1 (range: 1–5), and the average seminar duration was 49.5 min. Overall, 63.6% of the seminars were held online, and 36.4% were held in person.
Participants’ attributes
Participants’ attributes including industry type, employee size, gender, age, years of service, job title, and employment type, as shown in Table 2, did not significantly differ between the control and intervention groups. Additionally, no difference was found between web and paper-based questionnaire response rates.
Attributes of participating companies and workers.
| Control | Intervention | P-value | |||
|---|---|---|---|---|---|
| n | (%) | n | (%) | ||
| Companies | 11 | (100.0) | 11 | (100.0) | |
| Industry typea | |||||
| Construction industry | 3 | (27.3) | 2 | (18.2) | 1.000 |
| Manufacturing | 8 | (72.7) | 9 | (81.8) | |
| Employee sizeb | |||||
| 20–49 | 5 | (45.5) | 6 | (54.5) | 1.000 |
| 50–199 | 6 | (54.5) | 5 | (45.5) | |
| Managers (executives, personnel, and HR staff) | 32 | (100.0) | 32 | (100.0) | |
| Genderb | |||||
| Male | 23 | (71.9) | 23 | (71.9) | 1.000 |
| Female | 9 | (28.1) | 9 | (28.1) | |
| Agea | |||||
| 20s | 0 | (0.0) | 1 | (3.1) | .766 |
| 30s | 2 | (6.3) | 3 | (9.4) | |
| 40s | 7 | (21.9) | 9 | (28.1) | |
| 50s | 16 | (50.0) | 13 | (40.6) | |
| Over 60 | 7 | (21.9) | 6 | (18.8) | |
| Years of servicec | |||||
| 〔Mean ± SD〕 | 〔25.5 ± 12.9〕 | 〔20.4 ± 10.7〕 | .096 | ||
| Job titleb | |||||
| Executives | 24 | (75.0) | 20 | (62.5) | .177 |
| Personnel and labor officers | 8 | (25.0) | 12 | (37.5) | |
| Workers | 246 | (100.0) | 295 | (100.0) | |
| Genderb | |||||
| Male | 194 | (78.9) | 235 | (79.7) | .819 |
| Female | 52 | (21.1) | 60 | (20.3) | |
| Ageb | |||||
| 20s | 49 | (20.0) | 87 | (29.4) | .095 |
| 30s | 47 | (19.1) | 58 | (19.7) | |
| 40s | 79 | (32.1) | 79 | (26.8) | |
| 50s | 50 | (20.3) | 46 | (15.6) | |
| Over 60 | 21 | (8.5) | 25 | (8.5) | |
| Years of servicec | |||||
| 〔Mean ± SD〕 | 〔11.8 ± 10.5〕 | 〔10.2 ± 9.0〕 | .263 | ||
| Job titleb | |||||
| Managers | 78 | (31.7) | 92 | (31.2) | .897 |
| General employee | 168 | (68.3) | 203 | (68.8) | |
| Employment typeb | |||||
| Regular employee | 237 | (96.3) | 278 | (94.2) | .255 |
| Contract employee | 9 | (3.7) | 17 | (5.8) | |
Fisher’s exact test.
Pearson’s chi-square test.
t-test.
Intervention effects on the primary outcome
Table 3 shows that among managers, increases in all subscale scores of the managers’ “Recognition and Attitude Scale” were significantly larger in the intervention than in the control group for recognition of workplace initiatives (estimate: 2.8; 95% confidence interval (CI): 0.0–5.6, P = .048), understanding of professional roles (estimate: 2.2; 95% CI: 0.8–3.6, P = .003), and attitude and self-efficacy (estimate: 1.5; 95% CI: 0.1–2.9, P = .032). The groups did not differ in the extent of increase in awareness of TWBS guidelines.
Increase in managers’ recognition and attitudes toward treatment-work balance support scale scores.
| Allocation | Increased scores (E-B) | Mixed model | |||||
|---|---|---|---|---|---|---|---|
| Control (n = 32) | Intervention (n = 32) | Control (n = 32) | Intervention (n = 32) | Estimated values | 95% CI | P-values | |
| Mean ± SD | Mean ± SD | Mean ± SD | Mean ± SD | ||||
| Recognition and Attitude toward TWBS (20 items, 0–100) | |||||||
| B (Baseline) | 69.0 ± 14.0 | 71.0 ± 11.1 | 4.2 ± 12.3 | 9.2 ± 11.3 | 6.5 | 1.9 – 11.1 | .007** |
| E (Endpoint) | 73.2 ± 11.2 | 80.2 ± 9.7a,b | |||||
| Recognition of workplace initiatives for TWBS (9 items, 0–45) | |||||||
| B | 29.5 ± 8.9 | 30.6 ± 7.5 | 2.1 ± 8.8 | 4.0 ± 7.0 | 2.8 | 0.0 – 5.6 | .048* |
| E | 31.7 ± 6.4 | 34.7 ± 5.7a | |||||
| Understanding of professionals’ roles in TWBS (5 items, 0–25) | |||||||
| B | 15.5 ± 4.1 | 15.4 ± 4.0 | 1.5 ± 3.0 | 3.7 ± 3.5 | 2.2 | 0.8 – 3.6 | .003** |
| E | 17.0 ± 3.9a | 19.0 ± 3.4a,b | |||||
| Attitude and self-efficacy regarding TWBS (6 items, 0–30) | |||||||
| B | 23.9 ± 4.2 | 25.0 ± 3.6 | 0.6 ± 2.8 | 1.5 ± 3.8 | 1.5 | 0.1 – 2.9 | .032* |
| E | 24.5 ± 3.7 | 26.5 ± 3.0a,b | |||||
| Awareness of TWBS guidelines (1 item, 1–4) | |||||||
| B | 1.9 ± 0.9 | 2.2 ± 0.8 | 0.5 ± 0.7 | 0.6 ± 0.8 | 0.3 | −0.1 – 0.6 | .129 |
| E | 2.4 ± 0.8a | 2.8 ± 0.7a,b | |||||
| A safe and active workplace climate | |||||||
| Psychological safety (7 items, 0–35) | |||||||
| B | 22.8 ± 5.8 | 23.6 ± 3.9 | −1.1 ± 5.7 | −0.1 ± 4.9 | 1.6 | −1.1 – 4.3 | .235 |
| E | 21.6 ± 5.4 | 23.5 ± 4.7 | |||||
| Work engagement (9 items, 0–54) | |||||||
| B | 36.4 ± 10.8 | 33.4 ± 13.8 | −0.1 ± 6.6 | 1.3 ± 6.9 | 0.8 | −2.3 – 3.8 | .605 |
| E | 36.3 ± 10.0 | 34.7 ± 12.1 | |||||
| There is an atmosphere of mutual support when people become ill (1 item, 1–4) | |||||||
| B | 3.3 ± 0.7 | 3.4 ± 0.7 | 0.0 ± 0.6 | 0.1 ± 0.8 | 0.2 | −0.1 – 0.5 | .212 |
| E | 3.3 ± 0.6 | 3.5 ± 0.6 | |||||
Mixed model: The model was populated with the amount of increase in each item as an outcome variable, with or without intervention, employee size as fixed effects, companies as a random effect, and baseline scores for each item as a covariate.
Intervention effects were shown in the table. **P < .01, *P < .05.
Employee size: Not significant.
Significantly different from “Baseline” by paired t-test (P < .05).
Significantly different from “Control” by t-test (P < .05).
Table 4 shows that among workers, increases in the scores of two of the subscales of the “Recognition and Attitude Scale” were significantly larger in the intervention than in the control group for recognition of workplace initiatives (estimate: 1.9; 95% CI: 0.1–3.7, P = .043) and understanding of professional roles (estimate: 2.1; 95% CI: 1.0–3.1, P < .001). However, the increase in attitude and self-efficacy scores was not significantly different, while for awareness of TWBS guidelines (estimate: 0.3; 95% CI: 0.1–0.5, P = .010), it was significantly greater in the intervention than in the control group.
Increase in workers’ recognition and attitude toward treatment-work balance support scale scores.
| Allocation | Increased scores (E-B) | Mixed model | |||||
|---|---|---|---|---|---|---|---|
| Control (n = 246) | Intervention (n = 295) | Control (n = 246) | Intervention (n = 295) | Estimated values | 95% CI | P-values | |
| Mean ± SD | Mean ± SD | Mean ± SD | Mean ± SD | ||||
| Recognition of and attitude toward TWBS (20 items, 0–100) | |||||||
| B (Baseline) | 51.8 ± 15.7 | 51.9 ± 15.0 | 5.4 ± 11.0 | 10.6 ± 12.9 | 4.5 | 1.7–7.4 | .005** |
| E (Endpoint) | 57.2 ± 15.6a | 62.5 ± 14.4a,b | |||||
| Recognition of workplace initiatives for TWBS (9 items, 0–45) | |||||||
| B | 22.8 ± 9.2 | 23.6 ± 8.9 | 2.6 ± 6.7 | 4.3 ± 7.8 | 1.9 | 0.1–3.7 | .043* |
| E | 25.3 ± 8.9a | 28.0 ± 8.2a,b | |||||
| Understanding of professionals’ roles TWBS (5 items, 0–25) | |||||||
| B | 7.8 ± 5.5 | 7.4 ± 5.1 | 2.3 ± 4.5 | 5.0 ± 5.4 | 2.1 | 1.0–3.1 | .001*** |
| E | 10.1 ± 5.4a | 12.4 ± 4.8a,b | |||||
| Attitude and self-efficacy regarding TWBS (6 items, 0–30) | |||||||
| B | 21.3 ± 4.5 | 20.9 ± 4.8 | 0.5 ± 4.3 | 1.2 ± 4.4 | 0.5 | −0.4–1.4 | .233 |
| E | 21.8 ± 4.1 | 22.1 ± 4.1a | |||||
| Awareness of TWBS guidelines (1 item, 1–4) | |||||||
| B | 1.2 ± 0.5 | 1.3 ± 0.5 | 0.3 ± 0.7 | 0.6 ± 0.8 | 0.3 | 0.1–0.5 | .010* |
| E | 1.5 ± 0.7a | 1.9 ± 0.8a,b | |||||
| A safe and active workplace climate | |||||||
| Psychological safety (7 items, 0–35) | |||||||
| B | 19.4 ± 4.9 | 20.3 ± 4.7b | −0.2 ± 3.7 | −0.5 ± 4.1 | 0.3 | −0.8–1.3 | .600 |
| E | 19.2 ± 4.7 | 19.8 ± 4.7 | |||||
| Work engagement (9 items, 0–54) | |||||||
| B | 23.6 ± 11.9 | 23.3 ± 12.0 | 0.7 ± 8.1 | 0.3 ± 9.3 | −1.4 | −3.2–0.4 | .109 |
| E | 24.3 ± 11.6 | 23.6 ± 10.8 | |||||
| There is an atmosphere of mutual support when people become ill (1 item, 1–4) | |||||||
| B | 2.8 ± 0.9 | 3.0 ± 0.8b | 0.1 ± 0.7 | 0.0 ± 0.8 | 0.0 | −0.2–0.2 | .776 |
| E | 2.9 ± 0.8 | 3.0 ± 0.8 | |||||
Mixed model: The model was populated with the amount of increase in each item as an outcome variable, with or without intervention, employee size, seminar format as fixed effects, workplace as a random effect, and baseline scores for each item as a covariate.
Intervention effects were shown in the table. ***P < .001, **P < .01, *P < .05.
Employee size: Not significant.
Seminar format: Not significant except for “understanding of professionals’ roles and consultation services in TWBS” (estimated values = −1.69, P = 0.007) and “work engagement.” (estimated values = −2.24, P = 0.037).
Significantly different from “Baseline” by paired t-test (P < .05).
Significantly different from “Control” by t-test (P < .05).
Intervention effects on secondary outcome
Regarding the workplace climate, among managers and workers, there was no significant difference between the intervention and control groups in the extent of increase in scores for PS, WE, and an atmosphere of mutual support. (Tables 3 and 4). Table 5 shows changes in managers’ feelings toward TWBS. There was no difference between the intervention and control groups in terms of managers’ intention to create an environment in which workers with illness can seek help, intention to create a workplace climate of understanding and helping each other and belief that TWBS initiatives can prevent job turnover. However, the intervention group tended to have significantly greater scores than the control group regarding intention to use the OH center (estimate: 0.6, 95% CI: 0.0–1.2, P = .068).
Changes in managers’ and workers’ feelings toward treatment-work balance support.
| Managers | Allocation | Mixed model | |||
|---|---|---|---|---|---|
| Control (n = 32) | Intervention (n = 32) | Estimated values | 95% CI | P-values | |
| Mean ± SD | Mean ± SD | ||||
| Intention to create an environment in which workers with illness can seek help (1 item, 0–5) | 4.1 ± 0.8 | 4.3 ± 1.1 | 0.3 | −0.3–0.9 | .372 |
| Intention to create a workplace climate of understanding and helping each other (1 item, 0–5) | 4.2 ± 0.7 | 4.3 ± 1.0 | 0.2 | −0.3–0.6 | .500 |
| Belief that TWBS initiatives can prevent job turnover (1 item, 0–5) | 3.8 ± 0.9 | 4.1 ± 1.1 | 0.4 | −0.1–0.9 | .156 |
| Intention to use the OH center (1 item, 0–5) | 3.3 ± 1.0 | 3.8 ± 1.3 | 0.6 | 0.0–1.2 | .068† |
| Workers | Control (n = 246) | Intervention (n = 295) | Estimated values | 95% CI | P-values |
| Mean ± SD | Mean ± SD | ||||
| Intention to seek help to the company if it becomes difficult for you to work due to illness (1 item, 0–5) | 3.5 ± 1.2 | 3.7 ± 1.1a | 0.2 | 0.0–0.4 | .086† |
| Willingness to help others at work when colleagues are ill (1 item, 0–5) | 3.7 ± 1.0 | 3.9 ± 0.9a | 0.2 | 0.0–0.4 | .019* |
| Belief that TWBS initiative can prevent job turnover (1 item, 0–5) | 3.2 ± 1.1 | 3.5 ± 1.0a | 0.3 | 0.1–0.5 | .004** |
| Intention to use the OH center (1 item, 0–5) | 2.9 ± 1.2 | 3.2 ± 1.0a | 0.2 | 0.0–0.5 | .056† |
Mixed model for managers: The model was constructed with or without intervention, employee size as fixed effects, and workplace as a random effect.Intervention effects were shown in the table. †P < .10.
Employee size: Not significant except for “intention to create a workplace climate of understanding and helping each other” (estimated values = 0.54, P = 0.031).
Mixed model for workers: The model was constructed with or without intervention, employee size, and seminar format as fixed effects, and workplace as a random effect.Intervention effects were shown in the table. **P < .01, *P < .05, †P < .10.
Employee size: Not significant except for “willingness to help others at work when colleagues are ill” (estimated values = 0.20, P = 0.024).
Seminar format: Not significant.
Significantly different from “Control” by t-test (P < .05).
Table 5 also shows changes in workers’ feelings toward TWBS, with intervention group scores being significantly greater than those of the control group for willingness to help others at work when colleagues are ill (estimate: 0.2; 95% CI: 0.0–0.4, P = .019) and belief that TWBS initiative can prevent job turnover (estimate: 0.3; 95% CI: 0.1–0.5, P = .004). The scores of the intervention group tended to be significantly greater than those of the control group in terms of intention to seek help to the company if it becomes difficult for you to work due to illness, (estimate: 0.2; 95% CI: 0.0–0.4, P = .086) and intention to use the OH center (estimate: 0.2; 95% CI: 0.0–0.5, P = .056).
DISCUSSION
This study is the first cluster randomized controlled trial to demonstrate that OHNs can promote TWBS in SMEs using a web meeting system, providing novel evidence, as described below.
Intervention effects on managers’ primary outcome
The effect of OHN interventions on managers was demonstrated in all three subscales of the “Recognition and Attitude Scale” indicating that the managers promoted company initiatives to provide TWBS in cooperation with OHNs, which may improve their understanding of professionals’ roles, and attitude and self-efficacy. Improvements in attitude and self-efficacy are known to be influenced by verbal persuasion.37 During the four online consultations, OHNs listened carefully to managers’ issues and worked closely with them, building a relationship of trust. Thus, the verbal persuasion of OHNs may have enhanced the self-efficacy of the managers. However, the lack of the intervention effect on awareness of TWBS guidelines by managers in both of control and intervention groups may be because the companies were certified as health and productivity management organizations or equivalent and may have been interested in TWBS. Moreover, managers in both groups could acquire knowledge on their own regarding the guidelines through the explanation process for recruiting and the questionnaire survey. Therefore, further improvement could not be expected.
Intervention effects on workers’ primary outcome
Intervention effects were observed in two of the three subscales of the “Recognition and Attitude Scale”—recognition of workplace initiatives and understanding of professional roles—as well as in awareness of TWBS guidelines, suggesting that the single seminar held to impart knowledge about the purpose of TWBS was effective. The cartoons used in the seminar was story-based and easily attracted the interest of the audience, which was considered to have helped to create an image of TWBS.
Regarding the formats of the seminars, the intervention effect by OHN was significantly higher for in-person seminars than online seminars, only for understanding professionals’ roles. An intervention study by Gayed et al.38 suggested that in-person seminars may be easier to understand than online seminars. The actual in-person encounter with OHNs may have impressed upon workers the role of the profession. However, no intervention effect was observed for attitude and self-efficacy of workers, suggesting that one seminar was not sufficient to increase their self-efficacy and that the intervention effect of verbal persuasion37 may not have been achieved because little relationship between the workers and OHNs had been established.
Intervention effects on secondary outcome
The reason the intervention by OHNs did not have an effect on the workplace climate may be because the intervention program could not include group work to encourage communication and mutual understanding due to the social distance measures imposed during the COVID-19 pandemic; thus, the intervention could not improve the conditions to achieve workplace climate. Although the association between workplace climate and TWBS score21 or between collaborative climate in the workplace and workers’ intentions for seeking help39 has been suggested, the format of the TWBS program, such as incorporating group work, would need to be modified in order to significantly improve workplace climate for TWBS.
The small sample size may have contributed to the fact that there was no difference in managers’ intention to create a workplace climate where TWBS was prevalent and their belief that TWBS initiatives would prevent turnover.
As for workers’ willingness to help each other at work when a colleague has difficulty due to illness and belief that TWBS initiative can prevent job turnover, the effectiveness of the intervention by OHNs was demonstrated possibility with the help of the cartoon used in the seminar. Nishikido et al. reported that OHNs provided support in promoting TWBS not only to workers with illnesses but also to managers, and HR staff.14–20 The fact that the intervention encouraged willingness and belief, empowering mutual respect and support suggests that the expected effect was achieved.
Regarding changes in workers’ feelings about intention to seek help from the company and intention to use the OH center, the intervention tended to increase positive feelings. It did not significantly affect self-efficacy, although a certain level of improvement was observed because most of the workers had little experience of illness that interfered with their work and no specific need for TWBS at that time.
Usability of the TWBS program using a web meeting system and OHNs’ support
Since the effectiveness of intervention program using web meeting system conducted by OHNs was demonstrated, it is expected that OHNs would be motivated to promote TWBS in SMEs with actively using web meeting system in the future.
In this intervention program, we have introduced two strategies, using web meeting system and OHNs, both of which can be generalized. Web meeting systems have become the mainstream of communication in companies since COVID-19 pandemic.22 OHNs are familiar with the characteristics of medical care and the workplace, and have a high-level of expertise in TWBS. Mid-level OHNs, not qualified expert nurses with experience of more than 10 years as in this study, can provide assistance in creating workplace environment that enables TWBS. As a characteristic of their support, mid-level OHNs can build trusting relationships with managers and workers in the company, provide advice to them, and coordinate multidisciplinary supports. Thus, the use of OHNs are considered to be generalizable.
Although SMEs have difficulties to employ OHNs directly,40,41 they can utilize OHNs in OH centers located in 47 prefectures. However, the number of OHNs at OH centers is not sufficient for assisting SMEs, where over 80% of workforce of Japan is employed. Nevertheless, we believe that OHNs in OH centers can provide more support to a large number of SMEs with this intervention program, by utilizing a web meeting system, saving travel time and other expenses.
Limitations and future research issues
The limitations of the study are as follows.
The sample size of managers (president, executives, and HR staff) was based on the number of companies when designing the intervention; hence the minimum number of managers in each company was assumed to be 1–3. Despite the small sample size, the intervention effects on managers indicate that the support model was highly effective for managers.
Since the research design of this study was to intervene in a company for 5-months, it was assumed that it would be difficult to obtain research cooperation unless the company had some understanding of the study. Therefore, recruitment in this study was carried out from companies certified as the health and productivity management organizations etc. It is not considered to be representative of SMEs in Japan as a whole. Intervention studies for companies that are not at all interested in TWBS need to be further examined in the future. Although this intervention program provided support five times and showed sufficient intervention effects, effectiveness verification studies on more simplified support will be expected in the future.
This study was conducted during the COVID-19 pandemic; thus, it is necessary to expand the program and confirm the reproducibility of the effects in normal times.
Finally, regarding the quality of the OHN intervention, the intervenor had been working as OHN for more than 10 years and obtained OHN specialist certification, which may imply a difficulty in achieving similar intervention effects with less experienced OHNs. Therefore, OHNs who can disseminate and promote TWBS in SMEs should further develop their competencies while utilizing ICT through education and training.
CONCLUSION
For managers, the intervention by OHN using a web meeting system was effective across all three subscales of the “Recognition and Attitude Scale,” namely, recognition of workplace initiatives, understanding of professional roles, and attitude and self-efficacy, in relation to TWBS.
For workers, the intervention by OHN using a web meeting system was effective in two of the subscales of the “Recognition and Attitude Scale,” namely, recognition of workplace initiatives and understanding of professional roles, as well as for awareness of TWBS guidelines.
However, there was no intervention effect on the workplace climate, in terms of PS, WE, and an atmosphere of mutual support, assessed by managers and workers.
AUTHOR CONTRIBUTIONS
Hitomi Abe and Noriko Nishikido conceived the ideas; Hitomi Abe collected the data; Hitomi Abe and Noriko Nishikido analyzed the data; and Hitomi Abe and Noriko Nishikido led the writing.
ACKNOWLEDGMENTS
We would like to express our deepest gratitude to the SMEs managers, human resource managers, and workers who participated in this study. We would like to acknowledge professor Hideaki Matsuki and associate professor Ai Tomotaki for advices on statistical analysis.
FUNDING INFORMATION
This study was funded by Nihon Full Happ, the Public Interest Incorporated Foundation, and the Japan Foundation for Promoting Welfare of Small and Medium-sized Enterprises.
DATA AVAILABILITY STATEMENT
Research data are not shared.
DISCLOSURE
Approval of the Research Protocol: This study was conducted with the approval of the Institutional Review Board for Clinical Research of Tokai University (21R-127). Informed Consent: This research conformed to the Declaration of Helsinki (as revised in Brazil 2013). Animal Studies: N/A. Conflict of Interest: N/A.
REFERENCES
Author notes
[Correction added on 10 Aug 2023, after first online publication: Some typographical corrections have been amended in this version].
