


Abstract
We examined the associations of perceived psychosocial safety climate (PSC) with psychological distress and work engagement in Japanese employees. We also examined the mediation effects of job demands (i.e., psychological demands) and job resources (i.e., job control, worksite support, and extrinsic reward) in these associations.
A total of 2200 employees (1100 men and 1100 women) registered with a Japanese online survey company were surveyed using a self-administered web-based questionnaire containing the scales on PSC (12-item PSC scale), job demands and job resources (Job Content Questionnaire and Effort-Reward Imbalance Questionnaire), psychological distress (K6 scale), and work engagement (9-item Utrecht Work Engagement Scale), and items on demographic and occupational characteristics (i.e., age, sex, education, occupation, work form, and working hours per week). A multiple mediation analysis with a bootstrap method was conducted.
After adjusting for demographic and occupational characteristics, significant negative and positive total effects of perceived PSC were observed on psychological distress and work engagement, respectively (c = −0.258 [95% confidence interval (CI): −0.298 to −0.219] and 0.383 [95% CI: 0.344–0.421], respectively). When we included job demands and job resources as mediators in the model, significant total mediation effects in these associations were observed (c − c′ = −0.181 [95% CI: −0.221 to −0.143] and 0.269 [95% CI: 0.234–0.304], respectively).
Our findings suggest that perceived PSC is negatively associated with psychological distress and positively associated with work engagement, and that these associations are partially mediated (or explained) by job demands and job resources.
INTRODUCTION
In the past decade, psychosocial safety climate (PSC) has been proposed to be an organizational factor, primarily attributable to the management, that predicts employee health,1 and empirical evidence linking PSC and employee health has accumulated.2 PSC is defined as the shared perceptions of employees of their organization’s “policies, practices, and procedures for the protection of worker psychological health and safety”1,(p. 580) and comprises four domains: management commitment (MC: whether senior management is cooperative, involved, and committed to stress prevention), management priority (MP: whether management prioritizes employee psychological health and safety over productivity), organizational communication (OC: whether the organization listens to contributions from employees on factors affecting psychological health), and organizational participation (OP: whether there is consultation and active participation in health and safety issues from all levels of the organization).3
The mechanism underlying the effect of PSC on employee health (especially mental health) is often explained within the “health erosion pathway” and “motivational pathway” of the extended job demands-resources (JD-R) model,1 which adds PSC upstream of the conventional JD-R model as a factor that prevents an increase in job demands (e.g., psychological demands, emotional demands, role conflict, and harassment/bullying) and enhances job resources (e.g., job control, worksite support, extrinsic reward, procedural justice, and learning opportunities).4,5 The former pathway assumes that a lack of PSC in an organization can lead to inappropriate job design in the form of chronic job demands. In organizations where there is a lack of policies, practices, and procedures aimed at keeping job demands at a manageable level, high levels of job pressure or psychological demands may be prevalent. Moreover, without these measures, it may be difficult to find effective ways to cope with the workload that employees are expected to handle, which can lead to overtaxing and an erosion of employees’ energy reserve.1 As a result, employees are more likely to experience psychological health problems (e.g., psychological distress, emotional exhaustion, and depressive symptoms). The latter pathway assumes that PSC can promote the growth of job resources. Senior management plays an important role in shaping the organizational climate, through setting priorities, and allocating resources; therefore, a management style that supports psychological well-being may increase employees’ sense of being in control (and actual control) over their work, feeling respected, and getting the support they need in a positive work environment that promotes open communication, collaboration, and mutual respect between management and employees.1 Additionally, PSC also functions as a safety signal that indicates whether it is safe to utilize job resources to cope with the workload6; therefore, employees are more likely to feel supported to safely utilize job resources to cope with their workload, which may lead to the prevention of psychological health problems and improved work engagement. These pathways have been supported by a number of empirical studies, particularly in Australia,1,7–13 where PSC was proposed, as well as in Malaysia.11,14–19
While majority research on PSC dominates in the psychological field, epidemiological studies on PSC are still limited.20–23 Japan is no exception, where the concept of PSC is not well known, and no epidemiological studies have been conducted. Particularly in Japan, a unique corporate culture that emphasizes informal hierarchical (i.e., senior–junior) relationships, as symbolized by the term “senpai-kōhai,”24 as well as lifetime employment and seniority system has persisted.25 However, whether PSC can function in such a corporate society has not yet been confirmed. In addition, as noted above, PSC comprises four domains, but previous studies presented above have only examined the association of total PSC and have not examined by domain. Examining whether each domain of PSC has similar findings to total PSC may assist in guiding future research needs to address PSC by domain.
The aims of this study were to examine the associations of perceived PSC (i.e., individual perceptions of PSC) and its domains with psychological distress and work engagement, as well as the mediation effects of job demands and job resources in these associations for Japanese employees. In this study, based on the demand–control–support (DCS) and effort–reward imbalance (ERI) models,26,27 which are the basis for the JD-R model,28 psychological demands were selected as job demands; job control, worksite support, and extrinsic reward were selected as job resources. As direct effect hypotheses for the associations of perceived PSC with psychological distress and work engagement, we hypothesized that perceived PSC is negatively associated with psychological distress (Hypothesis 1) and positively associated with work engagement (Hypothesis 2). As mediational hypotheses, based on the “health erosion pathway” and the “motivational pathway,” possible mechanisms introduced earlier, we hypothesized that job demands and job resources have negative mediation effects in the association of perceived PSC with psychological distress (Hypothesis 3a for job demands and Hypothesis 3b for job resources), as perceived PSC is expected to be negatively associated with job demands which in turn are positively associated with psychological distress, whereas perceived PSC is expected to be positively associated with job resources which in turn are negatively associated with psychological distress.1 In addition, we hypothesized that job resources have positive mediation effects in the association of perceived PSC with work engagement (Hypothesis 4), as perceived PSC is expected to be positively associated with job resources which in turn are positively associated with work engagement.1 The research model for this study is shown in Figure 1.
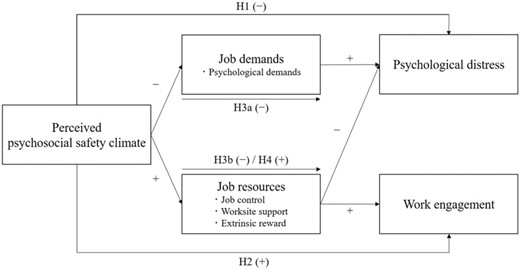
Research model for this study (H: hypothesis). Notes: H1 and H2: direct effect hypothesis; H3a, H3b, and H4: mediational hypothesis.
METHODS
Participants
This study employed a cross-sectional survey with the participation of employees registered with a Japanese private online survey company in October 2020. Of the approximately 1.19 million available registrants (570 thousand men and 620 thousand women) covering all industries and occupations, 87 060 (42 784 men and 44 276 women) were randomly selected. In the advertisement to the randomly selected registrants, online shopping points worth a few hundred yen (i.e., a few US dollars) were mentioned as the incentive for participation. Responses were on a first-come, first-served basis, and due to budget constraints, the call was closed when the number of respondents reached 2200. These 2200 respondents were currently employed by a company, organization, government agency, self-employed person, or private household to earn salary or wage (including executives). In the online survey, sample size limits were set for each age group (i.e., 20s–60s) and sex to ensure that the sample size was equal in each group. All variables used in this study, except age and sex obtained from the registration information of the online survey company, were measured using a self-administered web-based questionnaire. As the questionnaire required participants to answer all the questions, there were no incomplete responses. Study purposes and procedures were explained to the participants, and online informed consent was obtained from them prior to the study. Kitasato University Medical Ethics Organization reviewed and approved the purposes and procedures of this study (No. B20-180).
Measures
Exposure: perceived psychosocial safety climate (PSC)
Perceived PSC was measured using the Japanese version of the 12-item psychosocial safety climate scale (PSC-12).29 The PSC-12 consists of four subscales (MC, MP, OC, and OP, each measured by three items), with each item measured on a 5-point Likert scale (1 = Strongly disagree to 5 = Strongly agree). Total scores of the PSC-12 (range: 12–60) and its subscales (range: 3–15) were calculated by summing item scores. Cronbach’s alpha coefficient for this sample was .97 for total PSC and .91–.94 for each subscale.
Mediators: job demands and job resources
As introduced earlier, psychological demands were selected as job demands; job control, worksite support, and extrinsic reward were selected as job resources.
For job demands, psychological demands were measured using the Japanese version of the Job Content Questionnaire (JCQ).30 The JCQ has a 5-item psychological demands scale, measured on a 4-point Likert scale (1 = Strongly disagree to 4 = Strongly agree). The total score (range: 12–48) was calculated according to the JCQ User’s Guide.31 Cronbach’s alpha coefficient for this sample was .65.
For job resources, job control and worksite support were measured using the JCQ30 introduced above, and extrinsic reward was measured using the Japanese short version of the Effort-Reward Imbalance Questionnaire (Short ERIQ).32 The JCQ has 9-item job control; 4-item supervisor support; and 4-item coworker support scales, measured on a 4-point Likert scale (1 = Strongly disagree to 4 = Strongly agree). The total scores (range: 24–96 for job control and 4–16 for supervisor support and coworker support) were calculated according to the JCQ User’s Guide.31 The scores for coworker support and supervisor support were summed to calculate a score for worksite support (range: 8–32). Cronbach’s alpha coefficients for this sample were .75, .91, and .87 for job control, supervisor support, and coworker support, respectively. The Short ERIQ has a 7-item scale measuring extrinsic reward such as salary (e.g., “Considering all my efforts and achievements, my salary/income is adequate.”), promotion (e.g., “My job promotion prospects are poor.”), job security (e.g., “My job security is poor.”), and esteem (e.g., “I receive the respect I deserve from my superior or a respective relevant person.”) on a 4-point Likert scale (1 = Strongly disagree to 4 = Strongly agree). After reversing the scores for items indicating unfavorable conditions, the total score (range: 7–28) was calculated by summing the scores for each item. Cronbach’s alpha coefficient for this sample was .68.
Outcomes: psychological distress and work engagement
Psychological distress was measured using the Japanese version of the K6 scale.33 The K6 scale consists of six items measuring the levels of depression and anxiety on a 5-point Likert scale (0 = None of the time to 4 = All of the time). The total score (range: 0–24) was calculated by summing item scores. Cronbach’s alpha coefficient for this sample was .94.
Work engagement was measured using the Japanese version of the 9-item Utrecht Work Engagement Scale (UWES-9).34 The UWES-9 consists of nine items measuring the levels of vigor, dedication, and absorption on a 7-point Likert scale (0 = Never to 6 = Always). The total score (range: 0–6) was calculated by averaging the scores for each item. Cronbach’s alpha coefficient for this sample was .96.
Covariates
Covariates included demographic and occupational characteristics (i.e., age, sex, education, occupation, work form, and working hours per week).21–23 Age was used as a continuous variable. Education was categorized into graduate school, college, junior college, vocational school, and high school or junior high school. Occupation was categorized into managerial employee, nonmanual employee, manual employee, and other. Work form was categorized into day shift, shift work with night duty, shift work without night duty, and night shift. Working hours per week were categorized into 30 h or less, 31–40 h, 41–50 h, 51–60 h, and 61 h or more.
Statistical analysis
First, to provide an overall view of the participants, distribution of demographic and occupational characteristics and scale scores as well as Pearson’s correlation coefficients among scale scores were calculated. Second, using the PROCESS macro for SPSS,35 a multiple mediation analysis with a bootstrap method was conducted to estimate the total and direct effects of perceived PSC on psychological distress and work engagement as well as the mediation (or indirect) effects of job demands (i.e., psychological demands) and job resources (i.e., job control, worksite support, and extrinsic reward). In the analysis, perceived PSC was included as an independent variable; psychological demands, job control, worksite support, and extrinsic reward were included as mediator variables; and psychological distress or work engagement was included as a dependent variable. After standardizing these variables, we calculated (1) the c coefficient (indicating the total effect of perceived PSC on psychological distress or work engagement); (2) the c ′ coefficient (indicating the direct effect of perceived PSC on psychological distress or work engagement); and (3) the difference between c and c ′ (i.e., c − c ′) (indicating the total mediation effect of mediators) as well as their 95% confidence intervals (CIs), based on 5000 bootstrap samples. Furthermore, (4) point estimates and their 95% CIs for each mediator were calculated to examine the specific mediation effects. It should be noted that the sum of the specific mediation effects of each mediator corresponds to the total mediation effect. These coefficients were determined to be significant if their 95% CIs did not include zero. On that basis, it was determined that job demands and job resources would have a full mediation effect if the total mediation effect was significant (i.e., 95% CI of c − c ′ did not include zero) and direct effect was not significant (i.e., 95% CI of c ′ coefficient included zero); and that they would have a partial mediation effect if both total mediation and direct effects were significant (i.e., 95% CIs of c − c ′ and c ′ coefficient did not include zero). In the analyses, we first calculated the crude coefficients (i.e., without any adjustment) (Model 1). Subsequently, we adjusted for demographic and occupational characteristics (Model 2). In addition, similar analysis was conducted using each domain of perceived PSC (i.e., MC, MP, OC, and OP) as an independent variable.
RESULTS
Table 1 shows the detailed characteristics of participants. Demographic and occupational characteristics showed a high percentage of college graduates, nonmanual employees, day shift jobs, and 31–40 h of work per week. The mean score (standard deviation) of the PSC-12 was 34.8 (11.4) (cf. 42.3 (10.6) for the Australian Workplace Barometer [AWB] national sample [n = 1563]),36 and the percentages in each benchmark level was 29.1% (cf. 63.1% for the AWB national sample) at low risk (range: 41–60), 11.6% (cf. 6.9% for the AWB national sample) at medium risk (range: 37–40), 35.2% (cf. 20.2% for the AWB national sample) at high risk (range: 27–36), and 24.1% (cf. 9.8% for the AWB national sample) at very high risk (range: 12–26).
Detailed characteristics of participants.
| Demographic and occupational characteristics | Mean (SD) | n (%) |
|---|---|---|
| Age | 44.6 (13.3) | |
| Sex | ||
| Men | 1100 (50.0) | |
| Women | 1100 (50.0) | |
| Education | ||
| Graduate school | 126 (5.7) | |
| College | 1054 (47.9) | |
| Junior college | 246 (11.2) | |
| Vocational school | 245 (11.1) | |
| High school or junior high school | 529 (24.0) | |
| Occupation | ||
| Managerial employee | 249 (11.3) | |
| Nonmanual employee | 1508 (68.5) | |
| Manual employee | 294 (13.4) | |
| Other | 149 (6.8) | |
| Work form | ||
| Day shift | 1947 (88.5) | |
| Shift work with night duty | 184 (8.4) | |
| Shift work without night duty | 44 (2.0) | |
| Night shift | 25 (1.1) | |
| Working hours per week | ||
| 30 h or less | 517 (23.5) | |
| 31–40 h | 725 (33.0) | |
| 41–50 h | 666 (30.3) | |
| 51–60 h | 184 (8.4) | |
| 61 h or more | 108 (4.9) | |
| Scale scores | Mean (SD) | Cronbach’s α |
|---|---|---|
| Perceived psychosocial safety climate (PSC-12) (range: 12–60) | 34.8 (11.4) | .97 |
| Management commitment (PSC-12) (range: 3–15) | 8.71 (3.07) | .93 |
| Management priority (PSC-12) (range: 3–15) | 8.77 (3.17) | .94 |
| Organizational communication (PSC-12) (range: 3–15) | 8.77 (3.01) | .91 |
| Organizational participation (PSC-12) (range: 3–15) | 8.52 (3.07) | .92 |
| Psychological demands (JCQ) (range: 12–48) | 31.4 (5.89) | .65 |
| Job control (JCQ) (range: 24–96) | 62.7 (11.2) | .75 |
| Supervisor support (JCQ) (range: 4–16) | 10.5 (2.76) | .91 |
| Coworker support (JCQ) (range: 4–16) | 10.9 (2.40) | .87 |
| Extrinsic reward (Short ERIQ) (range: 7–28) | 17.4 (3.14) | .68 |
| Psychological distress (K6 scale) (range: 0–24) | 6.77 (6.05) | .94 |
| Work engagement (UWES-9) (range: 0–6) | 2.42 (1.45) | .96 |
Abbreviations: ERIQ, Effort-Reward Imbalance Questionnaire; JCQ, Job Content Questionnaire; PSC-12, 12-item psychosocial safety climate scale; SD, standard deviation; UWES-9, 9-item Utrecht Work Engagement Scale.
Pearson’s correlation coefficients among scale scores showed that perceived PSC and its domains were significantly negatively correlated with psychological demands and psychological distress; and significantly positively correlated with job control, supervisor support, coworker support, extrinsic reward, and work engagement (Appendix 1).
Table 2 shows the results of the main analysis with psychological distress as a dependent variable. In the crude model (Model 1), perceived PSC had a significant negative total effect on psychological distress (c = −0.255 [95% CI: −0.296 to −0.215]). When we included job demands and job resources (i.e., psychological demands, job control, worksite support, and extrinsic reward) as mediators in the model, the total mediation effect was significant and negative (c − c ′ = −0.161 [95% CI: −0.199 to −0.121]). Furthermore, perceived PSC had a significant negative direct effect on psychological distress (c ′ = −0.095 [95% CI: −0.145 to −0.044]). Thus, job demands and job resources partially mediated the effect of perceived PSC on psychological distress. For the specific mediation effects of job demands and job resources, a significant negative effect was observed for psychological demands (point estimate = −0.036 [95% CI: −0.049 to −0.025]) and extrinsic reward (point estimate = −0.124 [95% CI: −0.153 to −0.096]), whereas no such significant mediation effect was observed for job control (point estimate = −0.003 [95% CI: −0.017 to 0.012]) or worksite support (point estimate = 0.002 [95% CI: −0.032 to 0.038]). These patterns remained constant after adjusting for demographic and occupational characteristics (Model 2). The results of the direct effect of perceived PSC on psychological distress and the specific mediation effects of job demands and job resources in Model 2 are shown in Figure 2.
Total and direct effects of perceived psychosocial safety climate on psychological distress and mediation effects of job demands and job resources: multiple mediation analyses with a bootstrap method (1100 men and 1100 women).
| Point estimate (95% confidence interval) | ||
|---|---|---|
| Model 1a | Model 2b | |
| Total effect (c coefficient) | −0.255 (−0.296 to −0.215) | −0.258 (−0.298 to −0.219) |
| Direct effect (c ′ coefficient) | −0.095 (−0.145 to −0.044) | −0.077 (−0.126 to −0.028) |
| Total mediation effect (c − c ′) | −0.161 (−0.199 to −0.121) | −0.181 (−0.221 to −0.143) |
| Specific mediation effect | ||
| Psychological demands | −0.036 (−0.049 to −0.025) | −0.026 (−0.037 to −0.016) |
| Job control | −0.003 (−0.017 to 0.012) | −0.001 (−0.015 to 0.012) |
| Worksite supportc | 0.002 (−0.032 to 0.038) | −0.021 (−0.055 to 0.013) |
| Extrinsic reward | −0.124 (−0.153 to −0.096) | −0.134 (−0.163 to −0.107) |
Crude (i.e., without any adjustment).
Fully adjusted (i.e., adjusted for age, sex, education, occupation, work form, and working hours per week).
Total scores for supervisor support and coworker support.
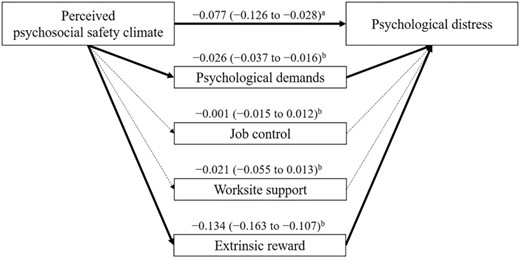
Direct effect of perceived psychosocial safety climate on psychological distress and specific mediation effects of job demands and job resources in Model 2. Notes: (a) direct effect, (b) specific mediation effect. Numbers refer to coefficient (95% confidence interval) for each effect. Bold lines indicate significant specific mediation effect. Dotted lines indicate nonsignificant specific mediation effect.
When we conducted similar analyses using each domain of perceived PSC (i.e., MC, MP, OC, and OP) as an independent variable, the patterns were nearly identical to the main analysis (Appendix 2). Exceptionally, however, the direct effect of OP on psychological distress was not significant for Model 2 (c ′ = −0.039 [95% CI: −0.084 to 0.007]).
Table 3 shows the results of the main analysis with work engagement as a dependent variable. In the crude model (Model 1), perceived PSC had a significant positive total effect on work engagement (c = 0.381 [95% CI: 0.343–0.420]). When we included job demands and job resources as mediators in the model, the total mediation effect was significant and positive (c – c ′ = 0.256 [95% CI: 0.221–0.292]). Furthermore, perceived PSC had a significant positive direct effect on work engagement (c ′ = 0.125 [95% CI: 0.078–0.172]). Therefore, job demands and job resources partially mediated the effect of perceived PSC on work engagement. For the specific mediation effects of job demands and job resources, a significant negative mediation effect was observed for psychological demands (point estimate = −0.011 [95% CI: −0.019 to −0.005]), whereas a significant positive effect was observed for job control (point estimate = 0.063 [95% CI: 0.047–0.079]), worksite support (point estimate = 0.125 [95% CI: 0.092–0.157]), and extrinsic reward (point estimate = 0.080 [95% CI: 0.055–0.106]). These patterns remained constant after adjusting for demographic and occupational characteristics (Model 2). The results of the direct effect of perceived PSC on work engagement and the specific mediation effects of job demands and job resources in Model 2 are shown in Figure 3.
Total and direct effects of perceived psychosocial safety climate on work engagement and mediation effects of job demands and job resources: multiple mediation analyses with a bootstrap method (1100 men and 1100 women).
| Point estimate (95% confidence interval) | ||
|---|---|---|
| Model 1a | Model 2b | |
| Total effect (c coefficient) | 0.381 (0.343 to 0.420) | 0.383 (0.344 to 0.421) |
| Direct effect (c ′ coefficient) | 0.125 (0.078 to 0.172) | 0.114 (0.068 to 0.160) |
| Total mediation effect (c − c ′) | 0.256 (0.221 to 0.292) | 0.269 (0.234 to 0.304) |
| Specific mediation effect | ||
| Psychological demands | −0.011 (−0.019 to −0.005) | −0.017 (−0.025 to −0.009) |
| Job control | 0.063 (0.047 to 0.079) | 0.061 (0.047 to 0.078) |
| Worksite supportc | 0.125 (0.092 to 0.157) | 0.139 (0.107 to 0.172) |
| Extrinsic reward | 0.080 (0.055 to 0.106) | 0.086 (0.062 to 0.110) |
Crude (i.e., without any adjustment).
Fully adjusted (i.e., adjusted for age, sex, education, occupation, work form, and working hours per week).
Total scores for supervisor support and coworker support.

Direct effect of perceived psychosocial safety climate on work engagement and specific mediation effects of job demands and job resources in Model 2. Notes: (a) direct effect, (b) specific mediation effect. Numbers refer to coefficient (95% confidence interval) for each effect. Bold lines indicate significant specific mediation effect.
When we conducted similar analyses using each domain of perceived PSC as an independent variable, the patterns were nearly identical to the main analysis (Appendix 3).
DISCUSSION
This study demonstrated a significant negative total effect of perceived PSC on psychological distress (Hypothesis 1 was supported). Furthermore, the specific mediation effects of psychological demands and extrinsic reward in this association were significantly negative, whereas those of job control and worksite support were not significant (Hypothesis 3a was supported whereas Hypothesis 3b was partially supported). On the other hand, a significant positive total effect of perceived PSC on work engagement was demonstrated (Hypothesis 2 was supported). Furthermore, the specific mediation effects of job control, worksite support, and extrinsic reward in this association were significantly positive (Hypothesis 4 was supported), whereas that of psychological demands was significantly negative. Each domain of perceived PSC showed similar associations and effects to the main analysis.
A significant negative total effect of perceived PSC on psychological distress as well as a significant negative specific mediation effect of psychological demands in this association was observed. This is consistent with the “health erosion pathway”1 and empirical findings from Australia and Malaysia, which showed that a lack of PSC exacerbates employee psychological health problems through increased job demands.1,8,10,11,13 Our findings validate the findings of previous studies in the context of Japanese employees. Furthermore, for the specific mediation effects of job resources, only extrinsic reward was significant while job control and worksite support were not. A recent study of PSC as a multilevel extension of ERI showed that PSC was negatively associated with ERI, which in turn leads to employee psychological health problems.37 Extrinsic reward is classically one of the elements included in distributive justice among organizational justice.38 It captures areas closer to the organizational level than job control and worksite support. Considering that PSC is proposed to be an organizational factor, as introduced earlier, job resources closer to organizational level are more likely to mediate the association of perceived PSC with psychological distress. In a work environment where the senior management does not value employee health, each employee is less respected and less attention is given to adjusting their work schedules and workload, which can exacerbate psychological health problems among employees.
A significant positive total effect of perceived PSC on work engagement as well as significant positive specific mediation effects of job resources (i.e., job control, worksite support, and extrinsic reward) in this association was observed. This is consistent with the “motivational pathway,” another theoretical pathway shown in the extended JD-R model,1 and empirical findings from Australia and Malaysia, which showed that PSC enhances work engagement through increased job resources.1,12,14,15,18 A management style supportive of psychological well-being would provide employees with a respectful and supportive work environment as well as control over work timing and methods,39 which may lead to enhanced work engagement. On the other hand, the self-determination theory40 suggests that extrinsic reward such as salary could be used as a method of increasing extrinsic motivation yet if extrinsic reward is perceived to be controlling rather than informative, it is viewed as manipulating one’s behavior rather than supporting natural interest and competence in the task, which could reduce motivation in the long term.41 As this study used a cross-sectional design, the long-term effect of extrinsic reward on work engagement could not be examined, but future research should use a prospective design and also measure how employees perceive extrinsic reward to examine the mediation effects of extrinsic reward in the association of PSC with work engagement in more detail.
In addition, a significant negative specific mediation effect of psychological demands in the association of perceived PSC with work engagement was also observed. Although this observation is interesting in itself, given that the pathway that PSC influences work engagement through job demands is not assumed in the extended JD-R model1 and that the specific mediation effect of psychological demands is quite small compared to that of job resources (see Table 3 and Appendix 3), the mediation effect of psychological demands in the association of perceived PSC with work engagement may not be practically significant. Some studies have argued that the association of job demands with work engagement (or work motivation) should be examined by distinguishing between “challenge” and “hindrance” depending on the characteristics of job demands42; therefore, it is necessary to examine the mediation effect of job demands in the extended JD-R model more precisely, including factors classified as hindrance, such as role conflict and harassment/bullying, in the future.
The mediation effects of job demands and job resources in the associations of perceived PSC with psychological distress and work engagement were determined to be partial rather than full mediation. In this sample, the mediation effects accounted for approximately 70% of the total effects of perceived PSC (e.g., in Model 2, with psychological distress as the outcome, (c − c ′)/c = −0.181/−0.258 = 0.702, and with work engagement as the outcome, (c − c ′)/c = 0.269/0.383 = 0.702). This finding seems reasonable considering that this study treated only four factors as proposed mediators as elements of job demands and job resources, based on the DCS and ERI models.26,27 It is possible that some of the direct effects of perceived PSC on psychological distress and work engagement observed in this study include mediation effects of other job demands and job resources (e.g., procedural justice and learning opportunities, in addition to role conflict and harassment/bullying as described above) that were not captured in this study.7,8,12,15,17 Future research should include these factors more comprehensively to explore the mediation effects of job demands and job resources.
Based on the benchmarks presented in the AWB data,36 the distribution of PSC-12 scores in this sample showed that approximately 60% were at high to very high risk, which was much higher than the 30% in Australia (20%–40% by state). It has been suggested that Japanese people are less likely to respond positively to positive questions43; for example, work engagement has been shown to be very low for Japanese people compared to other countries,44 and this may also be the case for PSC. Further international comparative studies of PSC are needed to clarify the details.
Certain possible limitations of this study should be considered. First, the participants were from one particular private online survey company. A previous study has reported a high proportion of professional or technical employees among the registrants of online survey companies,45 and also in this study, nonmanual employees accounted for just under 70% of the respondents; therefore, this study should pay attention to the representativeness of the participants and generalizability of the findings. Second, various factors that were not measured in this study may have confounded our findings. For example, those who have higher levels of neuroticism may have been more likely to evaluate psychosocial work environment (i.e., PSC, job demands, and job resources) as worse46 and to be more psychologically distressed.47 Such a lack of measurement of personality traits may have affected our findings. Third, all key variables used in the analysis were measured using a self-administered questionnaire, which may have introduced a common method variance, although measures were taken to ensure that responses to the questionnaire were anonymous. However, Harman’s single factor test (i.e., exploratory factor analysis without rotation) extracted 11 theoretically interpretable factors with eigenvalues of 1 or more, and the total variance extracted by one factor was 28.6%, which is below the 50% level at which common method variance is considered to have occurred.48 Fourth, as discussed earlier, this study captured only four factors as job demands and job resources. A more comprehensive study based on the extended JD-R model is required in the future, measuring different kinds of job demands and job resources. Fifth, causal inferences are limited due to the cross-sectional nature of the study. The present findings seem to indicate that those who were psychologically distressed were more likely to evaluate their work environment negatively, and conversely, those who perceived higher levels of work engagement were more likely to evaluate their work environment positively. Finally, as introduced earlier, the concept of PSC focuses on the “shared perceptions” of employees of their organization; therefore, theoretically, the data should be collected using a multilevel approach to measure company or workplace level PSC.49 However, as this study was based on registrants, of an online survey company, who were not nested within company or workplace, such an approach was not possible (i.e., only individual perceptions of PSC were measured), and our findings may be subject to bias due to individual factors. Although there are some constraints to a multilevel approach, such as the need to reach a minimum level of agreement sufficient to show that perceptions of PSC are truly shared among members of a company or workplace,50 future research should examine whether our findings can be replicated by a multilevel approach with employees nested within companies, workplaces, and other settings.
In conclusion, this study supports previous findings by suggesting that perceived PSC is negatively associated with psychological distress and positively associated with work engagement, and that these associations are partially mediated (or explained) by job demands and job resources. Our findings suggest that PSC is applicable to diverse corporate cultures, including Japan. The concept of PSC may have a high affinity in Japanese companies, which are promoting health and productivity management; therefore, our findings may contribute to the dissemination of the concept of PSC and further promotion of occupational health activities in Japanese companies. Future research should examine whether our findings can be replicated using a prospective design, and intervention studies should be conducted to determine whether improvements in PSC can contribute to alleviated psychological distress and enhanced work engagement through reduced job demands and increased job resources.
AUTHOR CONTRIBUTIONS
A.I. conceptualized this study, conducted statistical analyses, and drafted the original article; A.T. supervised the conduct of this study; H.E., Y.K., and A.T. interpreted the results, reviewed the article draft, and revised it critically on intellectual content; and all authors approved the final version of the article and agreed to be accountable for all aspects of the work, ensuring that the questions related to the accuracy or integrity of any part of the work were appropriately investigated and resolved.
ACKNOWLEDEGEMNTS
We thank Editage (www.editage.com) for English language editing. This study was supported by Japan Society for the Promotion of Science (JSPS KAKENHI: Grant Number JP20K10477) and Ministry of Health, Labour and Welfare, Japan (Industrial Disease Clinical Research Grants: Grant Number 200401-01).
DISCLOSURE
Approval of the research protocol: This study was approved by Kitasato University Medical Ethics Organization (No. B20-180). Informed Consent: Study purposes and procedures were explained to the participants, and online informed consent was obtained from them prior to the study. Registry and the Registration No. of the study/trial: N/A. Animal Studies: N/A. Conflict of Interest: Authors declare no conflict of interests for this article.
DATA AVAILABILITY STATEMENT
The data that support the findings of this study are available from the corresponding author upon reasonable request.
