


Abstract
While the number of employed women has increased worldwide, they still have difficulties in practicing prenatal care at work. Previous studies have found that smartphone-based prenatal education has increased access to healthcare and contributed to improving pregnant women’s health. The objective of this study was to evaluate the effectiveness of a mobile-based intervention—Self-care for Pregnant Women at Work (SPWW)—in enhancing the self-care practices of pregnant women who work.
A randomized repeated measures design was used in the study. The 126 women were randomly assigned to either an intervention group that used the SPWW mobile application for 4 weeks or a control group that used an application that only had surveys. Both groups completed surveys at preintervention, week 2, and week 4 of their participation in the study. The primary study variables were work stress, pregnancy stress, fear of childbirth, pregnancy experience, and health practices in pregnancy.
A total of 116 participants’ data (60 in the intervention group and 56 in the control group) were analyzed. Significant group-by-time interaction effects were noted for pregnancy stress, pregnancy hassles, and health practices in pregnancy. The effect size of the intervention was small to medium for pregnancy stress (d = −0.425), pregnancy uplifts (d = 0.333), pregnancy hassles (d = −0.599), and health practices in pregnancy (d = 0.490).
A mobile-based intervention using a comprehensive health application is effective in pregnant women at work. Developing educational content and methods targeted at this population would be helpful.
INTRODUCTION
The global economic engagement rate of women was around 50% in 2020.1 In South Korea, the rate has increased from 49.6% in 2010 to 52.8% in 2020.2 Reproductive women make up a large proportion of the workforce and about 90% of women are employed during their pregnancy.3 However, many challenges have been reported in relation to being pregnant at work.4 In South Korea, pregnancy has been cited as the third most common reason for career interruptions for women, following marriage and the burden of childcare.5
Pregnant women at work often experience difficulties in performing regular prenatal care and daily self-care related to pregnancy.6 Many working women who are pregnant spend over 8 h per day at their workplace and are often exposed to various occupational hazards, including reprotoxic agents and ergonomic risk factors during pregnancy.4 Compared with nonworking women, working women had a higher risk of adverse pregnancy outcomes such as threatened abortion, preterm labor, and intrauterine growth restriction.4 Efficient means of delivering prenatal care and programs to support pregnant workers’ health management is essential.
Health education programs using mobile applications are an attractive and effective way to deliver health interventions.7,8 Mobile interventions are easy to access, convenient to use, and time-saving.8 Considering that many of the pregnant women who work cannot attend offline prenatal education due to time and location limitations,7,8 mobile-based intervention can be a good alternative.
Many recent studies support the effectiveness of the interventions for pregnant women that utilized mobile applications. A study which administered mindfulness training sessions through a mobile application reported effectiveness in relieving pregnant women’s prenatal depression.9 Additionally, a study which examined the use of a mobile application for coping with stress among hospitalized pregnant women with a risk of premature birth reported alleviation in their perceived stress.10 The majority of the mobile applications are targeted at pregnant women’s mental health,11,12 and there is currently no mobile application developed and tested for pregnant women at work who often acquire information about pregnancy online.
The purpose of this study was to evaluate the effectiveness of mobile-based interventions for enhancing prenatal health practices. The mobile application called Self-care for Pregnant Women at Work (SPWW) was used in this study (Figure 1). The developmental process and the detailed information about the application, including Orem’s Self-care Deficit Theory that guided the intervention, is explained elsewhere.13
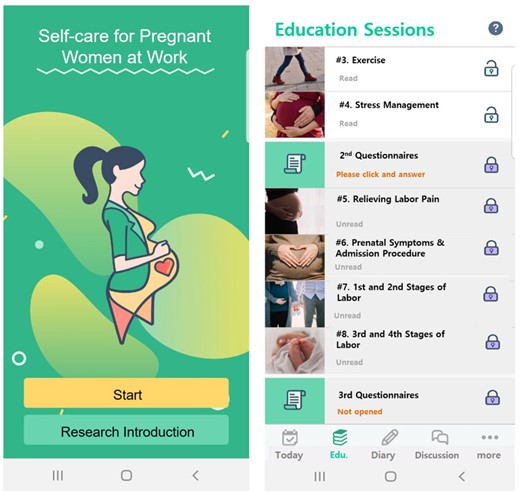
Screenshots of the Self-care for Pregnant Women at Work (SPWW) Mobile Application.
METHODS
This was a randomized repeated measures study conducted from November 2019 to April 2020. Approval for the study was received from the Institutional Review Board of the institute where the project investigator was affiliated (#1041078-201 910-HRSB-315-01). Although no protocol paper was published, the trial protocol was registered (KCT0007805) before the research was conducted.
Participants and Settings
The participants were recruited from South Korean online communities where pregnant women and women raising children exchange information. The study contained two groups. The intervention group used the SPWW application that included intervention components and study surveys over 4 weeks, while the control group used a mobile application that only had study surveys.
A sample of 58 participants per group was used in the calculations to ensure 80% power, an alpha level of .05, and an effect size of 0.30 to account for measures and to detect a difference of 0.5 between the groups’ means overall during the follow-up period.14 A study that implemented an intervention to improve prenatal health behaviors and used the same scale to assess health practices in pregnancy showed an effect size of 0.565; however, the study was limited by a small sample size.15 Another study that applied a stress coping mobile intervention for pregnant women, but used a different scale, reported an effect size of 0.258.10
We estimated the effect size to be 0.30 considering the similarity of the study participants and study design. To account for the dropout rate, the study oversampled by 10% and 63 participants were recruited for each group.
Given the study’s participation length of 4 weeks, the study included women who were no more than 34 weeks pregnant and who could read, understand information, and type using a smartphone. Participants whose pregnancies were terminated during the study’s participation period were excluded.
Data collection
The research team consisted of the project investigator and two research assistants majoring in nursing. A convenience sampling method was used to recruit the participants. The study was advertised on one of the biggest South Korean online communities where 3 million pregnant women and women raising children are registered and exchange information. The online advertisement included brief information about the study and a link to download the study’s application. Once the participants downloaded and opened the application, they were prompted to sign the informed consent form using their finger and were randomly allocated to either the intervention or control group through a randomization system embedded in the application. The system alternately assigned the participants to one of the groups in the order that they signed the informed consent form. The participants were blinded after the assignment. As the participants were recruited through an online advertisement, we predicted that the risk of information exchange between the intervention and control groups would be minimal.
Participants who were assigned to the intervention group were then provided with information about the study application, SPWW, and a guide on how to use it. After learning about the application, they were guided to complete the first survey and to freely use the application for 4 weeks. The SPWW application was designed to enhance pregnancy-related health practices, specifically targeted four practices: (1) sleep and rest, (2) eating, (3) physical activity, and (4) stress management. Each of the four practices was encouraged through the utilization of four components within the application: (1) eight education sessions, (2) a health log, (3) a diary, and (4) an anonymous discussion board. Since the application was developed for working pregnant women, specific directions for performing health practices at work were suggested (e.g., office exercises and smart food choices during staff meal). The estimated learning time of each session was 15 min.
Participants who were assigned to the control group were led to a new link and downloaded the application developed specifically for the control group, without informing them about being in the control group. The application layout was designed the same as the intervention group’s; however, the control group application only had surveys. Like the intervention group, the control group was asked to answer the first survey and to use the application for 4 weeks. At week 2 and 4 of each participant’s study period, the second and third survey questions became available for answering. The reason for assessing the study variables at week 2, in addition to the first (beginning of the study) and week 4 (end of the study), was to examine the gradual changes in study variables and to maintain the participants’ interest in the study.9 As a compensation, each participant received mobile gift card that worth 50 000 South Korean Won.
Instruments
The participants received a total of 22 items on sociodemographic, pregnancy-related, and work-related questions. Additionally, questions on work stress, pregnancy stress, delivery expectancy, pregnancy experience (i.e., uplifts and hassles), and health practices for healthy pregnancy were asked using questionnaires.
Work stress
The participants’ work stress was measured using the Korean Occupational Stress Scale—Short Form (KOSS-SF).16 It is a 24-item scale rated between “hardly ever = 1” and “very much = 4.” A higher score indicates higher levels of occupational stress.16 The validity of each item was highly acceptable.16 The Cronbach’s alpha of the scale ranged between .512 (occupational climate) and .822 (organizational system).16 The Cronbach’s alpha was .83 in a study that explored job stress among 424 hospital workers in South Korea.17 In this study, the KOSS-SF demonstrated a Cronbach’s alpha of .824.
Pregnancy stress
Pregnancy stress was measured using the Prenatal Distress Questionnaire (PDQ).18 The PDQ was developed to assess pregnancy-specific distress through 12 items. The questions include medical concerns, physical symptoms, relationships with others, confidence in parenting, and the health of the baby.18 Each item is scored between “not at all = 0” and “extremely = 4.” A higher score indicates a higher level of pregnancy stress. The validity of the instrument was supported.19 The Cronbach’s alpha from the article which developed the scale was .81.18 Since a Korean version of the PDQ was not available, the research team translated the scale into Korean using the forward-backward translation method with permission from the scale’s developer.20 The Cronbach’s alpha of the Korean PDQ in this study was .873.
Fear of childbirth
The participants’ fear of childbirth was assessed using the Wijma Delivery Expectancy/Experience Questionnaire (W-DEQ).21 The W-DEQ is a 33-item questionnaire scored using a 6-point Likert scale with items scored between 1 and 6. A higher score indicates a higher degree of fear of childbirth. The validity of W-DEQ was adequate.21 The Cronbach’s alpha of the W-DEQ scale was .89 in a study that explored the fear of childbirth among healthy pregnant women.22 The research team translated the scale’s questionnaire into Korean using the forward-backward translation method,20 and the Cronbach’s alpha of the Korean W-DEQ was .709 in this study.
Pregnancy experience
The participants’ pregnancy experiences were explored using the Pregnancy Experience Scale—Brief Version (PES-brief).23 The scale asks participants about 10 hassles and 10 uplifts frequently related to pregnancy. Each item is scored on a 4-point Likert scale between “not at all = 0” and “a great deal = 3.” Six scoring rubrics can be yielded from this scale: the frequency and intensity of uplifts, the frequency and intensity of hassles, and the frequency and intensity ratios.23 In this study, we used two scores: the intensity of uplifts (sum of the 10 uplifts) and the intensity of hassles (sum of the 10 hassles).23 Higher scores in the former indicate that a person is having a more positive pregnancy experience, while a higher score in the latter indicates a more negative experience. The convergent validity of this instrument was adequate.22 The Cronbach’s alpha of the PES-brief was .8223 in previous studies. The Korean version of the PES-brief was created by the research team using forward-backward translation.20 The Cronbach’s alpha of the Korean PES-brief was .759 in this study.
Health practices in pregnancy
The participants’ self-care practices related to pregnancy were assessed using the Health Practices in Pregnancy Questionnaire-II (HPQ-II).24 It is a 34-item questionnaire with response options between “never = 1” and “routinely = 4.” A higher summed score correlates with a person performing a higher frequency of health-promoting practices pertaining to their pregnancy.24 The construct validity of HPQ-II was supported.24 The Cronbach’s alpha of the scale was .81.24 A modified Korean version of the scale was used for this study,13 and the Cronbach’s alpha was .815.
Data analysis
The SPSS 25.0 statistical software package was used to analyze the study data that was extracted from the backend of SPWW application survey system. To maintain the validity of the study, participants who missed over 10% of the total questions were excluded from the study.25 The missing data from the remaining participants were assessed for missing at randomness, and all analyses were conducted without data imputation.26 The participants’ sociodemographic data were analyzed using mean, standard deviation, percentage, and an independent t-test. The effects of the study intervention were analyzed using a two-way repeated measures analysis of variance (ANOVA) and a paired t-test. The effect size estimates (d) of the intervention were calculated using the mean pre-post changes of the study variables in the intervention and control groups.27 The participants’ first (beginning of the study) and week 4 (end of the study) survey responses were imputed as the pretest and post-test scores, respectively.
RESULTS
Participants’ flow and baseline information
A total of 126 participants were recruited for the study (Figure 2). Sixty-three participants were randomly allocated to both the intervention group and the control group. Two participants from the intervention group and six participants from the control group dropped out of the study by not answering the week 2 survey questions. The data from one participant from each group were also excluded from the analysis due to missing over 10% of the week 4 survey questions. Both participants failed to complete the latter part of the survey (i.e., HPQ-II).
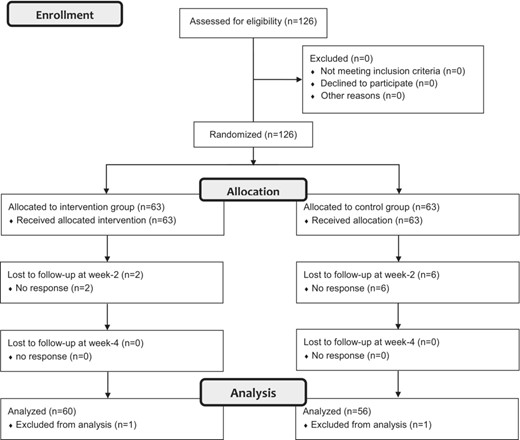
Flow diagram of the participants.
The data of 60 participants from the intervention group and 56 participants from the control group were included in the study analysis. The participants in the intervention group were significantly older than those in the control group (t = 2.586, P = .011; Table 1). In addition, there were significant differences in pregnancy stress (F = 5.376, P = .022), pregnancy uplifts (F = 7.785, P = .006), and health practices in pregnancy (F = 10.113, P = .002) between the groups (Table 2).
General characteristics of participants (N = 116).
| Intervention (N = 60) | Control (N = 56) | Total (N = 116) | |||||
|---|---|---|---|---|---|---|---|
| Characteristics | Mean ± SD or N (%) | t/χ2 | P | ||||
| Age (years old) | 32.48 ± 3.38 | 31.07 ± 2.37 | 31.80 ± 3.01 | 2.586 | .011 | ||
| Region | Seoul | 24 (20.7) | 28 (24.1) | 52 (44.8) | 1.313 | .519 | |
| Gyeonggi-do | 26 (22.4) | 19 (16.4) | 45 (38.8) | ||||
| Others | 10 (8.6) | 9 (7.8) | 19 (16.4) | ||||
| Social economic status | Good | 4 (3.4) | 2 (1.7) | 6 (5.2) | 1.778 | .411 | |
| Fair | 53 (45.7) | 48 (41.4) | 101 (87.1) | ||||
| Poor | 3 (2.6) | 6 (5.2) | 9 (7.8) | ||||
| Marriage | Married | 59 (50.9) | 55 (47.4) | 114 (98.3) | 0.002 | .961 | |
| Unmarried | 1 (0.9) | 1 (0.9) | 2 (1.7) | ||||
| Persons living together | Husband | 53 (45.7) | 49 (42.2) | 102 (87.9) | 0.330 | .848 | |
| Birth parent | 3 (2.6) | 2 (1.7) | 5 (4.3) | ||||
| Husband and Birth parent | 4 (3.4) | 5 (4.3) | 9 (7.8) | ||||
| Gestational weeks | 20.08 ± 8.44 | 20.54 ± 7.31 | 20.30 ± 7.89 | −0.308 | .759 | ||
| Pregnancy type | Natural pregnancy | 54 (46.6) | 55 (47.4) | 109 (94.0) | 4.210 | .122 | |
| Pregnancy after induction of hyperovulation | 2 (1.7) | 1 (0.9) | 3 (2.6) | ||||
| In vitro fertilization | 4 (3.4) | 0 (0.0) | 4 (3.4) | ||||
| Obstetric history | Living baby | 0 | 45 (38.8) | 43 (37.1) | 88 (75.9) | 1.910 | .385 |
| 1 | 13 (11.2) | 13 (11.2) | 26 (22.4) | ||||
| 2 | 2 (1.7) | 0 (0.0) | 2 (1.7) | ||||
| Preterm delivery | 0 | 57 (49.1) | 55 (47.4) | 112 (96.6) | 0.899 | .343 | |
| 1 | 3 (2.6) | 1 (0.9) | 4 (3.4) | ||||
| Spontaneous abortion | 0 | 52 (44.8) | 53 (45.7) | 105 (90.5) | 2.875 | .238 | |
| 1 | 6 (5.2) | 3 (2.6) | 9 (7.8) | ||||
| 2 | 2 (1.7) | 0 (0.0) | 2 (1.7) | ||||
| Artificial abortion | 0 | 57 (49.1) | 55 (47.4) | 112 (96.6) | 1.233 | .540 | |
| 1 | 2 (1.7) | 1 (0.9) | 3 (2.6) | ||||
| 2 | 1 (0.9) | 0 (0.0) | 1 (0.9) | ||||
| Menstrual health | Menarche age | 13.47 ± 3.41 | 13.57 ± 3.68 | 13.52 ± 3.53 | −0.159 | .874 | |
| Menstruation days | 6.58 ± 5.25 | 6.09 ± 4.31 | 6.34 ± 4.80 | 0.552 | .582 | ||
| Menstruation cycle | 29.90 ± 10.28 | 27.32 ± 5.25 | 28.66 ± 8.31 | 1.684 | .095 | ||
| Menstruation regularity | |||||||
| Very regular | 15 (12.9) | 15 (12.9) | 30 (25.9) | 6.903 | .075 | ||
| Regular | 35 (30.2) | 27 (23.3) | 62 (53.4) | ||||
| Irregular | 4 (3.4) | 12 (10.3) | 16 (13.8) | ||||
| Very irregular | 6 (5.2) | 2 (1.7) | 8 (6.9) | ||||
| Menstruation amount | |||||||
| Small | 8 (6.9) | 7 (6.0) | 15 (12.9) | 1.507 | .471 | ||
| Medium | 46 (39.7) | 39 (33.6) | 85 (73.3) | ||||
| Large | 6 (5.2) | 10 (8.6) | 16 (13.8) | ||||
| Work types | Healthcare worker | 4 (3.4) | 2 (1.7) | 16 (13.8) | 0.206 | .651 | |
| Educator | 7 (6.0) | 3 (2.6) | 10 (8.6) | ||||
| Office worker | 39 (33.6) | 37 (31.9) | 66 (56.9) | ||||
| Government worker | 4 (3.4) | 9 (7.8) | 13 (11.2) | ||||
| Service worker | 3 (2.6) | 1 (0.9) | 4 (3.4) | ||||
| Others | 3 (2.6) | 4 (3.4) | 7 (6.0) | ||||
| Work condition | Work experience (Months) | 72.85 ± 54.40 | 62.09 ± 46.18 | 67.66 ± 50.67 | 1.145 | .255 | |
| Weekly work hours | 41.67 ± 8.63 | 43.46 ± 8.46 | 42.53 ± 8.56 | −1.132 | .260 | ||
| Religion | Yes | 20 (17.2) | 23 (19.8) | 43 (37.1) | 0.743 | .389 | |
| No | 40 (34.5) | 33 (28.4) | 73 (62.9) | ||||
| Religion participation | Frequently | 5 (4.3) | 9 (7.8) | 14 (12.1) | 2.199 | .532 | |
| Often | 4 (3.4) | 5 (4.3) | 9 (7.8) | ||||
| Rarely | 9 (7.8) | 9 (7.8) | 18 (15.5) | ||||
| Never | 42 (36.2) | 33 (28.4) | 75 (64.7) | ||||
Repeated measures of study variables by assessment time points.
| Variables | Range | Assessment time | Exp. (N = 60) | Cont. (N = 56) | Source | F | P | d |
|---|---|---|---|---|---|---|---|---|
| Work stress | 24–96 | Preintervention | 58.62 ± 7.41 | 60.64 ± 9.38 | G | 0.822 | .366 | 0.077 |
| Week 2 | 59.92 ± 7.43 | 60.61 ± 9.70 | T | 1.268 | .283 | |||
| Week 4 | 58.92 ± 7.78 | 60.29 ± 9.69 | G × T | 1.014 | .364 | |||
| Pregnancy stress | 0–48 | Pre-intervention | 26.30 ± 9.32 | 27.34 ± 8.30 | G | 5.376 | .022 | −0.425 |
| Week 2 | 25.25 ± 9.14 | 29.36 ± 8.00 | T | 0.370 | .683 | |||
| Week 4 | 24.88 ± 9.20 | 29.70 ± 7.83 | G × T | 4.901 | .009 | |||
| Fear of childbirth | 33–198 | Preintervention | 104.82 ± 11.93 | 104.46 ± 13.48 | G | 0.145 | .704 | 0.092 |
| Week 2 | 104.25 ± 12.46 | 103.73 ± 13.31 | T | 0.423 | .648 | |||
| Week 4 | 104.47 ± 12.57 | 102.93 ± 14.68 | G × T | 0.187 | .822 | |||
| Pregnancy experience (uplifts) | 0–30 | Preintervention | 19.35 ± 4.75 | 17.96 ± 4.36 | G | 7.785 | .006 | 0.333 |
| Week 2 | 19.93 ± 5.33 | 18.11 ± 4.18 | T | 5.152 | .007 | |||
| Week 4 | 21.35 ± 5.16 | 18.43 ± 3.79 | G × T | 2.009 | .139 | |||
| Pregnancy experience (hassles) | 0–30 | Preintervention | 15.53 ± 5.83 | 15.52 ± 5.17 | G | 2.494 | .117 | −0.599 |
| Week 2 | 15.15 ± 5.53 | 15.91 ± 5.21 | T | 4.980 | .008 | |||
| Week 4 | 15.25 ± 5.73 | 18.57 ± 5.98 | G × T | 5.956 | .003 | |||
| Health practices in pregnancy | 30–150 | Preintervention | 86.92 ± 11.11 | 83.75 ± 12.99 | G | 10.113 | .002 | 0.490 |
| Week 2 | 90.38 ± 12.68 | 84.39 ± 12.52 | T | 10.313 | .000 | |||
| Week 4 | 94.82 ± 13.15 | 85.70 ± 11.40 | G × T | 3.740 | .026 |
Note: G = Group; T = Time; G × T = Group-by-time interaction effects.
Repeated measures of study variables by group and time
The results of the repeated measures ANOVA and effect size of the intervention program are shown in Table 2. There were significant group-by-time interaction effects in pregnancy stress (F = 4.901, P = .009), pregnancy hassles (F = 5.956, P = .003), and health practices in pregnancy (F = 3.740, P = .026). A small-to-medium effect size was found for pregnancy stress (d = −0.425), pregnancy uplifts (d = 0.333), pregnancy hassles (d = −0.599), and health practices in pregnancy (d = 0.490).
Differences in study variables by group and time
The differences in study variables by assessment time points in each group are described in Table 3. In the intervention group, the intensity of participants’ pregnancy uplifts and health practices in pregnancy significantly increased between preintervention and week 4 (P < .001). The intensity of participants’ pregnancy uplifts significantly increased between week 2 (19.93 ± 5.33) and week 4 (21.35 ± 5.16) (t = −2.887, P = .005). Also, the participants stated performing more pregnancy-related health practices between week 2 (90.38 ± 12.68) and week 4 (94.82 ± 13.15) (t = −2.414, P = .019).
Differences in study variables by groups and assessment time points.
| Preintervention vs. week 2 | Week 2 vs. week 4 | Preintervention vs. week 4 | ||||||||
|---|---|---|---|---|---|---|---|---|---|---|
| Groups | Variables | Differences | t | P | Differences | t | P | Differences | t | P |
| Intervention | Work stress | 1.30 | −2.002 | .050 | −1.00 | 1.550 | .127 | 0.30 | −0.400 | .691 |
| Pregnancy stress | −1.05 | 1.328 | .189 | −0.37 | 0.401 | .690 | −1.42 | 1.358 | .180 | |
| Fear of childbirth | −0.57 | 0.330 | .743 | 0.22 | −0.147 | .884 | −0.35 | 0.196 | .845 | |
| Pregnancy experience (uplifts) | 0.58 | −0.953 | .345 | 1.42 | −2.887 | .005 | 4.42 | −6.895 | <.001 | |
| Pregnancy experience (hassles) | −0.38 | 0.495 | .622 | 0.10 | −0.152 | .880 | −0.28 | 0.402 | .689 | |
| Health practices in pregnancy | 3.47 | −1.789 | .079 | 4.43 | −2.414 | .019 | 7.90 | −4.946 | <.001 | |
| Control | Work stress | −0.04 | 0.054 | .957 | −0.32 | 0.604 | .548 | −0.36 | 0.506 | .615 |
| Pregnancy stress | 2.02 | −2.100 | .040 | 0.34 | −0.452 | .653 | 4.95 | −6.128 | <.001 | |
| Fear of childbirth | −0.73 | 0.540 | .591 | −0.80 | 0.702 | .486 | −1.54 | 1.271 | .209 | |
| Pregnancy experience (uplifts) | 0.14 | −0.236 | .814 | 0.32 | −0.630 | .531 | 0.46 | −1.117 | .269 | |
| Pregnancy experience (hassles) | 0.39 | −0.612 | .543 | 2.66 | −4.316 | .000 | 5.64 | −7.901 | <.001 | |
| Health practices in pregnancy | 0.64 | −0.520 | .605 | 1.30 | −1.467 | .148 | 1.25 | −0.914 | .365 | |
Note: The differences were calculated by subtracting later week’s values from recent week’s values (i.e., Work stress differences = Work stress at week 2 – Work stress at preintervention).
In the control group, pregnancy stress and intensity of the participants’ pregnancy hassles significantly increased between preintervention and week 4 (P < .001). The pregnancy stress significantly increased between preintervention (27.34 ± 8.30) and week 2 (29.36 ± 8.00) (t = −2.100, P = 0.040). The intensity of the participants’ pregnancy hassles significantly increased between week 2 (15.91 ± 5.21) and week 4 (18.57 ± 5.98) (t = −4.316, P < .001).
Intervention usage
Within the intervention group, the average number of views of each of the eight educational sessions ranged between 1.00 and 2.88 times per participant. The mean number of views for each session was 1.27. The most frequently viewed sessions were “Labor pain management” and “Sleep and rest during pregnancy.” The least frequently viewed sessions were “Stages 3 and 4 of labor” and “Stress management during pregnancy.” The participants set their alarms to perform self-care practices every 2–6 h, with the average being 4.71 h. The most successful areas of their self-care performance were “Sleep and rest” and “Eating,” while the least successful area was “Stress management.” No harms or unintended effects were reported in the intervention and control groups.
DISCUSSION
This study was done to evaluate the effectiveness of the mobile-based intervention SPWW in enhancing the prenatal health practices of working pregnant women in South Korea. The majority of the participants were office workers with an average work experience of over 5 years, and they each worked approximately 43 h a week. Considering the statutory number of weekly working hours in South Korea is 40,28 these women were working overtime while pregnant. In South Korea, pregnant women can request flexible working hours and can shorten the length of their working day by a maximum of two working hours during the first 12 weeks of pregnancy.28 Their overtime work is limited and working the night shift or on a holiday without prior agreement is prohibited.28 However, it is possible that the rights of many of the participating pregnant women were not always ensured at their workplaces.
During the study period, pregnancy stress was significantly different between the groups. Specifically, in the control group, pregnancy stress was significantly higher at week 2 than during the first survey. Pregnant women’s stress may increase with the continuation of the pregnancy.29 They may experience more physical discomfort or additional psychosocial burdens related to becoming a mother. The use of the SPWW application may have contributed to lowering pregnancy stress by providing information and supporting prenatal health practices. Moreover, knowing how to take care of oneself and the fetus might have increased the sense of control that can contribute to lowering stress.30
The pregnancy hassles were significantly different between assessment time points, and they had a group-by-time interaction effect. In the control group, participants reported having more hassles at week 4 than at week 2. They reported more concerns and feelings of unhappiness about various changes pertaining to their pregnancy. Many pregnant women experience more concerns and anxiety as their delivery date approaches. Pregnant women in their third trimester of pregnancy have increased anxiety.31 Our findings may reflect this anxiety.
The health practices in pregnancy were significantly different between the groups and the assessment time points. There were also group-by-time interaction effects. Moreover, the medium effect size of the intervention was noted in health practices in pregnancy. The participants in the intervention group reported an increase in pregnancy-related health practices. The main purpose of the SPWW application was to enhance the health practices of pregnant women. The findings support that the study program, which included education, alarms, and logs to perform health practices, was effective. This finding is consistent with previous studies, which reported the effectiveness of a mobile application that was developed for gestational diabetes self-monitoring and management.32
The participants in the intervention group were most interested in learning about sleep and rest during pregnancy. Additionally, resting regularly was the practice that the participants tried to perform the most upon receiving the application’s push alarm. This finding reflects the need for more plentiful sleep and rest for pregnant working women. Sleep loss was one of the main problems for pregnant women as they reported not having enough time and place to rest.33 On the contrary, the participants were least interested in learning about stress management during pregnancy. Simultaneously, stress management was the practice that the participants performed least. This finding is somewhat different from the previous studies that focused on stress management interventions for pregnant women. It is possible that the participants thought that the stress of being pregnant in the workplace is inevitable.34 Alternatively, they may have already known a lot about stress management and preferred to learn about and try other health practices.
Study limitations
There are several limitations in this study to consider. First, although we allocated the participants using randomization, the intervention group were 1.41 years older on average than the control group. The age difference was somewhat minimal; however, the heterogeneity in age needs to be considered. For example, the age differences could have affected the baseline differences in uplifts and stress between the two groups.
Second, compared with the intervention group, more participants in the control group dropped out from the study during the first 2 weeks of the intervention. The participants in the control group might have felt no value in participating in the study as their mobile application only had information about the study and survey questionnaires. In addition, the length of the survey questionnaires could be another factor related to the participants’ dropout. Data from two participants who did not answer the latter part of the survey were excluded from the study. Although each of the three surveys was designed to take less than 10 min to complete, answering a survey using a small smartphone display could have caused a burden on the respondents.35 Several strategies could help to prevent participant dropout, such as showing a progress bar or save-and-continue functions.35
Third, the study is limited because of its reliance on the participants’ responses. The participants were asked to recall their performance of health practices and reply through survey questions. Technology such as a smart watch used to examine the participants’ actual health practices would have increased the program’s reliability and validity.
Fourth, there is a possibility of memory effects as the participants responded to the same questionnaires, repeatedly. For example, regarding the scale used to explore the health practices in pregnancy, the participants in the control group could have learned the preferable behaviors while answering the questionnaires. Prolonging the interval between data collection points or randomizing the order of the questionnaires could have helped to minimize this risk.36
Fifth, the generalizability of the study is limited. All of the study participants were Korean pregnant women. The pregnancy experience can differ widely by different cultures. Moreover, the working conditions and social atmosphere is different by countries and regions. Although some of the traits of the study participants, including age and occupation, were similar to the data from South Korean Social Statistics Bureau, the generalizability of the study results is still limited.37 For example, as the study was advertised online and conducted using the smartphone, there may be sampling bias or volunteer bias.38 Moreover, the study’s participation criterion for the gestation (i.e., no more than 34 weeks) was somewhat broad. Considering that anxiety, stress, and the burden of pregnant women may vary according to their trimester/gestational weeks,31 this criterion may have influenced the result. In addition, the sample size calculation was not accurate, as we could find no other studies that used the same instruments and a mobile intervention study design. This limited generalizability of the study needs to be considered when applying the study findings or intervention application.
CONCLUSION
This is the first study to propose and evaluate the effectiveness of implementing a mobile application for prenatal care specifically for pregnant women in the workplace. The SPWW mobile application was effective in enhancing pregnancy stress, pregnancy hassles, and health practices in pregnancy.
Practice implications
Based on the study’s findings, we believe there are several implications for healthcare practices. First, more prenatal education that covers various pregnancy topics is necessary. Many of the prenatal interventions in South Korea are focused on the improvement of psychological health, such as the reduction of stress.39 However, participants in this study were least interested in stress management and were most interested in labor pain management and in getting enough rest and sleep. Actual need assessments can be helpful to explore the actual interests and health needs of the pregnant women.
Second, various educational methods should be considered for pregnant women, especially for those with limited access to offline education sessions. The application usage showed that the participants had no difficulties in using a mobile application for accessing educational content and for tracking their health practices. This can be one alternative to offline education.
Third, comprehensive intervention needs to be considered for improving pregnant women’s health practices. Comprehensive intervention was effective in previous studies that aimed to improve pregnant women’s depressive symptoms.40 The SPWW application had four components: education sessions, a health log, a diary, and an anonymous discussion board. Although this study did not examine which component was most helpful and influential in improving health practices, this comprehensive intervention was effective in improving pregnancy uplifts and health practices.
Fourth, more supports are necessary for pregnant women in the workplace. The participants in this study were working over 42 h on average, which is longer than the statutory working hours in South Korea. Moreover, among all the topics covered in the study intervention, they were most interested in sleep and rest during pregnancy. In addition to adequate intervention to improve pregnant women’s health, sufficient support from government policy and from the workplace would synergize effects. We expect this study to provide basic data and evidence for developing prenatal interventions and to contribute to better health for pregnant women at work.
AUTHOR CONTRIBUTIONS
YL conceived the ideas; YL and SC collected the data; YL and SK analyzed the data; and YL and SK lead the writing. All authors read and approved the final manuscript.
ACKNOWLEDGMENTS
We would like to thank D. Yoo from technology team for his continuous support in mobile application maintenance.
FUNDING INFORMATION
This research was funded by the National Research Foundation of Korea in 2019–2020 (# 2017R1C1B5075221). The funding body plays no role in the design of the study, data collection, analysis, interpretation, and writing of the manuscript.
CONFLICT OF INTEREST STATEMENT
The author reports no conflicts of interest in this work.
DATA AVAILABILITY STATEMENT
The data that support the findings of this study are available from the corresponding author upon reasonable request.
DISCLOSURE
Approval of the Research Protocol: Approval for the study was received from the Institutional Review Board of the institute where the project investigator was affiliated (# 1041078-201910-HRSB-315-01). Informed Consent: All the participants signed the informed consent prior to their participation in the study. Registry and the Registration No. of the Study/Trial: KCT0007805. Animal Studies: N/A.
