


Abstract
Disparities in cardiovascular disease mortality among breast cancer survivors are documented, but geographic factors by county-level socioeconomic status (SES) and rurality are not well described.
We analyzed 724 518 women diagnosed with localized or regional stage breast cancer between 2000 and 2017 within Surveillance, Epidemiology, and End Results Program-18 with follow-up until 2018. We calculated relative risks (RRs) of cardiovascular disease mortality using Poisson regression, accounting for age- and race-specific rates in the general population, according to county-level quintiles of SES (measured by Yost index), median income, and rurality at breast cancer diagnosis. We also calculated 10-year cumulative mortality risk of cardiovascular disease accounting for competing risks.
Cardiovascular disease mortality was 41% higher among breast cancer survivors living in the lowest SES (RR = 1.41, 95% confidence interval [CI] = 1.36 to 1.46, Ptrend < .001) and poorest (RR = 1.41, 95% CI = 1.36 to 1.47, Ptrend < .001) counties compared with the highest SES and wealthiest counties, and 24% higher for most rural relative to most urban counties (RR = 1.24, 95% CI = 1.17 to 1.30, Ptrend < .001). Disparities for the lowest SES relative to highest SES counties were greatest among younger women aged 18-49 years (RR = 2.32, 95% CI = 1.90 to 2.83) and aged 50-59 years (RR = 2.01, 95% CI = 1.77 to 2.28) and within the first 5 years of breast cancer diagnosis (RR = 1.53, 95% CI = 1.44 to 1.64). In absolute terms, however, disparities were widest for women aged 60+ years, with approximately 2% higher 10-year cumulative cardiovascular disease mortality risk in the poorest compared with wealthiest counties.
Geographic factors at breast cancer diagnosis were associated with increased cardiovascular disease mortality risk. Studies with individual- and county-level information are needed to inform public health interventions and reduce disparities among breast cancer survivors.
Cardiovascular disease is the leading cause of death in all women in the United States (1) and exceeds breast cancer deaths among older breast cancer survivors (2,3). Increased cardiovascular disease risk in breast cancer survivors is partially attributable to cardiotoxic cancer treatment such as chemotherapy, radiotherapy, and endocrine therapy (4,5) and is elevated for many years after diagnosis (6,7). Differences in cardiovascular disease outcomes by race and ethnicity among breast cancer survivors have been reported (8-12); however, race and ethnicity is considered to be a social construct associated with socioeconomic status (SES) and environmental exposures resulting from structural racism (13). Thus, where a patient lives at the time of their breast cancer diagnosis, captured by county-level SES and rurality, may also influence cardiovascular disease mortality outcomes independent of race and ethnicity.
Resources and access to health care can potentially cause disparities in cardiovascular disease mortality in breast cancer survivors given that cardio-oncology is a highly specialized clinical area and cardio-oncology clinics are largely based in urban, academic centers (10). However, few studies have examined geographic disparities in cardiovascular mortality among breast cancer survivors by county-level factors (12) such as SES and rurality. Thus, the aim of this study was to compare the risk of cardiovascular disease mortality by county-level SES factors and the degree of rurality among US breast cancer survivors using data from the Surveillance, Epidemiology, and End Results (SEER) Program 18 Registries.
Methods
Study population
We included population-based data on women with breast cancer from the 18 SEER cancer registry areas. SEER-18 is nationally representative, includes approximately 28% of the US population, and leverages cancer registry data to characterize cancer incidence, treatment, and survival. We identified women diagnosed with first, primary localized or regional stage breast cancer diagnosed between ages 18 and 84 years who survived 12 months or longer and received surgery. The analytic cohort included 724 518 breast cancer survivors diagnosed between January 1, 2000, to December 31, 2017, with follow-up until December 31, 2018. Causes of death were ascertained from death certificates from the US Mortality Data, maintained by the National Center for Health Statistics of the Centers for Disease Control and Prevention. Data on race and ethnicity were abstracted from medical records or death certificates. This research was exempt from institutional review board review by the National Institutes of Health Office of Human Subjects Research based on the usage of deidentified existing data.
Outcome
Our outcome of interest was cardiovascular disease mortality defined using SEER categorized International Classification of Diseases-10 codes: Diseases of the heart: I00-I09, I11, I13, I20-I51; Hypertension without heart disease: I10, I12; Cerebrovascular disease: I60-I69; Atherosclerosis: I70, Aortic aneurysm and dissection: I71; and Other Diseases of Arteries, Arterioles, Capillaries: I72-I78 (14).
County attributes
We assessed geographic factors using 3 macro-level county attributes ascertained from the US Census and the American Community Survey (ACS): 1) SES [measured using the Yost index (15), which is a composite score of SES based on 7 census variables: median household income, median house value, median rent, percent below 150% of poverty line, education index (16), percent working class, and percent unemployed]; 2) median income (household income from the past 12 months, measured in 2019 inflation-adjusted US dollars [$]); and 3) rurality (categorized into 5 groups based on Rural–Urban Continuum codes developed by the US Department of Agriculture). We classified SES and median income into quintiles based on the US female general population distribution across counties. County attributes were time dependent and matched between the year of breast cancer diagnosis or death in the general population to the closest year of the US Census or ACS. Rural-Urban Continuum codes were available from the US Census 2003 and 2013, and SES (Yost Index) and median income were available from the US Census 2000 or the annual ACS from 2006 to 2019.
Statistical analyses
We calculated standardized mortality ratios (SMRs; observed over expected) and corresponding 95% confidence intervals (CIs) comparing the risk of cardiovascular disease deaths among breast cancer survivors (observed) with the cardiovascular disease deaths in the US general female population (expected), matched by age, race (Black, White, other [Asian or Pacific Islander; American Indian or Alaska Native]), and calendar year. To quantify the relative disparity of cardiovascular disease mortality among breast cancer survivors, we conducted multivariable Poisson regression models to estimate the relative risk (RR) of cardiovascular disease mortality, with the log-transformed expected number of cardiovascular disease deaths used as the offset. Relative risks were used to compare the quintiles of county SES and median income with the highest SES or wealthiest quintile (referent groups) and the rurality categories with the most urban counties (referent group). Models were adjusted for age at breast cancer diagnosis (5-year categories), stage of breast cancer (localized, regional), and year of breast cancer diagnosis (2000-2004, 2005-2009, 2010-2017). Using the relative risk as a ratio of SMRs provides estimates that account for the background age- and race-specific cardiovascular disease mortality rates in the general population. Further, we assessed trends in county SES and median income (by including quintiles as ordinal variables) and tested for heterogeneity by rurality via likelihood ratio tests. We examined SMRs and relative risks by strata of stage (localized, regional), age at breast cancer diagnosis (18-49 years, 50-59 years, 60-69 years, 70+ years), and latency (time since diagnosis; 1-4 years, 5-9 years, 10+ years).
To quantify the absolute risk of cardiovascular disease mortality among breast cancer survivors, we calculated 10-year cumulative cardiovascular disease mortality estimates by quintiles of median income and categories of rurality, accounting for competing risks (ie, noncardiovascular disease deaths) using the stcompet package in Stata (17). We were unable to calculate cumulative mortality estimates by SES using the Yost Index due to SEER data restrictions related to confidentiality. Women were followed up beginning 1 year after first primary breast cancer diagnosis until date of last contact, death, or end of study period (December 31, 2018), whichever came first. Analyses were performed using SEER*Stat version 8.3.9.2 and Stata version 17 (StataCorp, College Station, TX). All statistical tests were 2-sided with statistical significance set at P less than .05.
Results
Overall
Between 2001 and 2018, 30 004 (4.1%) of the 724 518 breast cancer survivors died of cardiovascular disease (median follow-up = 7.5 years, range = 1-18.96 years) (Table 1). The study population included Hispanic or Latina women (10.40%); non-Hispanic American Indian or Alaska Native women (0.41%); non-Hispanic Asian American, Native Hawaiian, or other Pacific Islander women (8.17%); non-Hispanic Black women (10.19%); and non-Hispanic White women (70.83%). Nearly one-half were diagnosed with breast cancer in the most recent years (46.37% in 2010-2017) and most with localized stage (66.93%), estrogen receptor–positive (76.50%), and progesterone receptor–positive (65.80%) breast cancers.
Descriptive characteristics of 724 518 women diagnosed with first primary breast cancer in 18 SEER registries from 2000 to 2017 and followed through 2018
| Characteristic | No. (%) |
|---|---|
| Age, y | |
| 18-49 | 181 149 (25.00) |
| 50-59 | 191 228 (26.39) |
| 60-69 | 186 432 (25.73) |
| 70-84 | 165 709 (22.87) |
| Stagea | |
| Localized | 484 901 (66.93) |
| Regional | 239 617 (33.07) |
| Race and ethnicity | |
| Hispanic or Latina | 75 375 (10.40) |
| Non-Hispanic American Indian or Alaska Native | 2989 (0.41) |
| Non-Hispanic Asian American, Native Hawaiian, or other Pacific Islander | 59 211 (8.17) |
| Non-Hispanic Black | 73 800 (10.19) |
| Non-Hispanic White | 513 143 (70.83) |
| Calendar year of breast cancer diagnosis | |
| 2000-2004 | 193 041 (26.64) |
| 2005-2009 | 195 492 (26.98) |
| 2010-2017 | 335 985 (46.37) |
| Latency (time since breast cancer diagnosis to end of follow-up), y | |
| 1-4 | 237 911 (32.84) |
| 5-9 | 229 828 (31.72) |
| 10+ | 256 779 (35.44) |
| Breast cancer laterality | |
| Left | 357 571 (49.35) |
| Right | 366 720 (50.62) |
| Unknown | 227 (<1.00) |
| ER status | |
| ER+ | 554 234 (76.50) |
| ER− | 127 413 (17.59) |
| Unknown/unavailable | 42 871 (5.91) |
| PR status | |
| PR+ | 476 709 (65.80) |
| PR− | 197 298 (27.23) |
| Unknown/unavailable | 50 511 (6.97) |
| HER2 Statusb | |
| HER2+ | 48 088 (14.31) |
| HER2− | 269 713 (80.28) |
| Unknown | 18 184 (5.41) |
| Initial treatment receipt | |
| Surgery only | 200 178 (27.63) |
| Chemotherapy + surgery | 122 591 (16.92) |
| Chemotherapy, radiotherapy, + surgery | 188 844 (26.06) |
| Radiotherapy + surgery | 212 905 (29.39) |
Stage defined using SEER Summary Stage 2000 (based on the Collaborative Stage for 2004+ and converted from Extent of Disease before 2004). ER = estrogen receptor; PR = progesterone receptor; SEER = Surveillance, Epidemiology, and End Results Program.
Restricted to patients diagnosed from 2010 to 2017 (N = 335 985).
Overall, breast cancer survivors living in the lowest SES counties had a 41% higher risk of cardiovascular disease mortality (RR = 1.41, 95% CI = 1.36 to 1.46) relative to the highest SES counties, which was similar for the poorest compared with wealthiest counties (defined by median income) (RR = 1.41, 95% CI = 1.36 to 1.47) (Table 2). For each quintile, we observed an increasing cardiovascular disease mortality trend with worsening SES (Ptrend < .001) and decreasing median income (Ptrend < .001). Disparities were smaller by degree of rurality; women living in the most rural counties had a 24% increased risk of cardiovascular disease mortality compared with those in the most urban counties (RR = 1.24, 95% CI = 1.17 to 1.30), and statistically significant heterogeneity was observed across categories of rurality (Pheterogeneity < .001).
Standardized mortalitity ratios (SMRs) and relative risks (RRs) of cardiovascular disease mortality according to county-level quintiles of socioeconomic status (SES) and median income and degree of rurality
| County attribute | Observed | Expected | SMR (95% CI) | RRa (95% CI) | Pb |
|---|---|---|---|---|---|
| SES (Yost Index) | <.001 | ||||
| −1.846 to 0.473 (lowest SES) | 6500 | 6318 | 1.03 (1.00 to 1.05) | 1.41 (1.36 to 1.46) | |
| 0.474 to 1.026 | 4611 | 5176 | 0.89 (0.87 to 0.92) | 1.24 (1.19 to 1.29) | |
| 1.027 to 1.371 | 6878 | 7789 | 0.88 (0.86 to 0.90) | 1.19 (1.15 to 1.24) | |
| 1.372 to 1.602 | 6146 | 7746 | 0.79 (0.77 to 0.81) | 1.08 (1.04 to 1.12) | |
| 1.603 to 1.829 (highest SES) | 5869 | 7981 | 0.74 (0.72 to 0.75) | Referent | |
| Median income, $ | <.001 | ||||
| <50 000 | 4121 | 3952 | 1.04 (1.01 to 1.08) | 1.41 (1.36 to 1.47) | |
| 50 000 to 59 999 | 4418 | 4769 | 0.93 (0.90 to 0.95) | 1.25 (1.20 to 1.29) | |
| 60 000 to 69 999 | 9428 | 10 511 | 0.90 (0.88 to 0.92) | 1.20 (1.16 to 1.23) | |
| 70 000 to 74 999 | 3043 | 3874 | 0.79 (0.76 to 0.81) | 1.04 (1.00 to 1.08) | |
| ≥75 000 | 8994 | 11 903 | 0.76 (0.74 to 0.77) | Referent | |
| Rurality, people | <.001 | ||||
| Nonmetropolitan, not adjacent to metropolitan | 1584 | 1565 | 1.01 (0.96 to 1.06) | 1.24 (1.17 to 1.30) | |
| Nonmetropolitan, adjacent to metropolitan | 2382 | 2444 | 0.97 (0.94 to 1.01) | 1.18 (1.13 to 1.23) | |
| Metropolitan, <250 000 | 2617 | 2876 | 0.91 (0.88 to 0.95) | 1.10 (1.06 to 1.15) | |
| Metropolitan, 250 000 to 1 million | 5818 | 6732 | 0.86 (0.84 to 0.89) | 1.06 (1.03 to 1.09) | |
| Metropolitan, >1 million | 17 603 | 21 391 | 0.82 (0.81 to 0.84) | Referent |
Relative risks were calculated as the ratio of SMRs using Poisson regression adjusting for age at and year of breast cancer diagnosis and stage. CI = confidence interval.
P indicates Ptrend for Yost Index and median income, and Pheterogeneity for rural.
By stage
Disparities in cardiovascular disease mortality persisted across stage of breast cancer diagnosis, with similar patterns comparing the lowest SES counties to the highest SES counties for localized (RR = 1.40, 95% CI = 1.34 to 1.46) and regional stage cancers (RR = 1.44, 95% CI = 1.35 to 1.54) (Supplementary Table 1, available online). Results were broadly similar by stage for the poorest relative to the wealthiest counties (localized stage RR = 1.40, 95% CI = 1.34 to 1.46; regional stage RR = 1.45, 95% CI = 1.36 to 1.55) and attenuated for most rural relative to most urban counties (24% increased risk for localized and regional).
By latency
Disparities were greatest within the first 5 years of breast cancer diagnosis, with a 53% higher cardiovascular disease mortality in the lowest SES counties relative to the highest SES (RR = 1.53, 95% CI = 1.44 to 1.64), the magnitude of which was attenuated after 5-9 years (RR = 1.39, 95% CI = 1.31 to 1.47) and 10+ years (RR = 1.36, 95% CI = 1.28 to 1.45) after breast cancer diagnosis (Figure 1; Supplementary Table 2, available online). For rurality, disparities also persisted over time with a 31% increased cardiovascular disease mortality for the most rural compared with most urban counties in the first 5 years (RR = 1.31, 95% CI = 1.20 to 1.43).
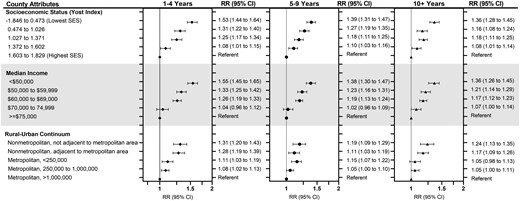
Relative risks (RR) and 95% confidence intervals (CIs) of cardiovascular disease mortality among 724 518 women diagnosed with first primary breast cancer in 18 SEER registries from 2000 to 2017 and followed through 2018, according to county-level quintiles of socioeconomic status (SES) and median income and degree of rurality and stratified by years after breast cancer diagnosis (latency period). Relative risks were calculated as the ratio of standardized mortality ratios using Poisson regression adjusting for age and year at breast cancer diagnosis and stage of breast cancer. Error bars represent 95% confidence intervals.
By age at breast cancer diagnosis
The widest disparities in relative risk of cardiovascular disease mortality were observed according to age at breast cancer diagnosis (Figure 2; Supplementary Table 3, available online). The youngest breast cancer survivors (aged 18-49 years at diagnosis) experienced the greatest disparities, with 2.3 times higher cardiovascular disease mortality for those living in the lowest SES relative to the highest SES counties (RR = 2.32, 95% CI = 1.90 to 2.83). The SES disparities remained statistically significantly elevated but gradually narrowed by age at diagnosis: aged 50-59 years (RR = 2.01, 95% CI = 1.77 to 2.28); aged 60-69 years (RR = 1.65, 95% CI = 1.53 to 1.79), and aged 70+ years (RR = 1.26, 95% CI = 1.21 to 1.32). Patterns of attenuating risks with older age were also consistent for median income and rurality.
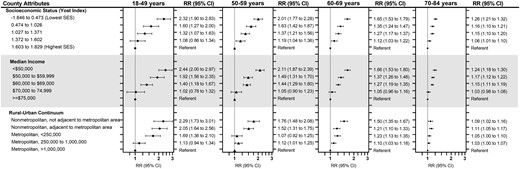
Relative risk (RR) and 95% confidence intervals (CIs) of cardiovascular disease mortality among 724 518 women diagnosed with first primary breast cancer in 18 SEER registries from 2000 to 2017 and followed through 2018, according to county-level quintiles of socioeconomic status (SES) and median income and degree of rurality and stratified by age at breast cancer diagnosis. Relative risks were calculated as the ratio of standardized mortality ratios using Poisson regression adjusting for age and year at breast cancer diagnosis and stage of breast cancer. Error bars represent 95% confidence intervals.
Cumulative cardiovascular disease mortality by age at breast cancer diagnosis
Disparities in the absolute risk of 10-year cumulative cardiovascular disease mortality estimates existed by degree of rurality and were even larger by quintiles of median income and increased with older age at breast cancer diagnosis (Table 3). Among the youngest age group (18-49 years), the poorest counties had a 10-year cumulative cardiovascular disease mortality of 0.89% (95% CI = 0.74 to 1.07) compared with 0.33% in the wealthiest counties (95% CI = 0.28 to 0.39), which was higher for aged 50-59 years (1.94% [95% CI = 1.73% to 2.17%] vs 0.82% [95% CI = 0.74% to 0.90%]). This difference was approximately 2% higher among breast cancer survivors aged 60+ years for poorest vs wealthiest counties: for aged 60-69 years (4.56% [95% CI = 4.22% to 4.92%] vs 2.42% [95% CI = 2.27% to 2.59%]) and aged 70-84 years (13.35% [95% CI = 12.78% to 13.93%] vs 11.50% [95% CI = 11.17% to 11.84%]). Disparities in cumulative cardiovascular disease mortality by rurality were smaller for all age groups: aged 18-49 years, (0.77%, 95% CI = 0.54% to 1.08%) for most rural counties compared with most urban (0.40%, 95% CI = 0.36% to 0.44%), aged 50-59 years (1.94% [95% CI = 1.59% to 2.33%] vs 1.08% [95% CI = 1.01% to 1.15%]), aged 60-69 years (3.93% [95% CI = 3.43% to 4.48%] vs 2.86% [95% CI = 2.74% to 2.98%]), and aged 70-84 years (12.87% [95% CI = 11.99% to 13.78%] vs 12.35% [95% CI = 12.10% to 12.60%]).
Cumulative Mortality (CM) of cardiovascular disease according to county-level median income and degree of rurality and stratified by age at breast cancer diagnosis
| County attribute | Age at breast cancer diagnosis, y | |||
|---|---|---|---|---|
| 18-49 (n = 181 149) | 50-59 (n = 191 228) | 60-69 (n = 186-432) | 70-84 (n = 165-709) | |
| 10-year CM (95% CI), % | 10-year CM (95% CI), % | 10-year CM (95% CI), % | 10-year CM (95% CI), % | |
| Median income, $ | ||||
| <50 000 | 0.89 (0.74 to 1.07) | 1.94 (1.73 to 2.17) | 4.56 (4.22 to 4.92) | 13.35 (12.78 to 13.93) |
| 50 000 to 59 999 | 0.60 (0.48 to 0.73) | 1.37 (1.21 to 1.56) | 3.55 (3.27 to 3.85) | 12.99 (12.47 to 13.52) |
| 60 000 to 69 999 | 0.42 (0.36 to 0.49) | 1.27 (1.16 to 1.39) | 3.19 (3.01 to 3.38) | 13.11 (12.75 to 13.48) |
| 70 000 to 74 999 | 0.33 (0.24 to 0.43) | 0.87 (0.72 to 1.04) | 2.65 (2.37 to 2.96) | 11.93 (11.36 to 12.52) |
| ≥75 000 | 0.33 (0.28 to 0.39) | 0.82 (0.74 to 0.90) | 2.42 (2.27 to 2.59) | 11.50 (11.17 to 11.84) |
| Rural-urban continuum | ||||
| Nonmetropolitan, not adjacent to metropolitan | 0.77 (0.54 to 1.08) | 1.94 (1.59 to 2.33) | 3.93 (3.43 to 4.48) | 12.87 (11.99 to 13.78) |
| Nonmetropolitan, adjacent to metropolitan | 0.82 (0.63 to 1.06) | 1.45 (1.21 to 1.73) | 3.71 (3.31 to 4.13) | 12.96 (12.24 to 13.70) |
| Metropolitan, <250 000 | 0.62 (0.47 to 0.80) | 1.22 (1.02 to 1.46) | 3.91 (3.52 to 4.32) | 12.96 (12.28 to 13.66) |
| Metropolitan, 250 000 to 1 million | 0.40 (0.32 to 0.48) | 1.16 (1.03 to 1.30) | 3.12 (2.90 to 3.36) | 12.38 (11.95 to 12.83) |
| Metropolitan, >1 million | 0.40 (0.36 to 0.44) | 1.08 (1.01 to 1.15) | 2.86 (2.74 to 2.98) | 12.35 (12.10 to 12.60) |
Discussion
Our study provided novel findings on the higher risk of cardiovascular disease mortality for breast cancer survivors living in lower SES, poorer, and more rural counties in the United States after accounting for age- and race-specific cardiovascular disease mortality risk in the general population. The relative differences in cardiovascular disease mortality were observed across all age groups yet were greatest for the breast cancer survivors diagnosed before age 60 years and within the first 5 years. Twofold higher risks were observed in the lowest SES, poorest, and rural counties among most patients diagnosed before age 60 years, with the widest disparities observed among those younger than 50. The absolute disparities in cardiovascular disease mortality were greatest in older breast cancer survivors, with a 2% higher 10-year cumulative cardiovascular disease mortality in the poorest counties compared with the wealthiest counties for women diagnosed after age 60 years compared with less than 0.6% higher absolute risk before age 50 years.
To our knowledge, no study has examined the effect of county-level SES or income on cardiovascular disease mortality among US breast cancer survivors. One previous SEER study examined the effects of rurality and found that breast cancer survivors living in rural counties had a higher cardiovascular disease mortality risk compared with urban counties after adjusting for race and ethnicity and other characteristics, with a similar magnitude to our findings (12). However, our study expanded beyond using a dichotomous urban–rural classification, demonstrating trends across 5 rural–urban categories and revealing a monotonic increase in risk for cardiovascular disease mortality with each category of higher rurality.
Elevated cardiovascular disease mortality in breast cancer survivors is associated with systemic treatment, such as anthracycline-based chemotherapy (18-20), trastuzumab targeted therapy (18,19,21,22), and aromatase inhibitors (23-25), and chest radiation, especially to the left breast (26,27). As a result, clinical guidelines were developed for cardiovascular screening and monitoring before, during, and 1-2 years after receipt of cardiotoxic cancer treatment (4,5,28). However, patients in the lower SES counties may have less medical surveillance after breast cancer diagnosis and poorer health-care access (29), contributing to disparities in health outcomes, including higher cardiovascular disease mortality relative to higher SES counties and relative to the general population. Further, rural patients have limited access to health care and specialty providers compared with urban counties, largely due to longer driving distances (30,31). Treatment for breast cancer in high-volume or academic research centers are associated with better outcomes regardless of stage (32), and these factors likely contributed to the observed disparities in cardiovascular disease mortality because specialty providers [eg, cardiologists, cardio-oncologists (33)] are generally concentrated in large academic centers, urban areas, and affluent neighborhoods. Cancer care established in higher resourced health systems may be easier to navigate for referrals to cardiovascular or cardio-oncology care teams. Therefore, timely survivorship education and management of treatment-related cardiovascular disease and implementation of recommended screening, especially for younger patients and within the first years of breast cancer diagnosis, is crucial. In contrast, the smaller relative disparities observed for older breast cancer survivors could be related to Medicare access because insurance coverage may mitigate health-care access barriers to cardiovascular management among breast cancer survivors and lead to improved outcomes (29).
Disparities in breast cancer treatment could also contribute to disparities in cardiovascular disease mortality by SES and rurality among breast cancer survivors, especially among younger patients. Selection of treatment depends on various factors (eg, stage, age at diagnosis, breast cancer subtype) as recommended by clinical practice guidelines (34). Patients with lower SES are less likely to receive guideline-concordant care (35), potentially resulting in unnecessary treatment that increases risk of cardiovascular disease. Access to breast cancer treatment may also affect cardiovascular disease mortality; for example, increased use of precision medicine (such as advanced radiation therapy to reduce cardiac damage) may widen disparities due to increased costs (29,36-38). These disparities by SES and rurality may be heightened for breast cancer survivors compared with the general population due to these complex survivorship needs. A previous study demonstrated smaller disparities in cardiovascular disease mortality for women in the general population by education level and rurality (39). Although cardiovascular risk factors may be more prevalent in lower SES counties, we controlled, at least in part, for these population-level differences in our SMR approach by accounting for background age- and race-specific cardiovascular disease mortality rates in the general population. Importantly, there could be individual-level differences, especially due to the shared risk factors for breast cancer and cardiovascular disease (4), that we are unable to account for in this county-level analyses.
Limitations of our study include the lack of individual-level data and the inability to use census-track data, which may be a closer proxy to individual-level measures (40) but was not accessible using SEER. However, a major strength of our study was the use of time-dependent linkages to the ACS and census based on the year closest to breast cancer diagnosis since the SES status and median income of counties has changed over time. Other strengths include the large-scale, population-based cohort design using recent breast cancer survivorship data (2000-2018) and representativeness of the US population. Racial and ethnic disparities in cardiovascular disease mortality are well established, but we controlled for these effects and trends in cardiovascular disease mortality through the use of SMRs.
Future studies should consider the upstream conditions, including social justice and structural inequalities, and the intersection of individual- and county-level SES on long-term cancer survivorship outcomes such as cardiovascular disease (29). Although not all individuals who live in lower-income counties are of low-income households, the county’s SES has important implications for safe housing, job opportunities, health-care resources, and access to healthy living activities (eg, physical activity, healthy foods and/or grocery stores) (29,41). Thus, there is a strong public health need to identify resources and interventions for medically underserved cancer survivor populations for management of comorbidities and treatment of cardiovascular disease.
In conclusion, our study demonstrated that geographic factors from where a patient lives at the time of their breast cancer diagnosis were associated with increased cardiovascular disease mortality risk. County-level SES, income, and rural status have continued impacts on noncancer outcomes long into survivorship. Studies with both individual- and county-level information are needed to inform public health interventions and reduce disparities among medically underserved breast cancer survivors.
Funding
This work was supported by the intramural research program of the National Cancer Institute at the National Institutes of Health.
Notes
Role of the funder: The funder had no role in the design of the study; the collection, analysis, or interpretation of the data; the writing of the manuscript; or the decision to submit the manuscript for publication.
Disclosures: The authors declare no conflicts of interest to disclose.
Author contributions: JBV: Conceptualization; Data curation; Methodology; Analyses; Writing—Original Draft Preparation; Writing—Reviewing and editing. KH: Conceptualization; Data curation; Analyses; Writing—Reviewing and editing. MS: Methodology; Analyses; Writing—Reviewing and editing; Supervision. CR: Analyses; Writing—Reviewing and editing. LV: Analyses; Writing—Reviewing and editing. XC: Analyses; Writing—Reviewing and editing. ABdG: Conceptualization; Methodology; Analyses; Writing—Reviewing and editing; Supervision.
Disclaimer: The results reported here, and the conclusions derived are the sole responsibility of the authors. The opinions expressed by the authors are their own and this material should not be interpreted as representing the official viewpoint of the U.S. Department of Health and Human Services, the National Institutes of Health or the National Cancer Institute.
Prior presentations: An abstract based on these results was presented as a poster presentation to the 2022 American Society of Preventive Oncology 46th Annual Meeting.
Data availability
All data used in this work is publicly available from the U.S. Surveillance, Epidemiology, and End Results (SEER) Program of the National Cancer Institute. Specifically, this work used data from the SEER-18 registries database. These data can be downloaded using the software SEER*Stat, which may be downloaded from https://seer.cancer.gov/seerstat/.
References
PDQ® Adult Treatment Editorial Board. PDQ financial toxicity and cancer treatment. National Cancer Institute. https://www.cancer.gov/about-cancer/managing-care/track-care-costs/financial-toxicity-hp-pdq. Published June 22,
