


Abstract
Almost one-half of aromatase inhibitor (AI)–treated breast cancer patients experience AI-associated musculoskeletal symptoms (AIMSS); 20%-30% discontinue treatment because of severe symptoms. We hypothesized that we could identify predictors of pain reduction in AIMSS intervention trials by combining data from previously conducted trials.
We pooled patient-level data from 3 randomized trials testing interventions (omega-3 fatty acids, acupuncture, and duloxetine) for AIMSS that had similar eligibility criteria and the same patient-reported outcome measures. Only patients with a baseline Brief Pain Inventory average pain score of at least 4 of 10 were included. The primary outcome examined was 2-point reduction in average pain from baseline to week 12. Variable cut-point selection and logistic regression were used. Risk models were built by summing the number of factors statistically significantly associated with pain reduction. Analyses were stratified by study and adjusted for treatment arm.
For the 583 analyzed patients, the 4 factors statistically significantly associated with pain reduction were Functional Assessment of Cancer Therapy Functional Well-Being greater than 24 and Physical Well-Being greater than 14 (higher scores reflect better function), and Western Ontario and McMaster Universities Osteoarthritis Index less than 50 and Modified Score for the Assessment and Quantification of Chronic Rheumatoid Affections of the Hands less than 33 (lower scores reflect less pain). Patients with all 4 factors were greater than 6 times more likely to experience at least a 2-point pain reduction (odds ratio = 6.37, 95% confidence interval = 2.31 to 17.53, 2-sided P < .001); similar results were found for secondary 30% and 50% pain reduction endpoints.
Patients with AIMSS who have lower symptom and functional distress at study entry on AIMSS intervention trials are more likely to experience meaningful pain reduction. Baseline symptom and functional status should be considered as stratification factors in future interventional trials.
Aromatase inhibitors (AIs) act by lowering circulating estrogen concentrations in postmenopausal women. In large randomized controlled trials of patients with hormone receptor (HR)–positive breast cancer, AIs reduce breast cancer recurrence and death (1). However, despite their proven benefit, many patients with HR-positive breast cancer are unable to persist with therapy for the recommended 5-10 years, primarily because of aggravating treatment-emergent symptoms, which are reported at similar rates for all 3 AIs (2,3). Nonpersistence with endocrine therapy has been associated with increased breast cancer recurrence and mortality (4).
AI-associated musculoskeletal symptoms (AIMSS), including arthralgias and myalgias, affect up to one-half of AI-treated patients with breast cancer and can lead to early treatment discontinuation in 20%-30% (2). Their etiology remains unknown. Multiple AIMSS interventions have been examined in randomized clinical trials, including omega-3 fatty acid (O3-FA) supplements (SWOG S0927) (5), the antidepressant duloxetine (S1202) (6), and acupuncture (S1200) (7). Duloxetine and acupuncture were both shown to statistically significantly improve joint pain compared with placebo control in patients with AIMSS, whereas O3-FA supplementation did not result in superior pain reduction compared with placebo. Few analyses have been reported to date examining predictors of response to AIMSS interventions (5-9). In both S0927 and S1202, obese patients were more likely to report pain reduction with the study intervention compared with nonobese patients (10,11).
Patient-reported outcomes (PROs) are standardized instruments that can elicit a patient’s direct report of symptoms. In early-stage HR-positive breast cancer, PROs have been used to show that patients with a higher level of symptom burden before AI initiation are more likely to prematurely discontinue AI therapy (12,13). More recently, higher levels of patient-reported symptoms early during AI therapy were shown to be associated with reduced adherence to AI therapy (14).
To design clinical trials to identify optimal treatments for patients with AIMSS, it is important to understand which clinical trial participants are more likely to experience pain reduction in the trial setting, irrespective of their assigned treatment. By combining data from the 3 previously conducted SWOG clinical studies of AIMSS interventions (S0927, S1200, and S1202), we hypothesized that we could identify baseline patient characteristics, including clinical and demographic factors and PROs, that predict pain reduction due to treatment in the context of symptom management clinical trials for patients with AIMSS.
Methods
Patient Population
Data from 3 randomized controlled studies examining treatments for AIMSS were included in this analysis. SWOG S0927 was a randomized study in which 262 patients with a worst joint pain or stiffness score of at least 5 of 10 on the Brief Pain Inventory-Short Form (BPI-SF) (15) were randomly assigned 1:1 to O3-FA 3.3 g/d or matching placebo and treated for 24 weeks (5). S1202 was a randomized study in which 299 patients with an average BPI-SF joint pain score of at least 4 of 10 were randomly assigned 1:1 to duloxetine 60 mg/d or matching placebo and treated for 12 weeks (6). S1200 was a randomized study in which 226 patients with a BPI-SF worst joint pain or stiffness score of at least 3 of 10 were randomly assigned 2:1:1 to true acupuncture, sham acupuncture, or waitlist control and treated for 12 weeks (7). All 3 studies were conducted after approval by individual institutional review boards, and all patients provided written informed consent before undergoing any study-related procedures.
All 3 studies had similar eligibility criteria, as previously reported (5-7). Patients were postmenopausal women with stage I-III HR-positive breast cancer and were required to have been taking 1 of the 3 third-generation AI medications (anastrozole, exemestane, or letrozole) for at least 21-90 days, depending on the individual study. This analysis included only patients with a baseline average pain score of at least 4 out of 10 on the BPI-SF.
Patient-Reported Outcomes
The primary outcome for all 3 studies was based on the BPI-SF, which was used to assess joint pain and stiffness (15). Patients used a 0-to-10 numeric rating scale to assess joint pain and stiffness as well as the degree to which pain interfered with activities over the past 7 days, with 10 being the worst pain imaginable. Additional assessments of joint pain, stiffness, and functional status in the hands and knees were performed using the Modified Score for the Assessment and Quantification of Chronic Rheumatoid Affections of the Hands and the Western Ontario and McMaster Universities Osteoarthritis Index, respectively (16,17). The Functional Assessment of Cancer Therapy (FACT) Endocrine Symptoms Trial Outcome Index measures physical well-being and functional well-being as well as endocrine symptoms (18). Details about the instruments are provided in Supplementary Table 1 (available online).
Other Variables
In addition to the PRO variables, other variables were examined, including age, height, weight, body mass index (BMI), self-reported race (Black vs non-Black), self-reported ethnicity (Hispanic vs non-Hispanic), total time on AI therapy, breast cancer stage (I and II vs III), prior taxane therapy (yes vs no), and concurrent bisphosphonate use (yes vs no). Reporting race and ethnicity in this study was mandated by the US National Institutes of Health consistent with the Inclusion of Women, Minorities, and Children policy. Race was analyzed separately from ethnicity. In regression analyses, because less than 5% of individuals self-reported in the American Indian or Alaska Native, Asian, and Native Hawaiian or Other Pacific Islander categories, they were combined with White in the analysis and categorized as non-Black.
Statistical Analysis
In this analysis, the endpoint of interest was average joint pain over the past 7 days as assessed using the BPI-SF. There is no single magnitude of change value that has been determined to be the gold standard for minimal clinically important improvement in the pain literature. Therefore, we evaluated multiple common approaches to defining clinically significant change in this endpoint based on the Initiative on Methods, Measurement, and Pain Assessment in Clinical Trials. We considered at least an absolute 2-point reduction (on a 10-point scale) to be the primary outcome, and at least a 30% relative reduction and at least a 50% relative reduction in BPI average pain from baseline to 12 weeks to be secondary outcomes (19,20). In previously performed analyses, 2-point absolute and 30% relative reductions have been associated with at least moderate clinically important improvements in pain, whereas 50% relative reductions have been associated with substantial improvements (20-22).
Patient characteristics at baseline were described overall and for each of the 3 studies individually. Differences by study were identified using χ2 tests. All statistical tests were 2-sided, and P less than .05 was considered statistically significant.
Variable Cut-Point Selection for Predictor Variables
Variable cut-point selection was performed on all continuous variables (age, height, weight, BMI, and all PRO measures) that were considered potentially associated with reduction in BPI average pain to identify the cut-point that optimally discriminated levels of pain between groups of patients with high vs low levels of the variable (see the Supplementary Methods, available online for full details). For each continuous variable, we calculated the Wald χ2 statistic from a logistic regression analysis using a spectrum of cutpoints (23). All models were stratified by study and adjusted for an indicator variable denoting active agent treatment group. The signed Wald χ2 statistic for each cut-point–specific logistic regression model was plotted; the cutpoint that established the greatest difference among the 3 outcomes (based on the absolute magnitude of the χ2 statistic) was used as a cutpoint for that continuous variable for all outcome analyses.
Model Building
An aggregate pain reduction model was built. First, for each baseline characteristic, we examined whether the binary variable—based on either predefined (eg, stages I and II vs III) categories or levels defined by the variable cut-point analysis described above—was associated with each measure of pain reduction between baseline and 12 weeks using logistic regression, stratified by study and adjusted for treatment arm. Candidate variables identified as statistically significant at the α = .05 level were used to generate a pain reduction score for each patient, calculated as the total number of individual factors associated with pain reduction the patient experienced (eg, if low age and low BMI were individually associated with pain reduction and a patient met both categories, their pain reduction score equaled 2). This score was calculated separately for each outcome. We also derived a parsimonious model including only variables that were statistically significantly associated with all 3 outcomes (see the Supplementary Methods, available online for full details).
Results
Patients
A total of 185 patients from S0927, 158 patients from S1200, and 240 patients from S1202 met the eligibility criteria and were included in the analysis (Supplementary Figure 1, available online). One patient enrolled in both S0927 and S1202; the data from S0927 were retained based on its earlier date of registration.
Demographic and clinicopathologic factors, including median age, median BMI, and cancer stage, were similar across studies (Table 1). The median baseline BPI average pain was 5 out of 10, and the median BPI worst pain was 7 out of 10 for all 3 studies. A higher proportion of patients on S0927 had a baseline BPI pain interference of 0-2 (29.7%) compared with the other 2 studies (19.2%–20.9%). Total time on AI therapy was statistically significantly shorter for patients treated on S1202.
Patient characteristics at baseline
| Characteristic | All studies | S0927 (O3-FA) | S1200 (Acupuncture) | S1202 (Duloxetine) | Pa |
|---|---|---|---|---|---|
| Total No. | 583 | 185 | 158 | 240 | |
| Demographics | |||||
| Race, No. (%) | .17 | ||||
| American Indian or Alaska Native | 4 (0.7) | 1 (0.5) | 1 (0.6) | 2 (0.8) | |
| Asian | 19 (3.3) | 4 (2.2) | 10 (6.3) | 5 (2.1) | |
| Black | 40 (6.9) | 13 (7.0) | 6 (3.8) | 21 (8.8) | |
| Multiracial | 3 (0.5) | 2 (1.1) | 0 | 1 (0.4) | |
| Native Hawaiian or other Pacific Islander | 1 (0.2) | 0 | 0 | 1 (0.4) | |
| Unknown | 7 (1.2) | 5 (2.7) | 2 (1.3) | 0 | |
| White | 509 (87.3) | 160 (86.5) | 139 (88.0) | 210 (87.5) | |
| Ethnicity, No. (%) | .16 | ||||
| Non-Hispanic | 549 (94.2) | 173 (93.5) | 145 (91.8) | 231 (96.3) | |
| Hispanic | 34 (6.0) | 12 (6.5) | 13 (8.2) | 9 (3.8) | |
| Age, median (range), y | 60 (27-84) | 59 (42-84) | 60 (27-80) | 60 (27-83) | .95 |
| <70, No. (%) | 507 (87.0) | 160 (86.5) | 137 (86.7) | 210 (87.5) | |
| ≥70, No. (%) | 76 (13.0) | 25 (13.5) | 21 (13.3) | 30 (12.5) | |
| Weight, median (range), kg | 80 (45-196) | 80 (45-156) | 78 (48-144) | 82 (48-196) | .23 |
| <75, No. (%) | 218 (37.4) | 73 (39.5) | 65 (41.1) | 80 (33.3) | |
| ≥75, No. (%) | 365 (62.6) | 112 (60.5) | 93 (58.9) | 160 (66.7) | |
| Height, median (range), cm | 163 (124-198) | 165 (124-188) | 163 (131-198) | 163 (125-180) | .12 |
| <155, No. (%) | 53 (9.1) | 23 (12.4) | 14 (8.9) | 16 (6.7) | |
| ≥155, No. (%) | 530 (90.9) | 162 (87.6) | 144 (91.1) | 224 (93.3) | |
| BMI, median (range), kg/m2 | 30 (18-84) | 29 (19-52) | 29 (19-84) | 31 (18-76) | .39 |
| <30, No. (%) | 293 (50.3) | 99 (53.5) | 81 (51.3) | 113 (47.1) | |
| ≥30, No. (%) | 290 (49.7) | 86 (46.5) | 77 (48.7) | 127 (52.9) | |
| Clinical factors | |||||
| Breast cancer stage, No. (%) | |||||
| I | 279 (47.9) | 91 (49.2) | 65 (41.1) | 123 (51.3) | .32 |
| II | 229 (39.3) | 69 (37.3) | 72 (45.6) | 88 (36.7) | |
| III | 72 (12.3) | 25 (13.5) | 18 (11.4) | 29 (12.1) | |
| Prior taxane therapyb, No. (%) | |||||
| No | 191 (44.9) | 81 (43.8) | — | 110 (45.8) | .67 |
| Yes | 234 (55.1) | 104 (56.2) | — | 130 (54.2) | |
| Prior bisphosphonate therapy, No. (%) | |||||
| No | 467 (80.1) | 149 (80.5) | 142 (89.9) | 176 (73.3) | <.001 |
| Yes | 116 (19.9) | 36 (19.5) | 16 (10.1) | 64 (26.7) | |
| Total time on AI therapy, median (range), d | 365 (10-3281) | 434 (10-2645) | 403 (37-3281) | 285 (21-1215) | <.001 |
| <180, No. (%) | 121 (20.8) | 23 (12.4) | 29 (18.4) | 69 (28.8) | |
| ≥180, No. (%) | 462 (79.2) | 162 (87.6) | 129 (81.6) | 171 (71.3) | |
| Patient-reported outcomes | |||||
| Minimum reduction in average pain from baseline to wk 12, No. (%) | |||||
| 2-point change | 317 (54.4) | 83 (44.9) | 81 (51.3) | 153 (63.8) | <.001 |
| 30% change | 300 (51.5) | 76 (41.1) | 75 (47.5) | 149 (62.1) | <.001 |
| 50% change | 208 (35.7) | 47 (25.4) | 54 (34.2) | 107 (44.6) | <.001 |
| BPI average pain, median (range) | 5 (4-10) | 5 (4-10) | 5 (4-9) | 5 (4-10) | .006 |
| <5 (less pain), No. (%) | 138 (23.7) | 29 (15.7) | 47 (29.7) | 62 (25.8) | |
| ≥5 (more pain), No. (%) | 445 (76.3) | 156 (84.3) | 111 (70.3) | 178 (74.2) | |
| BPI worst pain, median (range) | 7 (3-10) | 7 (5-10) | 7 (4-10) | 7 (3-10) | .61 |
| <6 (less pain), No. (%) | 104 (17.8) | 32 (17.3%) | 25 (15.8) | 47 (19.6) | |
| ≥6 (more pain), No. (%) | 479 (82.2) | 153 (82.7) | 133 (84.2) | 193 (80.4) | |
| BPI pain interference, median (range) | 4 (0-10) | 4 (0-10) | 4 (0-10) | 5 (0-10) | .03 |
| <3 (less pain), No. (%) | 134 (23.0) | 55 (29.7) | 33 (20.9) | 46 (19.2) | |
| ≥3 (more pain), No. (%) | 449 (77.0) | 130 (70.3) | 125 (79.1) | 194 (80.8) | |
| Functional well-being, median (range) | 17 (2-28) | 17 (2-28) | 17 (5-27) | 17 (3-28) | .77 |
| ≥24 (better function), No. (%) | 69 (11.8) | 22 (11.9) | 21 (13.3) | 26 (10.8) | |
| <24 (worse function), No. (%) | 514 (88.2) | 163 (88.1) | 137 (86.7) | 214 (89.2) | |
| Physical well-being, median (range) | 19 (0-28) | 19 (0-26) | 19 (5-28) | 19 (1-27) | .85 |
| ≥14 (better function), No. (%) | 487 (83.5) | 157 (84.9) | 132 (83.5) | 198 (82.5) | |
| <14 (worse function), No. (%) | 96 (16.5) | 28 (15.1) | 26 (16.5) | 41 (17.1) | |
| Endocrine subscale, median (range) | 56 (6-76) | 56 (11-76) | 55 (26-75) | 56 (6-72) | .39 |
| ≥42 (fewer symptoms), No. (%) | 499 (85.6) | 163 (88.1) | 141 (89.2) | 195 (81.3) | |
| <42 (more symptoms), No. (%) | 84 (14.4) | 22 (11.9) | 17 (10.8) | 45 (18.8) | |
| WOMAC, median (range) | 53 (6-99) | 55 (6-98) | 54 (26-93) | 52 (17-99) | .11 |
| <50 (less pain), No. (%) | 245 (42.0) | 70 (37.8) | 62 (39.2) | 113 (47.1) | |
| ≥50 (more pain), No. (%) | 338 (58.0) | 115 (62.2) | 96 (60.8) | 127 (52.9) | |
| M-SACRAH, median (range) | 36 (0-100) | 40 (0-96) | 34 (0-85) | 34 (0-100) | .18 |
| <33 (fewer symptoms), No. (%) | 261 (44.8) | 73 (39.5) | 77 (48.7) | 111 (46.3) | |
| ≥33 (more symptoms), No. (%) | 322 (55.2) | 112 (60.5) | 81 (51.3) | 129 (53.8) |
P value compares S0927, S1200, and S1202 using a 2-sided χ2 test. AI = aromatase inhibitor; BMI = body mass index; BPI = Brief Pain Inventory; M-SACRAH = Modified Score for the Assessment and Quantification of Chronic Rheumatoid Affections of the Hands; O3-FA = omega-3 fatty acid; WOMAC = Western Ontario and McMaster Universities Osteoarthritis Index.
Taxane chemotherapy information not available for participants in S1200.
Reductions in Pain by Study
Across studies, including active intervention and control groups, 54.4% of patients reported at least a 2-point reduction in pain between baseline and 12 weeks (Table 1). Higher proportions of patients in the S1200 and S1202 studies reported pain reduction on average, consistent with the overall findings for these trials of a beneficial effect of the interventions (6,7).
Variable Cut-Point Analysis
Plots of score χ2 statistics by ranking of continuous variables indicate that the cutpoints providing the best model fit are age younger than 70 years, weight less than 75 kg, height less than 155 cm, BMI less than 30 kg/m2, time on AI therapy less than 180 days, breast cancer stage III, baseline BPI average pain score less than 5, BPI worst pain score less than 6, BPI pain interference less than 3, FACT functional well-being at least 24, FACT physical well-being at least 14, FACT endocrine symptoms at least 42, Western Ontario and McMaster Universities Osteoarthritis Index (knee symptoms) less than 50, and Modified Score for the Assessment and Quantification of Chronic Rheumatoid Affections of the Hands (hand symptoms) less than 33 (Supplementary Figure 2, available online).
There was no evidence that any of the demographic variables were statistically significantly associated with any of the 3 pain reduction endpoints (Table 2; Supplementary Table 2, available online). Total time on AI therapy less than 180 days was associated with greater likelihood of a 2-point reduction in pain (odds ratio [OR] = 1.65, 95% confidence interval [CI] = 1.08 to 2.53, P = .02). No other clinical factors were statistically significantly associated with pain reduction endpoints.
Association of baseline characteristics and patient-reported outcomes with at least a 2-point absolute reduction in BPI average pain from baseline to 12 weeks
| Characteristic | Rates of pain reduction, % | OR (95% CI)a | Pa,b |
|---|---|---|---|
| Demographics | |||
| Race | |||
| Non-Black | 53.6 | Referent | |
| Black | 62.5 | 1.37 (0.70 to 2.69) | .36 |
| Ethnicity | |||
| Not Hispanic | 54.8 | Referent | |
| Hispanic | 47.1 | 0.79 (0.39 to 1.60) | .52 |
| Age | |||
| 70 y or older | 47.4 | Referent | |
| <70 y | 55.4 | 1.37 (0.84 to 2.23) | .21 |
| Height | |||
| 155 cm or taller | 53.9 | Referent | |
| <155 cm | 60.4 | 1.44 (0.80 to 2.59) | .22 |
| Weight | |||
| 75 kg or heavier | 52.9 | Referent | |
| <75 kg | 56.9 | 1.23 (0.88 to 1.74) | .23 |
| BMI | |||
| ≥30 kg/m2 | 54.0 | Referent | |
| <30 kg/m2 | 54.9 | 1.08 (0.78 to 1.50) | .65 |
| Clinical factors | |||
| Total time on AI therapy | |||
| ≥180 d | 51.4 | Referent | |
| <180 d | 66.1 | 1.65 (1.08 to 2.53) | .02 |
| Breast cancer stage | |||
| I or II | 53.7 | Referent | |
| III | 58.3 | 1.22 (0.73 to 2.03) | .44 |
| Prior taxane therapyc | |||
| No | 55.0 | Referent | |
| Yes | 56.0 | 1.07 (0.73 to 1.59) | .72 |
| Prior bisphosphonates | |||
| No | 53.7 | Referent | |
| Yes | 56.9 | 1.04 (0.68 to 1.58) | .86 |
| Patient-reported outcomes | |||
| BPI average pain | |||
| ≥5 (more pain) | 56.2 | Referent | |
| <5 (less pain) | 48.6 | 0.68 (0.46 to 1.01) | .06 |
| BPI worst pain | |||
| ≥6 (more pain) | 53.4 | Referent | |
| <6 (less pain) | 58.7 | 1.21 (0.78 to 1.87) | .39 |
| BPI pain interference | |||
| ≥3 (more pain) | 52.7 | Referent | |
| <3 (less pain) | 59.7 | 1.45 (0.97 to 2.17) | .07 |
| FACT functional well-being | |||
| <24 (worse function) | 52.0 | Referent | |
| ≥24 (better function) | 71.0 | 2.34 (1.34 to 4.07) | .003 |
| FACT physical well-being | |||
| <14 (worse function) | 38.9 | Referent | |
| ≥14 (better function) | 57.3 | 2.20 (1.39 to 3.47) | <.001 |
| FACT endocrine subscale | |||
| <42 (more symptoms) | 47.3 | Referent | |
| ≥42 (fewer symptoms) | 55.3 | 1.48 (0.90 to 2.44) | .12 |
| WOMAC | |||
| ≥50 (more pain) | 47.9 | Referent | |
| <50 (less pain) | 63.3 | 1.79 (1.28 to 2.52) | <.001 |
| M-SACRAH | |||
| ≥33 (more symptoms) | 47.7 | Referent | |
| <33 (fewer symptoms) | 62.5 | 1.81 (1.29 to 2.53) | <.001 |
Odds ratios and P values are stratified by study and adjusted for an indicator variable denoting active agent treatment arm. AI = aromatase inhibitor; BMI = body mass index; BPI = Brief Pain Inventory; CI = confidence interval; FACT = Functional Assessment of Cancer Therapy; M-SACRAH = Modified Score for the Assessment and Quantification of Chronic Rheumatoid Affections of the Hands; OR = odds ratio; Ref = reference; WOMAC = Western Ontario and McMaster Universities Osteoarthritis Index.
Tested using 2-sided Wald χ2 tests.
Prior taxane therapy information is not available for participants in S1200.
Patients with better functional and physical well-being and fewer knee and hand symptoms were more likely to have a 2-point or more reduction in pain (Figure 1; Table 2). These variables were also statistically significantly associated with pain reduction of 30%, as were less pain interference and fewer endocrine symptoms (Supplementary Figure 3 and Supplementary Table 2, available online). All 8 PRO domains except fewer endocrine symptoms were associated with pain reduction of 50% (Supplementary Figure 3 and Supplementary Table 2, available online).

Forest plot representation of odds ratios for associations between at least a 2-point improvement in pain and questionnaire responses divided according to variable cutpoint. The error bars represent the 95% confidence intervals. P values were calculated using 2-sided Wald χ2 tests.
Endpoint-Specific Pain Reduction Models
The 5 beneficial factors that were statistically significantly associated with a 2-point reduction in average pain were included in the pain reduction model. Observed rates of pain reduction increased consistently as the number of factors increased (Table 3). The odds of at least a 2-point pain reduction were 3.81 (95% CI = 1.77 to 8.20, P < .001) for those with 4 factors (69.8% with pain reduction) compared with those with no factors (37.9% with pain reduction). When simplified into 2 groups, patients with a high number of beneficial factors based on the median split of number of pain reduction factors were more than twice as likely to experience 2-point pain reduction (OR = 2.06, 95% CI = 1.45 to 2.91, P < .001).
Model results for 2-point absolute reduction in pain
| Factor | No (n = 266)/Yes (n = 317) | Rates of pain reduction, % | OR (95% CI)a | Pa,b |
|---|---|---|---|---|
| No. of concurrent factors associated with 2-point absolute pain reductionc | ||||
| 0 | 36/22 | 37.9 | Referent | |
| 1 | 89/70 | 44.0 | 1.34 (0.72 to 2.51) | .35 |
| 2 | 74/81 | 52.3 | 1.75 (0.93 to 3.28) | .08 |
| 3 | 48/91 | 65.5 | 3.01 (1.58 to 5.72) | <.001 |
| 4 | 19/44 | 69.8 | 3.81 (1.77 to 8.20) | <.001 |
| 5 | 0/9 | — | — | |
| Pain reduction score, per added beneficial factor | 1.48 (1.28 to 1.71) | <.001 | ||
| Pain reduction score group | ||||
| 0–1 | 125/92 | 42.4 | Referent | |
| 2–4 | 141/216 | 60.5 | 1.98 (1.40 to 2.80) | <.001 |
| 5 | 0/9 | — | — | |
| Trend | 2.14 (1.54 to 3.00) | <.001 | ||
| High pain reduction | ||||
| No (0–1) | 125/92 | 42.4 | Referent | |
| Yes (2–5) | 141/225 | 61.5 | 2.06 (1.45 to 2.91) | <.001 |
Odds ratios and P values are stratified by study and adjusted for an indicator variable denoting active agent treatment arm. AI = aromatase inhibitor; CI = confidence interval; FACT-ES = Functional Assessment of Cancer Therapy endocrine subscale; M-SACRAH = Modified Score for the Assessment and Quantification of Chronic Rheumatoid Affections of the Hands; OR = odds ratio; Ref = reference; WOMAC = Western Ontario and McMaster Universities Osteoarthritis Index.
Tested using 2-sided Wald χ2 tests.
Outcome-specific pain reduction scores include total time on AI therapy; FACT-ES functional and physical well-being; WOMAC; M-SACRAH. “High pain reduction” includes participants with greater than or equal to median score, which is 2 for the 2-point outcome.
The 6 factors associated with a 30% reduction in pain and the 7 factors associated with a 50% reduction in pain were also included in respective pain reduction models. Observed rates of pain reduction increased consistently as the number of factors increased (Supplementary Table 3, available online). When simplified into 2 groups, patients with a high number of factors based on the median split of number of pain reduction factors were more than twice as likely to experience 30% pain reduction (OR = 2.19, 95% CI = 1.56 to 3.08, P < .001) and 50% pain reduction (OR = 2.58, 95% CI = 1.74 to 3.81, P < .001).
Parsimonious Models for Pain Reduction
In the 583 analyzed patients, 4 factors—better functional well-being, better physical well-being, fewer knee symptoms, and fewer hand symptoms—were statistically significantly associated with pain reduction for all 3 endpoints. Patients with all 4 of these more beneficial factors were more than 6 times more likely to experience pain reduction of 2 points or more (OR = 6.37, 95% CI = 2.31 to 17.53, P < .001; Figure 2), more than 6 times more likely to experience 30% pain reduction (OR = 6.87, 95% CI = 2.59 to 18.26, P < .001), and more than 8 times more likely to experience 50% pain reduction (OR = 8.78, 95% CI = 3.42 to 22.55, P < .001; Supplementary Figure 4, available online) compared with patients with no beneficial factors. Similarly, notable trends were observed when the number of risk factors for pain reduction were considered for each increase per factor and as a binary indicator variable for high (2-4) vs low (0–1) number of factors.
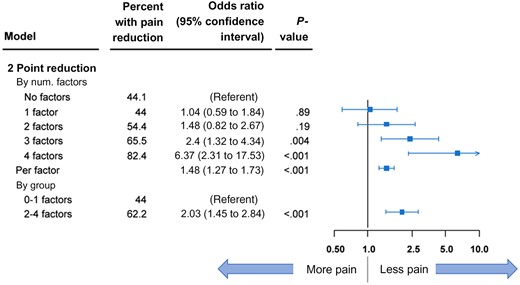
Forest plot representation of parsimonious model for at least a 2-point reduction in pain. Data are shown by number (num) of beneficial factors present. The error bars represent the 95% confidence intervals. P values were calculated using 2-sided Wald χ2 tests.
Discussion
In this large cohort of patients who were all reporting AI-associated arthralgias and enrolled in 1 of 3 large prospective trials of interventions for AIMSS, we found that those patients with lower symptom and functional distress at the time of trial enrollment were more likely to report the greatest improvement over time, even after controlling for the intervention effects. Importantly, regardless of how pain reduction was categorized, patients with more symptom scores associated with improved outcome had the greatest reduction in pain.
When future clinical trials are designed to investigate AIMSS interventions, focusing enrollment on those patients with more impaired physical function may be more likely to yield effective results, because those patients have reported less benefit from the interventions studied thus far. The findings also suggest that stratification based on baseline functional status may be important, possibly more important than stratifying based on baseline pain, which has been the norm to date.
Pain management studies, such as those of interventions for AIMSS, can be challenging to perform and interpret. First, there is no pathognomonic finding to diagnose AIMSS, and the definition is based on subjective symptoms rather than objective assessments. Therefore, there is likely heterogeneity in the underlying etiology for enrolled patients across all trials, although given the similar eligibility criteria for the 3 trials it is unlikely that substantial differences in musculoskeletal pain etiology exist between trials. Second, pain is subjective and can vary depending on multiple factors other than the AI medication and the study intervention, including recent physical activity levels and environmental factors. Finally, there is no accepted single definition of improvement in pain despite considerable deliberations by experts in the field, although guidelines in the chronic pain field consider a 2-point improvement in pain to be clinically meaningful (19,20,24).
The 4 factors (better functional well-being, better physical well-being, fewer knee symptoms, and fewer hand symptoms) that were statistically significantly associated with pain reduction for all 3 pain improvement endpoints we evaluated have particular relevance for AI-associated pain in cancer patients. This may reflect that AI therapy can cause both pain and stiffness as opposed to a purely pain phenotype. In contrast, the pain-focused measures (average, worst) were only statistically significantly associated with the greatest reduction in pain.
An additional important feature of symptom management interventional trials is the need to account for placebo response. The placebo effect is a patient’s response to participation in a therapeutic encounter, including both the clinician and the treatment environment itself (25). Importantly, with any intervention a patient can experience both the intended intervention effect and a placebo effect. A high proportion of placebo-treated patients in the clinical trials included in this analysis reported at least a 2-point reduction in pain, ranging from 33.3% to 58.8% after 6-12 weeks of therapy. In this secondary analysis of factors associated with pain reduction, we included all participants regardless of whether they were assigned to the study intervention or control because they all can experience a placebo effect. Secondary analyses such as this one, performed with the goal of increasing understanding of response to pain management interventions in different populations enrolled in placebo-controlled trials, provide information important for optimally designing future trials of treatments for AIMSS.
Several limitations of this analysis should be noted. First, the PRO data were collected only at the time of trial enrollment, when patients were already symptomatic with AIMSS. Symptom burden and physical function at the time of initiation of AI therapy are unknown. Further, the additional effect of other patient-reported symptoms, such as anxiety, depression, and insomnia, on pain reduction cannot be examined because those data were not collected. Also, we chose to combine different studies and intervention arms to provide more statistical power, a strategy supported by the similarity across studies in patient characteristics, eligibility criteria, and data collection. However, the association between the baseline variables and AIMSS may differ across the different studies and arms, which—even after adjusting for key variables such as study, arm, and baseline pain—could influence interpretation in unknown ways, especially for a symptom with potentially different etiologies. Additionally, our analysis establishes the principal that patient report of symptoms, well-being, and functional status at baseline can meaningfully predict the risk of AIMSS; however, a model derived from identifying optimal cutpoints is unlikely to be fully replicated in a separate analysis. A follow-up analysis would be required to validate our hypothesis. Finally, our study did not evaluate AI adherence itself, which—given more heterogeneous data collection for this endpoint across the trials—was beyond the scope of this analysis.
It is possible that the findings of benefit from these therapies simply represent regression to the mean. Alternatively, the pattern of symptom expression and functional loss may be attributes of patients that affect their pattern of response to interventions. For example, patients with somatization may be less likely to respond to treatment interventions. These findings could also suggest that the timing of symptom intervention is important such that early initiation of interventions for AIMSS, before symptoms worsen enough to impact physical function, may be a more effective strategy.
Overall, our findings identify a cohort of patients who were most likely to report pain reduction when treated on a clinical trial for management of AIMSS. Baseline symptom and functional status should be considered as stratification factors in future interventional trials. Future research is needed to further refine which interventions are most appropriate for individual patients with AIMSS and to identify effective interventions for patients with greater symptom burden.
Funding
This work was supported by the National Cancer Institute at the National Institutes of Health (grant number CA189974) and the Hope Foundation for Cancer Research. The content is solely the responsibility of the authors and does not necessarily represent the official views of the National Institutes of Health.
Notes
Role of the funder: The funder had no role in the study design, in the collection, analysis, or interpretation of the data, in the writing of the report, or in the decision to submit the paper for publication. All authors had full access to the data in the study and accept responsibility to submit for publication.
Disclosures: NLH reports funding from Pfizer to her institution for pharmaceutical-sponsored clinical trials. MJF reports employment by AIM Specialty Health. JMU, CT, KDC, and DLH have no relevant conflicts of interest to report.
Author contributions: Conceptualization: NLH, JMU, DLH; Data curation: JMU, CT; Formal analysis: JMU, CT; Funding acquisition: NLH, JMU, DLH; Investigation: NLH, JMU, KDC, DLH; Methodology: JMU; Validation: JMU; Visualization: JMU; Writing-original draft: NLH, JMU, DLH; Writing-review and editing: NLH, JMU, CT, MJF, KDC, DLH.
Prior presentations: The findings were reported in a poster discussion session at the 2020 San Antonio Breast Cancer Symposium.
Data Availability
Individual participant data that underlie the results reported in this article will be made available after de-identification (text, tables, figures, and appendices). Investigators who wish to use the data will have to follow standard NCI NCTN/NCORP Data Archive guidelines for obtaining data, which includes submitting a brief research plan and obtaining a data use agreement between the Data Archive and the investigator’s institution (https://nctn-data-archive.nci.nih.gov/about-us).
