


Abstract
This study projected the number of metastatic breast cancer (mBC) cases and costs (medical and productivity) attributable to mBC through 2030 among 3 age groups: younger (aged 18-44 years), midlife (aged 45-64 years), and older women (aged 65 years and older).
We developed a stock/flow model in which women enter the mBC population at initial diagnosis (de novo stage IV) or through progression of an earlier-stage cancer. Women exit the mBC population through death. Input parameters by age and phase of treatment came from the US Census, Surveillance, Epidemiology, and End Results and peer-reviewed literature.
In 2030, we estimated there would be 246 194 prevalent cases of mBC, an increase of 54.8% from the 2015 estimate of 158 997. We estimated total costs (medical and productivity) of mBC across all age groups and phases of care were $63.4 billion (95% sensitivity range = $59.4-$67.4 billion) in 2015 and would increase to $152.4 billion (95% sensitivity range = $111.6-$220.4 billion) in 2030, an increase of 140%. Trends in estimated costs were higher for younger and midlife women than for older women.
The cost of mBC could increase substantially in the coming decade, especially among younger and midlife women. Although accounting for trends in incidence, progression, and survival, our model did not attempt to forecast structural changes such as technological innovations in breast cancer treatment and health-care delivery reforms. These findings can motivate early detection activities, direct value-driven mBC treatment, and provide a useful baseline against which to measure the effect of prevention and treatment efforts.
Breast cancer is associated with a substantial economic cost to patients, payers, and society. In 2010, female breast cancer had the highest annual cost of any cancer site in the United States, estimated at $16.5 billion (1). Metastatic breast cancer (mBC) is the most advanced form of breast cancer and is the costliest on a per-person basis (2). An earlier study estimated the total discounted societal cost attributable to mBC to be $98 571 per patient-year, or $12.2 billion in an incident cohort of 49 674 patients in 2007 (3). Estimated direct medical costs for this incident cohort were $75 415 per patient-year. Early detection and effective treatment of early stages of disease are strategies to lower the total costs of mBC.
Prior studies have projected that cancer costs, broadly, and breast cancer costs, specifically, are expected to increase in the future (1,4). These trends are driven by such factors as the aging population, trends in incidence and survival within age groups, and increases in the cost of medical treatment. More recently, Mariotto et al. (5) projected the number of mBC cases in the United States through 2020. However, we are not aware of any studies that have projected medical and productivity costs for mBC cases further into the future. The objective of this study was to extend projections of the number of mBC cases from 2015 through 2030 and report projections of medical and productivity costs attributable to mBC among 3 different age groups: younger (aged 18-44 years), midlife (aged 45-64 years), and older women (aged 65 years and older). Although studies have reported medical care costs of breast cancer treatment for younger or older women (6-10), few have reported medical costs of treating mBC patients over the lifespan. The economic data produced can motivate appropriate population-level early detection activities, direct value-driven mBC treatment, and provide a useful baseline against which to measure the effect of prevention and treatment efforts.
Methods
Stock and Flow Model
To estimate the mBC-prevalent population and costs over time, we developed a stock and flow model (Figure 1). Women enter the mBC population in 2 ways: they can have stage IV mBC at initial diagnosis (de novo), or their early-stage breast cancer can progress to metastatic disease. Women exit the mBC population through death. We modeled nonmetastatic, stage I-III (n = nonmetastatic) and metastatic (m = metastatic) populations over time (t) from 2015 through 2030 by age groups (a) of interest: 1) 18-44 years, 2) 45-64 years, and 3) 65 years and older.
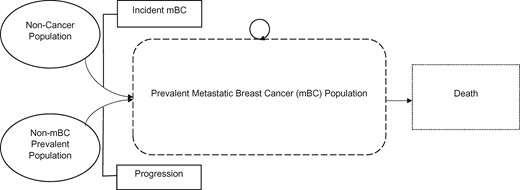
Model schematic for projections of metastatic breast cancer cases and costs.
Initial Metastatic Cases
Using data tables from the US Census 2017 National Population Projections, we estimated the number of women in each age group from 2010 through 2030, where Ta, t is the total female population of age group a in time t (11,12). These population projections were then used to predict the number of initial metastatic cases in 2015 (δma Ta, t–1 + πa–1), estimated as the number of women in the age group at time t–1 (Ta, t–1) multiplied by the de novo incidence of mBC in the age group (δma), plus the progression rate from non-mBC in the age group (πa) multiplied by the prevalent non-mBC population in the age group at time t–1 (–1). The de novo incidence was estimated as the incidence of breast cancer (any stage) (δa) multiplied by the proportion with distant metastases in each age group (Prma). The prevalence of non-mBC was estimated as the prevalent breast cancer cases (all stages) from January 1, 2015, multiplied by 1 minus the proportion with distant metastases in each age group (Prma). The progression rate from non-mBC to mBC was estimated using long-run average rates from 2 large cohort studies (13,14). Table 1 lists the base case values and sources for each of these input parameters.
Input parameters and sources for base case projections of metastatic breast cancer casesa
| Input parameter | Formula | Age group, y | Value | Source |
|---|---|---|---|---|
| Prevalent breast cancer cases for January 1, 2015 (all stages) | + | 18-44 | 249 107 | SEER Fast Stats (15) (retired April 1, 2019) |
| + | 45-64 | 991 982 | ||
| + | 65+ | 1 945 274 | ||
| Proportion of age group withdistant metastases | 18-44 | 0.052 | SEER Fast Stats (15) and SEER*Explorer (16) | |
| 45-64 | 0.057 | |||
| 65+ | 0.058 | |||
| Age-adjusted incidence for female breast cancer | δ18–44 | 18-44 | 0.00043667 | USCS Data Visualizations-CDC (17) |
| δ45–64 | 45-64 | 0.00254014 | ||
| δ65+ | 65+ | 0.00416246 | ||
| Annual metastatic survival probability | σm18–44 | 18-44 | 0.79 | Estimated |
| σm45–64 | 45-64 | 0.53 | ||
| σm65+ | 65+ | 0.40 | ||
| Nonmetastatic survival probability | σn18–44 | 18-44 | 0.982 | Estimated (weighted average of local and regional stage) |
| σn45–64 | 45-64 | 0.983 | ||
| σn65+ | 65+ | 0.930 | ||
| Annual progression rate | π | All | 0.02 | Estimated from Geurts et al. (13) and Colzani et al. (14) |
CDC = Centers for Disease Control and Prevention; SEER = Surveillance, Epidemiology, and End Results Program; USCS = United States Cancer Statistics.
Continuing Metastatic Cases
We estimated the number of continuing case s (σma)—that is, women with mBC who survived to the next year of the model—by multiplying the survival rates for mBC in age group a (σma) by the prevalent mBC cases in the age group in time t (–1). The initial number of prevalent mBC cases came from multiplying the prevalent cases from January 1, 2015, by the proportion with distant metastases in each age group (Prma).
To estimate the survival rate for mBC in each age group, we estimated a weighted average of the numbers of women surviving 0-5 years, 6-10 years, 11-15 years, 16-20 years, and 21-25 years post diagnosis by the survival probabilities for those intervals of time (16). The estimates for survival rates for 0-5 years and 6-10 years post diagnosis came directly from SEER*Explorer, where the estimate for the 0- to 5-year interval was the midpoint of survival 2 to 3 years beyond diagnosis, and similarly, the survival estimate for the 6- to 10-year interval was the midpoint of survival 7 to 8 years beyond diagnosis (16). Beyond 10 years post diagnosis, survival estimates came from extrapolating the best-fitting curve using annual survival probabilities for years 1 through 10. For distant metastases, the trend lines of best fit were logarithmic because of the steep drop in survival after 10 years. The survival rates were then annualized to estimate the conditional probability of surviving until the next year given that a woman has survived until the current year. Finally, estimates for survival rates 11-15 years post diagnosis came from the midpoint of the annualized survival extrapolations in years 12 and 13, and so on.
Terminal Metastatic Cases
The third piece of the projections was to estimate the terminal cases ([1 – σma]), or those who died in a given year of the model. We estimated this as 1 minus the survival rate for mBC cancer in the age group (1 – σma) multiplied by the prevalent mBC cases in the age group in time t (). Estimation of the survival rate for mBC cases is described in the previous section. Again, the initial number of prevalent mBC cases came from multiplying the prevalent cases from January 1, 2015, by the proportion with distant metastases in each age group (Prma).
Prevalent Nonmetastatic Cases
Because we were accounting for progression from non-mBC to mBC, we needed to separately estimate the number of prevalent nonmetastatic cases over time (σna–1 + δna Ta, t–1−πa–1). In the first year of the model, this estimate was made up of the women who already had non-mBC and survived the year (σna–1) plus the women who initially developed non-mBC (δna Ta, t–1) minus the women who progressed to metastatic disease in that year (πa–1).
The initial number of prevalent non-mBC cases came from multiplying the prevalent cases from January 1, 2015, by the proportion without distant metastases in each age group (1 − Prma). We estimated the survival rates for nonmetastatic cases in a similar manner to the metastatic cases described previously. Here, we estimated the nonmetastatic survival as a weighted average of those surviving non-mBC 0-5 years, 6-10 years, 11-15 years, 16-20 years, and 21-25 years post diagnosis by the survival probabilities for those intervals of time and took a weighted average of these values for the local and regional stages. The estimates for survival rates for 0-5 years and 6-10 years post diagnosis came directly from SEER*Explorer, where the estimate for 0-5 years was the midpoint of survival 2 to 3 years beyond diagnosis, and similarly, the survival estimate for 6-10 years was the midpoint of survival 7 to 8 years beyond diagnosis (16). Beyond 10 years post diagnosis, we assumed that survival for local stage reverted to that of the general population. These survival estimates came from US Life Tables for women in 2016 (18). For regional stage cancers beyond 10 years post diagnosis, survival estimates came from extrapolating the best-fitting curve using annual survival probabilities for years 1 through 10. The survival rates were then annualized to estimate the conditional probability of surviving until the next year given that a woman has survived until the current year. Estimates for survival 11-15 years post diagnosis came from the midpoint of the annualized survival in years 12 and 13, and so on.
Dynamic Parameters
We extended recent trends in 3 key parameters in our projections: incidence (δma), metastatic survival (σma), and progression (πa). For each parameter, we used the annual percent change from the most recent age-specific trend segment reported in SEER*Explorer to update future values for these parameters (Table 2). We used the trend in overall incidence (all stages) for δma because of our need to predict nonmetastatic cases and assumed trends in progression from nonmetastatic to mBC (πa) would follow trends in incident de novo mBC. We used the age-specific mortality rates from SEER*Explorer and flipped the sign on the annual percent change estimates to reflect survival.
Epidemiologic inputs and ranges for probabilistic sensitivity analysesa
| Input | Age group, y | Value (95% sensitivity range) | Trend year range | Distribution | Source |
|---|---|---|---|---|---|
| Age-adjusted incidence for female breast cancer (growth trend) | 18-44 | 1.00475 (1.0024-1.007106) | 2000-2017 | Normal | SEER*Explorer (16) |
| 45-64 | 1.001233 (0.999031-1.00344) | 2004-2017 | Normal | ||
| 65+ | 1.000142 (0.996098-1.004204) | 2009-2017 | Normal | ||
| Metastatic survival (growth trend) | 18-44 | 0.995649 (0.984731-1.006449) | 2010-2018 | Normal | SEER*Explorer (16) |
| 45-64 | 1.018982 (1.016996-1.020964) | 2008-2018 | Normal | ||
| 65+ | 1.001374 (0.991846-1.010812) | 2015-2018 | Normal | ||
| Annual progression rate (parameter) | All | 2% (1%-4%) | Uniform | Estimated from Geurts et al. (13) and Colzani et al. (14) | |
| Annual progression rate (growth trend) | 18-44 | 1.028156 (1.010636-1.04598) | 2006-2017 | Normal | SEER*Explorer (16) |
| 45-64 | 0.998543 (0.979933-1.017507) | 2008-2017 | Normal | ||
| 65+ | 1.012332 (0.999763-1.025059) | 2005-2017 | Normal |
SEER = Surveillance, Epidemiology, and End Results Program.
Costs
After estimating the number of women in each phase of treatment, we multiplied each age-by-phase category by an estimate of average per-person medical care costs in that age-by-phase category (19). Briefly, using data from the 2003-2014 North Carolina (NC) cancer registry data linked with administrative claims from public and private payers, matching and regression analysis were used to estimate excess costs attributed to mBC as the difference in adjusted mean payments between the patients with mBC and no breast cancer by treatment phase and age group (Table 3). Total direct medical costs included components costs for inpatient, outpatient, physician visits, and prescriptions. The initial phase captured the costs associated with the first 12 months post diagnosis (21). The terminal phase captured the costs associated with the final 12 months of life. The continuing phase represented the time spent between the initial and terminal phases. In the base case, we assumed that medical costs increased by 5% annually between 2015 and 2030.
Cost inputs and ranges for probabilistic sensitivity analyses
| Input | Age group, y | Value (95% sensitivity range) | Trend year range | Distribution | Source |
|---|---|---|---|---|---|
| Medical cost: initial treatment phase (parameter) | 18-44 | $87 266 (74 608-99 923) | 2003-2014 | Normal | Trogdon et al., 2020 (19) |
| 45-64 | $96 016 (90 630-101 402) | 2003-2014 | |||
| 65+ | $76 959 (73 335-80 582) | 2003-2014 | |||
| Medical cost: continuing treatment phase (parameter) | 18-44 | $209 961 (165 736-254 186) | 2003-2014 | Normal | Trogdon et al., 2020 (19) |
| 45-64 | $155 212 (140 457-169 966) | 2003-2014 | |||
| 65+ | $119 790 (112 391-127 190) | 2003-2014 | |||
| Medical cost: terminal treatment phase (parameter) | 18-44 | $113 089 (97 825-128 352) | 2003-2014 | Normal | Trogdon et al., 2020 (19) |
| 45-64 | $119 950 (108 076-131 825) | 2003-2014 | |||
| 65+ | $88 704 (85 454-91 953) | 2003-2014 | |||
| Medical costs (inflation rate) | All | 5% (0%-10%) | Triangular | Trogdon et al., 2020 (19) | |
| Productivity cost: initial and continuing treatment phases (parameter) | 18-44 | $5169 (0-11 044) | 2000-2016 | Normal | Trogdon et al., 2020 (20) |
| 45-64 | $4454 (3091-5817) | 2000-2016 | |||
| 65+ | $680 (88-1272) | 2000-2016 | |||
| Productivity cost: terminal treatment phase (parameter) | 18-44 | $1 337 562 (1 248 660-1 426 464) | 2000-2016 | Normal | Trogdon et al., 2020 (20) |
| 45-64 | $709 535 (631 186-787 885) | 2000-2016 | |||
| 65+ | $187 708 (149 570-225 845) | 2000-2016 | |||
| Productivity costs (inflation rate) | All | 2% (0%-5%) | Triangular | Trogdon et al., 2020 (20) |
We also multiplied the number of mBC cases in each age-by-phase category by an estimate of average per-person productivity costs in that age-by-phase category (Table 3) (20). For the initial and continuing phases, productivity costs represented the value of lost work days from analysis of the National Health Interview Survey. For the terminal phase, productivity costs represent the net present value of lost productive years because of premature mortality. In the base case, we assumed that productivity costs increased by 2% annually between 2015 and 2030.
Probabilistic Sensitivity Analysis
To account for uncertainty in our non-Census and non-SEER input parameters, we conducted a probabilistic sensitivity analysis. Specifically, we simultaneously drew the following parameters from their respective assumed probability distributions and calculated our projections 1000 times: progression rate; trends in incidence, survival, and progression (Table 2); all medical and productivity costs; and inflation rates for medical and productivity costs (Table 3). In addition to the annual percent change estimates for age-specific incidence and mortality rates, SEER*Explorer presented lower and upper bounds of the confidence intervals. We applied these SEER-estimated confidence intervals as sensitivity ranges for this analysis. The 95% confidence intervals for medical and productivity costs were estimated in 2 previously published articles and were directly applied as sensitivity ranges for this analysis (19,20).
Results
In 2030 we estimated there would be 246 194 prevalent cases of mBC, an increase of 54.8% from the 2015 estimate of 158 997 (Table 4). In the base case model for 2030, we estimated that 48 203 (19.6%) of the prevalent mBC cases would be between the ages of 18 and 44 years, 120 916 (49.1%) would be between ages 45 and 64 years, and 77 075 (31.3%) would be 65 years or older. Although the total number of women with mBC was estimated to increase during this time, the number of women in the 65+ years age group was expected to decrease between 2015 and 2020 and then stabilize (Figure 2).

Prevalent metastatic breast cancer (mBC) case projections and 95% sensitivity ranges by age group, 2015-2030. This figure draws on inputs from US Census population projections, the Surveillance, Epidemiology, and End Results (SEER) Explorer and SEER Fast Stats databases. The annual progression rate from non-mBC to mBC was estimated from the published literature. These inputs were applied to a stock and flow model to estimate and project the number of prevalent mBC by age group from 2015 to 2030. A) 18- to 44-year-olds. B) 45- to 64-year-olds. C) 65+ year-olds. D) All ages. Solid = base case; dotted = 95% sensitivity ranges.
Projected counts for metastatic breast cancer by age group, 2015-2030
| Age group and year | Total female population | Initial metastatic cases | Terminal: deaths | Continuing metastatic: survivors | Prevalent metastatic population |
|---|---|---|---|---|---|
| 18-44 | |||||
| 2015 | 56 829 000 | 6002 | 2717 | 10 237 | 16 238 |
| 2020 | 58 860 007 | 8342 | 6094 | 20 778 | 29 119 |
| 2025 | 60 495 552 | 10 969 | 9070 | 28 186 | 39 155 |
| 2030 | 61 375 096 | 13 827 | 12 064 | 34 376 | 48 203 |
| 45-64 | |||||
| 2015 | 42 813 000 | 24 864 | 26 405 | 30 138 | 55 002 |
| 2020 | 42 650 055 | 31 184 | 27 197 | 38 426 | 69 609 |
| 2025 | 41 565 444 | 36 067 | 31 171 | 56 210 | 92 277 |
| 2030 | 41 339 738 | 39 997 | 33 585 | 80 919 | 120 916 |
| 65+ | |||||
| 2015 | 25 555 000 | 42 623 | 67 692 | 45 134 | 87 757 |
| 2020 | 31 037 419 | 40 918 | 41 325 | 27 871 | 68 790 |
| 2025 | 35 925 832 | 42 438 | 41 629 | 28 402 | 70 840 |
| 2030 | 40 216 255 | 46 207 | 44 723 | 30 868 | 77 075 |
| All ages | |||||
| 2015 | 125 197 000 | 73 489 | 96 814 | 85 509 | 158 997 |
| 2020 | 132 547 481 | 80 444 | 74 616 | 87 074 | 167 518 |
| 2025 | 137 986 828 | 89 474 | 81 870 | 112 798 | 202 272 |
| 2030 | 142 931 089 | 100 030 | 90 372 | 146 164 | 246 194 |
After estimating the number of women in each phase of care from 2015 to 2030, we projected the cost of mBC by phase of care (Figure 3). We estimated total costs (medical and productivity) of mBC across all age groups, and phases of care was $63.4 billion (95% sensitivity range = $59.4-$67.4 billion) in 2015 and would increase to $152.4 billion (95% sensitivity range = $111.6-$220.4 billion) in 2030, an increase of 140% (Table 5). Trends in estimated costs were higher for younger and midlife women than for older women. In 2030, we estimate total costs (95% sensitivity range) to be highest for women aged 45 to 64 years ($75.3 billion [$55.1-$108.9 billion]) followed by women aged 18 to 44 years ($42.4 billion [$31.9-$60.8 billion]) and women aged 65 years or older ($34.7 billion [$24.0-$52.4 billion]). Productivity costs were slightly higher than medical costs for women aged 18 to 44 years, slightly lower for women aged 45 to 64 years, and were only one-half of medical costs for women aged 65 years or older.
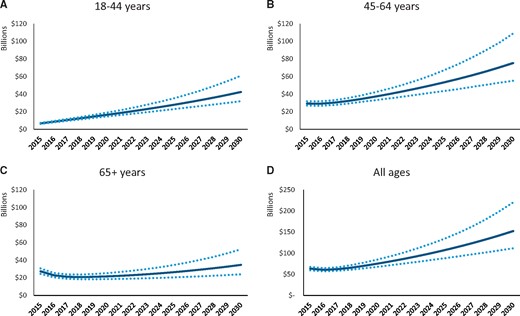
Total cost projections and 95% sensitivity ranges by age group, 2015-2030. The original analysis estimating the medical and productivity costs by phase of treatment (initial, continuing, and terminal) and by age group are presented in Trogdon et al. (19,20). These cost estimates were applied to the stock and flow model estimating the number of prevalent metastatic breast cancer cases to then project the medical costs by age group from 2015 to 2030. A) 18- to 44-year-olds. B) 45- to 64-year-olds. C) 65+ year-olds. D) All ages. Solid = base case; dotted = 95% sensitivity ranges.
Projected costs for metastatic breast cancer by age group, 2015-2030 (billions of USD)
| Age group and year | Medical costs (95% sensitivity range) | Productivity costs (95% sensitivity range) | Total costs (95% sensitivity range) |
|---|---|---|---|
| 18-44 | |||
| 2015 | 3.0 (2.4 to 3.5) | 3.7 (3.5-4.0) | 6.7 (6.1-7.3) |
| 2020 | 7.4 (5.6-9.4) | 9.2 (8.3-10.6) | 16.5 (14.6-19.1) |
| 2025 | 12.9 (8.4-18.9) | 15.0 (12.9-19.1) | 27.9 (23.0-35.3) |
| 2030 | 20.3 (11.1-35.2) | 22.1 (17.8-31.7) | 42.4 (31.9-60.8) |
| 45-64 | |||
| 2015 | 10.2 (9.6-10.9) | 19.0 (16.7-21.6) | 29.2 (26.9-31.84) |
| 2020 | 15.6 (12.8-18.7) | 21.6 (18.7-25.4) | 37.2 (33.2-42.2) |
| 2025 | 25.9 (17.2-37.1) | 27.5 (22.7-35.5) | 53.4 (43.5-67.3) |
| 2030 | 42.5 (24.0-72.5) | 32.8 (25.6-46.9) | 75.3 (55.1-108.9) |
| 65+ | |||
| 2015 | 14.7 (14.2-15.2) | 12.8 (9.8-15.9) | 27.5 (24.5-30.7) |
| 2020 | 13.0 (10.7-15.6) | 8.6 (6.6-11.1) | 21.6 (18.5-25.4) |
| 2025 | 16.9 (11.5-24.1) | 9.6 (7.4-13.4) | 26.5 (20.5-34.6) |
| 2030 | 23.3 (13.2-39.8) | 11.4 (8.5-17.4) | 34.7 (24.0-52.4) |
| All ages | |||
| 2015 | 27.9 (26.9-28.9) | 35.5 (31.7-39.3) | 63.4 (59.4-67.4) |
| 2020 | 35.9 (29.5-43.2) | 39.4 (35.6-45.4) | 75.4 (67.9-85.1) |
| 2025 | 55.7 (38.1-79.4) | 52.1 (44.8-66.3) | 107.8 (88.3-135.3) |
| 2030 | 86.1 (48.9-147.0) | 66.2 (53.5-94.4) | 152.4 (111.6-220.4) |
Discussion
Our results suggest that the cost of mBC could increase substantially in the coming decade, especially among younger and midlife women. Our model is a projection of current incidence and survival rates and per-woman medical costs into future populations. We did not attempt to forecast structural changes such as technological innovations in breast cancer treatment and health-care delivery reforms in these inputs. However, these changes could dramatically alter the future of mBC cases and costs. For example, women with mBC are usually on continuous treatment. To the extent that new treatments are effective at prolonging life, this could increase costs, even more so if the unit price of those treatments continues to become more expensive (22,23). Historically, the largest drivers of direct medical costs for mBC have been palliative or supportive care (40%), active treatment (drug and administration; 37%), medical follow-up (16%), treatment-related toxicity management (5%), diagnostic (2%), and terminal care (1%) (3). Active treatment costs are driven by non–HER2-targeted therapies, taxanes, and HER2-targeted therapies (3). Improvements in screening and detection (eg, genetic tests, imaging) could increase or decrease mBC costs depending on how they shift the time that women spend in early-stage breast cancer vs mBC.
Our estimates of the number of mBC cases are aligned with those reported by Mariotto and colleagues (5). In their study, they estimated the number of women living with mBC through 2020 to be 168 292 women (5). For comparison, in this study, we estimated 167 518. We also took the estimates provided in the Mariotto et al. (5) article from 1990 through 2020 and projected them forward using a quadratic time trend, which produced an estimate of 222 500 women with mBC in the year 2030. This is slightly lower than our estimate of 246 194 women.
Our medical cost estimates are larger than those of a previous study, published in 2011, that estimated the annual costs of breast cancer (all stages) would be $23.24 billion in 2020 (1). For comparison, we estimated the medical costs of mBC would be $35.9 billion (95% sensitivity range = $29.5-$43.2 billion) in 2020. The difference in estimates could occur for several reasons. The earlier study was based on SEER-Medicare data through 2005; per-woman medical costs may have increased faster than 5% between 2014 and the end of the source data used in this study. Our medical cost estimates were also based on different source data (ie, Medicare, Medicaid and private insurance claims from NC) than the earlier study (ie, Medicare claims for women aged 65 years and older with a proportionality assumption for younger women). It may be that private insurance costs are higher than Medicare in NC. The strength of this study is the use of population-level, multipayer claims data for all ages, which comes at the cost of accessing data from a single state.
Our base case estimates showed a slight decline in the number of mBC cases among women aged 65 years and older. The prevalence estimates were driven by the combination of initial metastatic cases at diagnosis and continuing metastatic cases (ie, those who survive). The initial metastatic numbers for this age group were relatively stable over the 10 years. Thus, the slight decline in overall mBC cases is due to a decline in the projected number of mBC survivors in this age group.
Our results should be interpreted in the context of limitations of the study. We are not aware of reliable, population-level information on trends in progression rates from early to metastatic disease. The medical cost inputs by age and treatment phase were based on data from NC and may not be representative of the larger United States. We know of no national estimates for the cost of mBC by age, especially among younger women. For context, overall health-care expenditures per capita for NC are lower than national expenditures: $7264 per person compared with $8045 in 2014 (24). However, NC is a populous and diverse state, and the estimates represent costs from multiple payers to include women of all ages. Finally, due to a combination of many disparate aggregate data sources, we could not calculate statistical confidence intervals. Rather, we conducted a probabilistic sensitivity analysis.
We project that the cost of mBC may increase substantially through 2030. Furthermore, mBC costs among younger and midlife women may increase faster than for older women. The results of this study highlight groups of mBC patients by age that may require support to mitigate the adverse economic consequences from medical and productivity costs associated with the disease. The projections also provide a useful baseline against which to measure the effect of current and future efforts to reduce the burden to patients and families.
Funding
This work was supported by the Centers for Disease Control and Prevention (3-U48-DP005017-04S4; PIs: Trogdon and Wheeler). Dr Trogdon worked with the Centers for Disease Control and Prevention under Intergovernmental Personnel Act 15IPA1504755.
Notes
Role of funder: The sponsor did not play a role in the design of the study; the collection, analysis, or interpretation of the data; writing of the manuscript; or the decision to submit the manuscript for publication.
Disclosures: Dr Gogate became a full-time employee of Bristol Myers Squibb Company after completion of this research study. Drs. Wheeler and Reeder-Hayes have received unrelated grant funding paid to their institution from Pfizer Foundation in the past 3 years. Dr Wheeler received support from the American Cancer Society Mentored Research Scholar Grants (MRSG-13–157-01-CPPB). All other authors report no conflict of interests.
Author contributions: AG: Formal analysis; Methodology; Writing—original draft; Writing—review and editing. SBW: Conceptualization; Formal analysis; Funding acquisition; Investigation, Methodology; Supervision; Writing—review and editing. KRH: Formal analysis; Investigation; Methodology; Supervision; Validation; Writing—review and editing. DUE: Conceptualization; Funding acquisition; Investigation; Supervision; Validation; Writing—review and editing. TLF: Conceptualization; Funding acquisition; Writing—review and editing. SD: Funding acquisition; Project administration; Writing—review and editing. JGT: Conceptualization; Data curation; Formal analysis; Funding acquisition; Investigation; Methodology; Supervision; Writing—original draft; Writing—review and editing.
Disclaimer: The findings and conclusions in this report are those of the authors and do not necessarily represent the official position of the Centers for Disease Control and Prevention.
Data Availability
The data underlying this article will be shared on reasonable request to the corresponding author.
