


Abstract
Having a child diagnosed with cancer is a devastating experience that may affect parents’ mental health. We aimed to assess the risk of hospital contacts for psychiatric disorders in parents of children with cancer.
We conducted a nationwide population-based cohort study using Danish registry data. Parents of children diagnosed with cancer between 1982 and 2014 (n = 6689 mothers, n = 5509 fathers) were matched with comparison parents of cancer-free children (n = 67 544 mothers, n = 55 756 fathers). We used Cox proportional hazards models to estimate the risk of hospital contacts for any psychiatric disorder and specific disorders. Cox models were also used to investigate sociodemographic and cancer-related risk factors for psychiatric disorders.
Incidence rates of hospital contacts for any psychiatric disorder were 426 per 100 000 person-years in mothers of children with cancer and 345 per 100 000 person-years in comparison mothers. For fathers, the respective incidence rates were 260 and 262 cases per 100 000 person-years. Compared with parents of cancer-free children, mothers of children with cancer were at an increased risk of hospital contacts for any psychiatric disorder (hazard ratio = 1.23, 95% confidence interval = 1.12 to 1.36), whereas no elevated risk was seen in fathers (hazard ratio = 0.99, 95% confidence interval = 0.87 to 1.13). Among mothers, risks were particularly elevated for affective and stress-related disorders. Parents of deceased children and children diagnosed at a younger age were at particular risk of hospital contacts for psychiatric disorders.
Hospital contacts for psychiatric disorders were overall rare. Health-care professionals should draw attention to subgroups of vulnerable parents to meet their needs of support and adequate treatment.
Childhood cancer raises a range of medical and psychosocial challenges for the affected children, their families, and the society (1). Despite 5-year survival from childhood cancer exceeding 80% in most of Europe nowadays (2), having a child with cancer remains a devastating experience for the parents (3,4). The parents need to manage the life-threatening condition of their child, frequent hospitalizations and invasive treatment procedures, responsibilities for siblings, and potential marital challenges (5) or adverse economic consequences of the child’s disease (6). This imposes a considerable emotional burden (7-9) that may put parents at risk of mental health problems including anxiety, depression, or posttraumatic stress symptoms (10–12).
Research on psychological consequences in parents of children with cancer is extensive but often focused on specific mental health aspects based on relatively small and selective samples (11). Studies including a broad spectrum of mental disorders that were based on clinically diagnosed conditions are rare. We are only aware of 1 population- and registry-based registry from Canada that showed higher rates of mental health–related outpatient visits among mothers of children with cancer compared with population comparisons, whereas no increased risk of severe psychiatric events requiring hospitalization were reported (13). This study only included mothers of children diagnosed with cancer between 1998 and 2014, limiting length of follow-up and statistical power for studying specific disorders. Moreover, studies including fathers of children with cancer are largely underrepresented in psycho-oncological research (11). To overcome these limitations, we set up a nationwide cohort using high-quality Danish registry data that included both mothers and fathers of children with cancer diagnosed during the 32-year period of 1982-2014. We aimed to: 1) assess their risk of a hospital contact for any psychiatric disorder and specific psychiatric disorders compared with parents of cancer-free children and 2) identify parents at particular risk of a psychiatric disorder.
Methods
Design and Study Population
We conducted a nationwide cohort study based on Danish registry data (14). The Civil Registration System and the unique personal identification numbers used in all Danish registries enabled accurate linkage of individual information across registries (15). The study population has previously been described (16,17), and detailed information is given in the online supplement (Supplementary Methods, available online). Briefly, we identified 7636 children diagnosed with cancer before the age of 20 years in 1982-2014 from the Danish Cancer Registry (18) (see Figure 1). The children’s personal identification numbers allowed linkage to their parents via the Central Population Registry (15) and the Medical Birth Register (19). Subsequently, we identified comparison children without cancer diagnosis and their parents. Ten comparison parents per case parent were randomly sampled from the entire population of Denmark, individually matched by child’s year of birth and parental decade of birth. We excluded parents with hospital contacts for psychiatric disorders in the 5-year period before the child’s cancer diagnosis in case parents or the equivalent calendar date based on the matched year of birth in comparison parents (reference date). We obtained approval from the Danish Data Protection Agency (2015-41-4056).
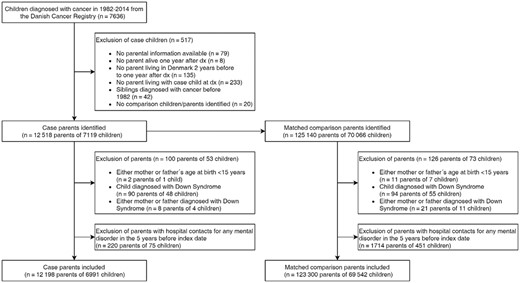
Flow chart of study population dx = diagnosis.
Hospital Contact for Psychiatric Disorders
Information on hospital contacts for psychiatric disorders was obtained from the nationwide Danish Psychiatric Central Research Register containing admission date and diagnoses for every inpatient contact to mental hospitals and psychiatric departments in general hospitals in Denmark since 1969 (20). Outpatient contacts have been registered since 1995 (20). In Denmark, capacities for inpatient stays have decreased over time with more patients being treated in the outpatient setting (21). Therefore, both inpatient and, since 1995, outpatient contacts were included for the study period 1982-2017. In Denmark, the psychiatric diagnostic coding changed from the International Classification of Diseases (ICD) version 8 to version 10 in 1994 (20). Using the respective ICD codes, all diagnoses of psychiatric disorders were categorized into the following groups: organic psychosis, schizophrenia, affective disorders, anxiety, stress-related disorders, adult personality and behavior disorders, disorders related to psychoactive substance use, disorders due to known somatic condition, somatoform and other neurotic disorders, and other psychiatric disorders (Supplementary Methods, available online; Table 1). The grouping system was developed based on a previous study from Denmark including childhood cancer survivors (21) and advice from 2 clinical experts. We only included the first hospital contact with a psychiatric disorder listed as the main diagnosis.
Characteristics of parents of children diagnosed with cancer in 1982-2014 (case parents) and parents of cancer-free children (comparison parents) in Denmark
| Characteristic | Case parents (n = 12 198) | Comparison parents (n = 123 300) | ||
|---|---|---|---|---|
| Mothers (n = 6689) | Fathers (n = 5509) | Mothers (n = 67 544) | Fathers (n = 55 756) | |
| No. (%) | No. (%) | No. (%) | No. (%) | |
| Sociodemographic characteristics of parents | ||||
| Age, ya,b | ||||
| <30 | 1156 (17.3) | 557 (10.1) | 11 271 (16.7) | 5567 (10.0) |
| 30-34 | 1380 (20.6) | 964 (17.5) | 14 151 (21.0) | 9978 (17.9) |
| 35-39 | 1597 (23.9) | 1205 (21.9) | 16 057 (23.8) | 12 362 (22.2) |
| 40-44 | 1444 (21.6) | 1283 (23.3) | 14 477 (21.4) | 12 618 (22.6) |
| ≥45 | 1112 (16.6) | 1500 (27.3) | 11 588 (17.2) | 15 231 (27.3) |
| Period of cancer diagnosis/reference yearb | ||||
| 1982-1999 | 3427 (51.2) | 2848 (51.7) | 34 546 (51.2) | 28 673 (51.4) |
| 2000-2014 | 3262 (48.8) | 2661 (48.3) | 32 998 (48.9) | 27 083 (48.6) |
| Educationa,c,d | ||||
| Short | 1387 (21.1) | 1007 (18.7) | 13 493 (20.3) | 9664 (17.7) |
| Medium | 3158 (48.0) | 2922 (54.1) | 31 927 (48.1) | 29 362 (53.7) |
| Higher | 2033 (30.9) | 1468 (27.2) | 20 909 (31.5) | 15 611 (28.6) |
| Country of birthc | ||||
| Denmark | 6171 (92.3) | 5037 (91.4) | 61 894 (91.6) | 51 194 (91.8) |
| Other | 518 (7.7) | 472 (8.6) | 5649 (8.4) | 4561 (8.2) |
| Place of residencea,b | ||||
| Copenhagen and suburbs | 2104 (31.5) | 1653 (30.0) | 20 630 (30.5) | 17 001 (30.5) |
| Provincial cities | 2677 (40.0) | 2178 (39.5) | 26 520 (39.3) | 21 828 (39.2) |
| Rural | 1908 (28.5) | 1678 (30.5) | 20 394 (30.2) | 16 927 (30.4) |
| Biological/adoptive childrena,b | ||||
| ≤1 child | 1978 (29.6) | 1524 (27.7) | 18 344 (27.2) | 15 597 (28.0) |
| 2 children | 3080 (46.1) | 2573 (46.7) | 32 008 (47.4) | 25 683 (46.1) |
| ≥3 children | 1631 (24.4) | 1412 (25.6) | 17 192 (25.5) | 14 476 (26.0) |
| Cohabitation with the other parenta,c | ||||
| No | 1087 (17.0) | 236 (4.4) | 4030 (6.0) | 1408 (2.5) |
| Yes | 5319 (83.0) | 5207 (95.7) | 62 777 (94.0) | 54 309 (97.5) |
| Working statusa,b,e | ||||
| Not working | 1147 (17.2) | 351 (6.4) | 11167 (16.5) | 3388 (6.1) |
| Working | 5276 (78.9) | 5030 (91.3) | 54 082 (80.1) | 51 230 (91.9) |
| Other | 266 (4.0) | 128 (2.3) | 2295 (3.4) | 1138 (2.0) |
| Incomea,c | ||||
| Lowest quintile | 393 (5.9) | 364 (6.6) | 4634 (6.9) | 3984 (7.2 |
| Not lowest quintile | 6296 (94.1) | 5145 (93.4) | 62 909 (93.1) | 51 771 (92.9) |
| Psychiatric disorders | ||||
| First hospital contact for any psychiatric disorderb,f | ||||
| No | 6211 (92.9) | 5269 (95.6) | 63 577 (94.1) | 53 303 (95.6) |
| Yes | 478 (7.2) | 240 (4.4) | 3967 (5.9) | 2453 (4.4) |
| Type of first hospital contact | ||||
| Inpatient | 76 (15.9) | 52 (21.7) | 591 (14.9) | 496 (20.2) |
| Outpatient | 402 (84.1) | 188 (78.3) | 3375 (85.1 | 1956 (79.8) |
| Mean follow-up in years (SD)b | 16.8 (9.5) | 16.8 (9.3) | 17.0 (9.5) | 16.8 (9.3) |
| Characteristics of child with cancer | ||||
| Sexc | ||||
| Male | 3901 (55.9) | — | ||
| Female | 3084 (44.1) | — | ||
| Vital statusb,g | ||||
| Alive | 5176 (74.0) | — | ||
| Deceased | 1815 (26.0) | — | ||
| Age at diagnosis, yb | ||||
| <1 | 443 (6.3) | — | ||
| 1-4 | 1351 (19.3) | — | ||
| 5-9 | 1431 (20.5) | — | ||
| 10-14 | 1215 (17.4) | — | ||
| 15-19 | 2551 (36.5) | — | ||
| Cancer typeb,h | ||||
| Lymphoid leukemia | 1263 (18.1) | — | ||
| Other leukemia | 382 (5.5) | — | ||
| Lymphoma | 927 (13.3) | — | ||
| Central nervous system tumor | 1757 (25.1) | — | ||
| Bone tumor/soft tissue sarcoma | 751 (10.7) | — | ||
| Other solid tumor | 1911 (27.3) | — | ||
Characteristic assessed 1 year before cancer diagnosis/reference year.
Complete information with no missing values.
Missing values of <2%.
Education was categorized according to ISCED (International Standard Classification of Education) classification (short: early childhood education, primary education and lower secondary education [ISCED levels 0-2]; medium: general upper secondary education, high school programs and vocational upper secondary education, vocational training and education [ISCED level 3]; high: short-cycle tertiary general or vocational education, bachelor’s or equivalent level, master’s or equivalent level, doctoral or equivalent level [ISCED level 4-8]).
Retired parents and parents in education were categorized as “other.”
Refers to first hospital contacts for any psychiatric disorder occurring after the index date (date of child’s cancer diagnosis among case parents/reference date among comparison parents).
Refers to entire follow-up period.
Childhood cancer types were categorized as follows: lymphoid leukemia (International Classification of Childhood Cancer, 1st edition [ICCC1] group I a-b; ICCC3 group I a); other leukemia (ICCC1 group I c-e; ICCC3 group I b-e); lymphoma (II); central nervous system (CNS) tumor (III), bone tumor (VIII)/soft tissue sarcoma (IX), other solid tumor (IV, V, VI, VII, X, XI, XII).
Sociodemographic and Cancer-Related Characteristics
Sociodemographic characteristics of parents and information on the child’s cancer diagnosis were derived from the Central Population Registry (15), Statistics Denmark (14), and the Danish Cancer Registry (18). Parental characteristics included date of birth, period of cancer diagnosis or reference year, death date, emigration date, country of birth, and the following characteristics for the year before cancer diagnosis or reference year: education, place of residence, number of biological or adoptive children, cohabitation, working status, and income. Characteristics of the child with cancer included sex, date of death, age at diagnosis, and cancer type. Cancer types were classified according to the International Classification of Childhood Cancer (ICCC), 1st edition [Birch and Marsden Classification (22)], until 2003 and ICCC 3rd version (23) thereafter and categorized into 6 groups: lymphoid leukemia; other leukemia; lymphoma; central nervous system (CNS) tumor, bone tumor or soft tissue sarcoma, and other solid tumors.
Statistical Analysis
Parents were followed from the date of the child’s cancer diagnosis or reference date (first year 1982) until first hospital contact for any psychiatric disorder, death, emigration, or end of study (August 2017), whichever came first. All analyses were conducted separately for mothers and fathers as we expected the risk of psychiatric disorders to differ by sex (21). We calculated incidence rates per 100 000 person-years of hospital contacts for any psychiatric disorder and specific disorders. Cox proportional hazards models were fitted to estimate hazard ratios (HR) and corresponding 2-sided 95% confidence intervals (CI) for a hospital contact for any psychiatric disorder and specific disorders comparing parents of children with cancer with comparison parents. We used time since date of diagnosis or reference date as the underlying time scale and adjusted the analysis for parental age and child’s year of birth. For the analyses of any psychiatric disorder, we additionally stratified by clinically meaningful time windows of the follow-up period (0-5, 5-10, 10-20, 20-30, and >30 years after date of diagnosis or reference date). We plotted Kaplan-Meier curves for visual presentation of the overall risk over time in case and comparison parents and additionally stratified by cancer type. Results are presented for the entire study period (1982-2017) because interaction tests by period of diagnosis/reference year (1982-1999 vs 2000-2014) provided no evidence for effect modification (all Pinteraction > .05). To evaluate whether the inclusion of outpatient contacts affected our findings, we performed a sensitivity analysis including inpatient contacts only. In another sensitivity analysis, we excluded case and comparison parents of children who died during the follow-up period.
Among case parents, we fitted 2 multivariable Cox models including all sociodemographic and all cancer-related characteristics to identify parents at risk for hospital contacts for any psychiatric disorder. Analyses of risk factors among case parents were stratified by diagnostic period (1982-1999 vs 2000-2014) to account for changes in treatment, diagnostic procedures, and outcomes after childhood cancer over time (24,25). Schoenfeld residual tests were used to test the proportional hazards assumption in all Cox regression models. In the scenario that the proportional hazard assumption was not met, the estimated hazard ratios express the average effect over time. Analyses were performed using Stata version 14.2 (StataCorp LP, College Station, TX).
Results
Study Population
The study cohort included 12 198 case parents (n = 6689 mothers, n = 5509 fathers) and 123 300 comparison parents (n = 67 544 mothers, n = 55 756 fathers; Figure 1). The distribution of sociodemographic characteristics 1 year before diagnosis or reference year was similar between case and comparison parents (Table 1). The differences in cohabitation were introduced by sampling design.
Hospital Contacts for Psychiatric Disorders in Case and Comparison Parents
Mean follow-up after date of diagnosis or reference date was 17 years and similar between case and comparison parents (Table 1). Hospital contacts for psychiatric disorders were overall rare with incidence rates of 426 and 345 cases per 100 000 person-years in case and comparison mothers and 260 and 262 cases per 100 000 person-years in case and comparison fathers (Table 2). Among both case and comparison parents, incidence rates were highest for affective and stress-related disorders.
Comparison of hospital contacts for psychiatric disorders between case and comparison parents
| Group of psychiatric disordersa | Fathers | Mothers | ||||
|---|---|---|---|---|---|---|
| Incidence rateb | Incidence rateb | Incidence rateb | Incidence rateb | HR (95% CI)b | ||
| Case fathers (95% CI) | Comparison fathers (95% CI) | HR (95% CI)c | Case mothers (95% CI) | Comparison mothers (95% CI) | ||
| Any psychiatric disorder | 259.85 (228.97 to 294.89) | 262.11 (251.94 to 272.69) | 0.99 (0.87 to 1.13)d | 426.38 (389.82 to 466.37) | 345.28 (334.70 to 356.20) | 1.23 (1.12 to 1.36)d |
| Organic psychosis | 2.17 (0.54 to 8.66) | 1.50 (0.89 to 2.53) | 1.46 (0.33 to 6.42) | 0.89 (0.13 to 6.33) | 1.48 (0.92 to 2.38) | 0.61 (0.08 to 4.58) |
| Schizophreniae | 19.49 (12.28 to 30.93) | 8.12 (6.49 to 10.17) | 2.39 (1.43 to 4.00) | 20.52 (13.63 to 30.87) | 13.14 (11.21 to 15.42) | 1.56 (1.01 to 2.41)d |
| Affective disorders | 49.83 (37.30 to 66.49) | 76.61 (71.21 to 82.43) | 0.65 (0.48 to 0.88)d | 143.61 (123.06 to 167.60) | 117.68 (111.57 to 124.12) | 1.22 (1.04 to 1.44)d |
| Anxietyf | 11.91 (6.60 to 21.51) | 13.36 (11.21 to 15.92) | 0.89 (0.48 to 1.65) | 34.79 (25.42 to 47.61) | 39.25 (35.79 to 43.05) | 0.89 (0.64 to 1.23) |
| Stress to related disorders | 82.28 (65.72 to 103.03) | 72.77 (67.50 to 78.44) | 1.13 (0.89 to 1.43) | 142.72 (122.23 to 166.64) | 98.18 (92.61 to 104.08) | 1.45 (1.23 to 1.71)d |
| Adult personality and behavior disorders | 4.33 (1.63 to 11.54) | 7.16 (5.63 to 9.10) | 0.60 (0.22 to 1.66) | 9.81 (5.43 to 17.72) | 15.75 (13.62 to 18.22) | 0.61 (0.33 to 1.13) |
| Disorders related to psychoactive substance use | 44.39 (32.69 to 60.29) | 41.35 (37.43 to 45.68) | 1.07 (0.78 to 1.48)d | 25.87 (17.98 to 37.22) | 20.19 (17.75 to 22.97) | 1.28 (0.87 to 1.88)d |
| Disorders due to known somatic condition | 22.74 (14.82 to 34.87) | 22.76 (19.90 to 26.03) | 1.02 (0.65 to 1.60) | 13.38 (8.07 to 22.19) | 12.88 (10.96 to 15.12) | 1.07 (0.63 to 1.82) |
| Somatoform and other neurotic disorders | 3.25 (1.05 to 10.08) | 2.99 (2.07 to 4.33) | 1.08 (0.33 to 3.57) | 12.49 (7.40 to 21.09) | 8.09 (6.61 to 9.92) | 1.55 (0.88 to 2.71) |
| Other psychiatric disorderg | 29.49 (12.28 to 30.93) | 15.49 (13.17 to 18.23) | 1.26 (0.77 to 2.05) | 22.30 (15.07 to 33.00) | 18.63 (16.29 to 21.30) | 1.20 (0.79 to 1.81)d |
If multiple psychiatric disorders were recorded in the same person, only the diagnosis of the first hospital contact for any psychiatric disorder was considered. CI = confidence interval; HR = hazard ratio.
Calculated per 100 000 person-years.
Hazard ratios from Cox proportional hazard models adjusted for parental age at diagnosis/reference year and child’s year of birth: HR > 1 indicate higher likelihood of first hospital contact for any psychiatric disorder and individual psychiatric disorder groups in case parents than comparison parents. HR < 1 indicate lower likelihood of first hospital contact for any psychiatric disorders and individual psychiatric disorder groups in case parents than comparison parents.
Assumption of proportional hazards not met (Schoenfeld residual test <0.05).
Includes other, nonaffective psychoses.
Includes obsessive-compulsive disorder and dissociative disorders.
Includes emotional and behavioral disorders specific to childhood and adolescence (ie, attention deficit hyperactivity disorder, obsessive-compulsive disorder, autism spectrum disorders, and developmental disorders and mental retardation) and other emotional and behavioral disorders.
Using comparison parents as reference, we noted a 23% higher risk of hospital contacts for any psychiatric disorder in case mothers (average over follow-up period: HR = 1.23, 95% CI = 1.12 to 1.36) but not among case fathers (HR = 0.99, 95% CI = 0.87 to 1.13; Table 2). Stratification by follow-up period showed increased hazards among case mothers in the first 20 years and no effect more than 20 years after date of diagnosis or reference date (Supplementary Table 2, available online). Among case fathers, no such patterns were observed. The sensitivity analysis including only inpatient contacts showed similar patterns (HRmothers = 1.32, 95% CI = 1.04 to 1.67; HRfathers = 1.06, 95% CI = 0.79 to 1.41). For case mothers, the incidence of hospital contacts for any psychiatric disorder was higher over the entire follow-up period of up to 35 years (Figure 2). This was most pronounced for mothers of children diagnosed with leukemia or CNS tumors (Supplementary Figure 1, available online). We observed increased risks of schizophrenia and other nonaffective psychoses in both case mothers (Table 2; HR = 1.56, 95% CI = 1.01 to 2.41) and case fathers (HR = 2.39, 95% CI = 1.43 to 4.00). However, whereas an increased risk was observed for affective disorders in case mothers relative to comparison mothers (HR = 1.22, 95% CI = 1.04 to 1.44), the respective risk was lower in case fathers (HR = 0.65, 95% CI = 0.48 to 0.88). Case mothers were also found to be at higher risk of stress-related disorders (HR = 1.45, 95% CI = 1.23 to 1.71). Excluding parents of deceased children resulted in similar findings (Supplementary Table 3, available online).
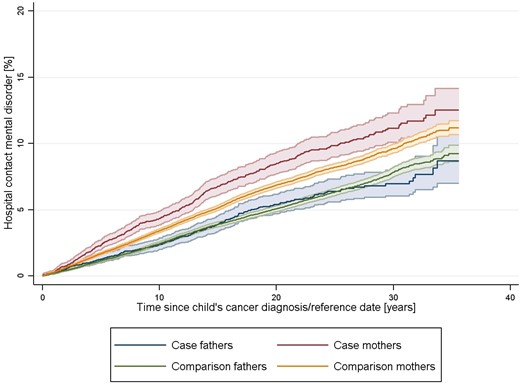
Risk of hospital contact for any psychiatric disorder during the follow-up period in case and comparison parents
Risk Factors of Hospital Contacts for Psychiatric Disorders
The associations between sociodemographic characteristics and psychiatric disorders were largely similar between case and comparison parents (Table 3; Supplementary Table 4, available online). Among case parents, we found that those who had not been working 1 year before the child’s cancer diagnosis were at an increased risk of hospital contacts for psychiatric disorders in both diagnostic periods (Table 3). Elevated risks were further observed among case parents aged younger than 30 years, with shorter education and higher income, and parents not born in Denmark. Cohabitation appeared to have a protective effect among mothers in both diagnostic periods. No consistent patterns were observed for place of residence and number of children.
Parental sociodemographic risk factors of hospital contacts for any psychiatric disorder in case parents from multivariable Cox regression models, stratified by diagnostic period
| Sociodemographic characteristics of parents | Diagnostic period: 1982-1999 | Diagnostic period: 2000-2014 | ||
|---|---|---|---|---|
| Case fathers (n = 2848) | Case mothers (n = 3427) | Case fathers (n = 2661) | Case mothers (n = 3262) | |
| HR (95% CI)a | HR (95% CI)a | HR (95% CI)a | HR (95% CI)a | |
| Age, y | ||||
| <30 | 2.31 (1.26 to 4.24) | 1.27 (0.90 to 1.78) | 1.29 (0.51 to 3.26) | 1.71 (1.03 to 2.83) |
| 30-34 | Referent | Referent | Referent | Referent |
| 35-39 | 1.37 (0.76 to 2.46) | 0.93 (0.65 to 1.33) | 1.08 (0.49 to 2.37) | 1.02 (0.62 to 1.70) |
| 40- 44 | 1.28 (0.70 to 2.33) | 0.87 (0.59 to 1.28) | 1.46 (0.70 to 3.07) | 0.99 (0.59 to 1.65) |
| ≥45 | 2.26 (1.29 to 3.95) | 0.86 (0.55 to 1.37) | 0.89 (0.41 to 1.92) | 0.71 (0.39 to 1.29) |
| Education | ||||
| Short | 1.22 (0.82 to 1.81) | 1.36 (1.04 to 1.77) | 1.65 (0.95 to 2.89) | 1.14 (0.75 to 1.73) |
| Medium | Referent | Referent | Referent | Referent |
| Higher | 1.06 (0.69 to 1.62) | 0.76 (0.54 to 1.07) | 1.02 (0.60 to 1.79) | 0.90 (0.61 to 1.34) |
| Country of birth | ||||
| Denmark | Referent | Referent | Referent | Referent |
| Other | 0.74 (0.33 to 1.64) | 1.54 (0.93 to 2.54) | 3.05 (1.72 to 5.39) | 1.27 (0.76 to 2.10) |
| Place of residency | ||||
| Copenhagen and suburbs | Referent | Referent | Referent | Referent |
| Provincial cities | 1.02 (0.69 to 1.52) | 1.01 (0.76 to 1.33) | 1.20 (0.71 to 2.02) | 1.04 (0.71 to 1.51) |
| Rural | 0.71 (0.46 to 1.10) | 0.74 (0.54 to 1.00) | 0.75 (0.38 to 1.48) | 0.83 (0.51 to 1.33) |
| Number of biological/adoptive children | ||||
| ≤1 child | Referent | Referent | Referent | Referent |
| 2 children | 1.10 (0.73 to 1.66) | 0.94 (0.71 to 1.24) | 1.47 (0.78 to 2.77) | 0.67 (0.46 to 0.99) |
| ≥3 children | 1.27 (0.78 to 2.05) | 0.82 (0.57 to 1.18) | 1.50 (0.75 to 3.00) | 0.70 (0.44 to 1.10) |
| Cohabitation | ||||
| No | Referent | Referent | Referent | Referent |
| Yes | 1.07 (0.47 to 2.46) | 0.53 (0.41 to 0.70) | 0.75 (0.30 to 1.88) | 0.41 (0.28 to 0.58) |
| Working status | ||||
| Not working | 2.38 (1.41 to 4.02) | 1.67 (1.26 to 2.23) | 1.97 (1.01 to 3.84) | 2.50 (1.68 to 3.71) |
| Working | Referent | Referent | Referent | Referent |
| Other | 0.93 (0.23 to 3.84) | 1.18 (0.60 to 2.34) | 0.55 (0.13 to 2.32) | 0.54 (0.19 to 1.50) |
| Income | ||||
| Lowest quintile | Referent | Referent | Referent | Referent |
| Not lowest quintile | 1.44 (0.84 to 2.49) | 1.34 (0.90 to 1.98) | 2.17 (1.11 to 4.24) | 1.37 (0.68 to 2.78) |
Hazard ratios from multivariable Cox proportional hazard models (mutually adjusted): HR > 1 indicate higher likelihood of first hospital contact for any psychiatric disorder. HR < 1 indicate lower likelihood of first hospital contact for any psychiatric disorder. CI = confidence interval; HR = hazard ratio.
In terms of cancer-related characteristics, we found an increased risk of psychiatric disorders in parents of deceased children diagnosed in 2000-2014 (Table 4; HRmothers = 1.92, 95% CI = 1.35 to 2.72; HRfathers = 1.67, 95% CI = 0.99 to 2.81). Notably, no such patterns were noted for the diagnostic period 1982-1999. Elevated risks were also identified among mothers of children diagnosed at a younger age with larger effects in the more recent diagnostic period (HR1-4 years = 1.69, 95% CI = 1.10 to 2.59). Fathers of children diagnosed with lymphoid leukemia, CNS tumor, and a bone tumor or soft tissue sarcoma were at increased risk of psychiatric disorders in the diagnostic period from 1982 to 1999. This effect was no longer evident in the more recent diagnostic period and not observed among mothers.
Cancer-related risk factors of hospital contacts for any psychiatric disorder in case parents from multivariable Cox regression models, stratified by diagnostic period
| Characteristics of the child with cancer | Diagnostic period: 1982-1999 | Diagnostic period: 2000-2014 | ||
|---|---|---|---|---|
| Case fathers (n = 2848) | Case mothers (n = 3427) | Case fathers (n = 2661) | Case mothers (n = 3262) | |
| HR (95% CI)a,b | HR (95% CI)a | HR (95% CI)a | HR (95% CI)a | |
| Sex | ||||
| Male | Referent | Referent | Referent | Referent |
| Female | 0.94 (0.68 to 1.29) | 0.92 (0.74 to 1.17) | 1.00 (0.65 to 1.55) | 0.76 (0.56 to 1.03) |
| Vital statusc | ||||
| Alive | Referent | Referent | Referent | Referent |
| Deceased | 0.99 (0.71 to 1.38) | 1.06 (0.84 to 1.34) | 1.67 (0.99 to 2.81) | 1.92 (1.35 to 2.72) |
| Age at diagnosis, y | ||||
| <1 | 1.09 (0.55 to 2.18) | 1.32 (0.82 to 2.11) | 0.95 (0.36 to 2.53) | 1.66 (0.90 to 3.06) |
| 1-4 | 1.18 (0.75 to 1.86) | 1.45 (1.05 to 2.00) | 1.14 (0.61 to 2.15) | 1.69 (1.10 to 2.59) |
| 5-9 | 1.16 (0.74 to 1.81) | 1.08 (0.78 to 1.51) | 0.88 (0.44 to 1.78) | 1.51 (0.97 to 2.34) |
| 10-14 | 0.90 (0.54 to 1.48) | 1.18 (0.84 to 1.66) | 1.78 (0.98 to 3.23) | 1.08 (0.66 to 1.78) |
| 15-19 | Referent | Referent | Referent | Referent |
| Cancer typed | ||||
| Lymphoid leukemia | 1.87 (1.13 to 3.07) | 1.10 (0.78 to 1.55) | 0.99 (0.51 to 1.94) | 0.82 (0.51 to 1.33) |
| Other leukemia | 1.54 (0.72 to 3.29) | 0.83 (0.47 to 1.48) | 1.08 (0.44 to 2.69) | 1.24 (0.68 to 2.24) |
| Lymphoma | 1.20 (0.64 to 2.28) | 0.81 (0.52 to 1.26) | 1.20 (0.59 to 2.45) | 1.17 (0.70 to 1.94) |
| CNS tumor | 1.57 (0.97 to 2.53) | 1.09 (0.79 to 1.49) | 0.90 (0.48 to 1.66) | 0.94 (0.61 to 1.44) |
| Bone tumor/soft tissue sarcoma | 1.73 (0.97 to 3.09) | 1.17 (0.78 to 1.74) | 0.46 (0.17 to 1.25) | 0.64 (0.34 to 1.20) |
| Other solid tumor | Referent | Referent | Referent | Referent |
Hazard ratios from multivariable Cox proportional hazard models (mutually adjusted): HR > 1 indicate higher likelihood of first hospital contact for any psychiatric disorder. HR < 1 indicate lower likelihood of first hospital contact for any psychiatric disorder. CI = confidence interval; CNS = central nervous system; HR = hazard ratio.
Assumption of proportional hazards not met (Schoenfeld residual test <0.05).
Refers to entire follow-up period.
Childhood cancer types were categorized as follows: lymphoid leukemia (International Classification of Childhood Cancer, 1st edition [ICCC1] group I a-b; ICCC3 group I a); other leukemia (ICCC1 group I c-e; ICCC3 group I b-e); lymphoma (II); central nervous system (CNS) tumor (III), bone tumor (VIII)/soft tissue sarcoma (IX), other solid tumor (IV, V, VI, VII, X, XI, XII).
Discussion
This nationwide cohort study of more than 135 000 parents in Denmark showed that hospital contacts for psychiatric disorders were overall rare. Whereas mothers of children with cancer had a modestly increased risk of hospital contacts for psychiatric disorders compared with mothers of cancer-free children, we observed no increased risk among fathers. Sociodemographic risk factors for psychiatric disorders were largely similar in parents of children with cancer and parents of cancer-free children. In terms of cancer-related risk factors, we found elevated risks among parents of deceased children and parents of children diagnosed with cancer at younger ages.
Literature reviews on psychological outcomes in parents of children with cancer indicate worse findings compared with the general population (7–11). We are only aware of 1 population- and registry-based study from Canada by van Warmerdam and colleagues (13) that used clinically diagnosed mental health disorders. This study found a 40% increased risk of mental health–related outpatient visits among 4773 mothers of children with cancer compared with population controls (13), which is somewhat higher than the averaged 23% increase in risk for both in- and outpatient hospital contacts for psychiatric disorders observed in our study over the entire follow-up period. National differences in access to an organization of health care and registration of mental health disorders may partly explain these findings. Van Warmerdam and colleagues (13) observed a constantly elevated risk among mothers of children with cancer until 20 years after diagnosis. Our study with a follow-up of up to 35 years after diagnosis confirmed this finding and revealed that the risk is no longer increased beyond more than 20 years after diagnosis. Nevertheless, these findings indicate a prolonged mental health burden even years after diagnosis. Although psychiatric disorders were overall rare, the cancer experience may have reduced some mothers’ ability to cope with the sum of stressors including worries related to cancer relapse and treatment-induced late effects in their child (7), couple and family conflicts (5), or persisting socioeconomic challenges (6).
We found no evidence of increased risks for psychiatric disorders in fathers of children with cancer, which had not been previously studied based on medically ascertained outcomes. Evidence from studies using self-reported information is inconsistent, with a tendency toward worse outcomes among mothers compared with fathers (7–10,26). This may be explained by the overall higher prevalence of mental disorders among women or reflect the more traditional parenting roles with the mother as primary caregiver (27). Alternatively, our study only evaluated hospital contacts for psychiatric disorders that may not capture mild to moderate disorders fathers of children with cancer may suffer from.
A better understanding of the risk for specific psychiatric disorders is essential to guide clinical practice in early detection and potential treatment. Similar to the Canadian study (13), we found that averaged over the entire follow-up period, mothers of children with cancer were at increased risk of affective disorders such as depression, which may be intuitively related to the emotional burden of having a child with cancer (7–9). Whereas van Warmerdam and colleagues found that mothers of children with cancer were at highest risk of anxiety disorders (13), this was not seen in our study. Van Warmerdam and colleagues assigned ICD codes related to stress reactions and adjustment disorders to anxiety, whereas we allocated separate groups for these disorders. Indeed, we observed increased risks for stress-related disorders including posttraumatic stress symptoms among mothers. Together with the observed increased prescriptions of hypnotics and anxiolytics to treat sleep disorders, severe anxiety, or acute stress-related anxiety (12), these findings collectively emphasize the importance of adequate stress-reaction management in this population. Remarkably, both mothers’ and fathers’ risks of schizophrenia and other nonaffective psychoses were elevated in our study. Detailed diagnostic interviews may contribute to further elaborate on this finding.
The identification of vulnerable groups of parents of children with cancer is essential for the development of tailored support strategies. Whereas sociodemographic predictors of psychiatric disorders were mostly similar to the general population (Supplementary Table 3, available online), less is known about the role of cancer-related characteristics. We identified elevated risks for psychiatric disorders among parents of deceased children. Increased psychiatric morbidity compared with the general population has previously been described among bereaved parents of children with cancer (11,28). Bereavement was also associated with higher rates of mental health–related outpatient visits among mothers of children with cancer in Canada (13). Intuitively, these findings may be explained by profound grief responses, disruptions of family structure, and feelings of parental guilt. We further identified elevated risks of psychiatric disorders among mothers of children diagnosed at a younger age. This may be attributed to the generally higher caregiving demands of younger children limiting parental resources to cope with disease-related stressors (6,9). In our study, the child’s cancer type was only associated with the risk of psychiatric disorders among fathers for the earlier diagnostic period from 1982 to 1999. The study from Canada found no association with the child’s cancer type (13). The elevated risk among fathers of children with lymphoid leukemia, CNS tumors, and bone tumor or soft tissue sarcoma in 1982-1999 may be related to the relatively long-lasting treatment regimens, poorer prognosis, and increased risks of cancer relapse during that time. However, the lack of treatment and relapse data precluded an in-depth evaluation.
An early and ongoing monitoring of mental health needs in parents is a crucial component of a comprehensive cancer treatment (11) and has been proposed as a standard in pediatric oncology (29). Support services targeting the mental health of family members are often limited to the child’s in-patient treatment. In contrast to well-established long-term care guidelines for childhood cancer survivors (30), such resources are often lacking for other family members (13). As recently recommended (13), risk-based long-term care for family members may be integrated into the child’s survivorship care. Acknowledging the mental health needs of parents of children with cancer is crucial to mitigate individual impairments in quality of life, somatic health problems (7), and societal costs related to health-care utilization, productivity loss, and sick leave (31).
A major strength of this nationwide and population-based cohort study refers to the inclusion of a large sample of parents and the use of high-quality registry data with virtually no loss to follow-up, minimizing the risk of selection and information bias. However, because of the child’s cancer experience, the parents may be more closely monitored, which may have introduced surveillance bias to some extent. We used hospital-based diagnoses by trained physicians as markers of disease outcome. Although we cannot rule out that misclassification of psychiatric disorders may exist, we expect this to be nondifferential between case and comparison parents. Our study may have underestimated the overall burden of psychiatric disorders as we only included hospital contacts that may refer to more severe psychiatric disorders. Mild to moderate disorders may more often be diagnosed and treated by general practitioners or private psychiatric practices in Denmark (20) or may remain undetected and untreated. Several analyses failed the proportional hazard assumption and hence preclude interferences for specific time windows after diagnosis. Furthermore, the problem of multiple comparisons needs to be acknowledged with 1 out of 20 tests to be statistically significant by chance given the 5% statistical significance level. Finally, additional studies may be warranted to study parents with mental health difficulties prior to the child’s cancer diagnosis and how their child’s disease affects their risk of psychiatric disorders later in life.
In conclusion, hospital contacts for psychiatric disorders were overall rare among parents of children with cancer. Health-care professionals should draw attention to subgroups of vulnerable parents to meet their needs of support and adequate treatment.
Funding
This work was supported by the Swiss National Science Foundation (Grant No. P2LUP3_175288 to LM).
Notes
Role of the funders: The funding sources had no influence on the design and conduct of the study or on the collection, management, analysis, and interpretation of the data. The sources have not seen the manuscript during preparation, review, or approval and had no influence on the decision to submit the manuscript for publication.
Disclosures: The authors have no conflicts of interest to disclose.
Author contributions: LM and FE were the principal investigators; conceptualized the study; contributed to the data collection, data analyses, and interpretation; and contributed to the preparation, editing, and review of the article. TTN and AK contributed to the acquisition and preparation of data. LEF, PEB, MH, SKK, CEK, JFW contributed to the data interpretation and critically reviewed and revised the article.
Data Availability
Access to individual-level data is governed by Danish authorities. These include the Danish Data Protection Agency, the Danish Health Data Authority, and Statistics Denmark. Each scientific project must be approved before initiation, and approval is granted to a specific Danish research institution. Researchers at Danish research institutions may obtain the relevant approval and access data. International researchers may gain data access if governed by a Danish research institution having the needed approval and data access. All data access requests should be directed to the corresponding author.
