


Abstract
Physician ownership of imaging equipment has been shown to be associated with greater use of low-value imaging. However, it is unclear whether ownership also influences utilization of appropriate imaging. We conducted a cohort study of older adults diagnosed with three non-Hodgkin lymphomas with distinct guideline recommendations concerning the use of positron emission tomography (PET) during staging (recommended, not recommended, or equivocal). We found patients who were treated by oncologists with PET ownership were more likely to receive a staging PET regardless of lymphoma subtype. However, the difference in utilization by ownership status was smallest (6%, 95% confidence interval = 2% to 11%, P = .01) in the setting of diffuse large B cell lymphoma, where consensus guidelines recommend routine use of PET. Overall, removing financial incentives related to imaging self-referral may reduce utilization during cancer care, with the potential for greatest impact on imaging of equivocal or low clinical utility.
Ownership or leasing arrangements that allow a physician to benefit financially from referring their patients for tests remains controversial. These self-referral practices have been shown to be associated with increased utilization in settings where diagnostic imaging offers low clinical utility (1–4). Whether the impact of these financial arrangements on imaging utilization varies across settings with different clinical utility and imaging guideline recommendations is unknown.
To address this question, we conducted a cohort study using Surveillance, Epidemiology, and End Results Medicare data. We included beneficiaries aged 66 years and older with newly diagnosed diffuse large B cell lymphoma (DLBCL), follicular lymphoma (FL), or chronic lymphocytic leukemia/small lymphocytic lymphoma (CLL/SLL) to capture discrete clinical settings where the utility of staging positron emission tomography (PET) varies by histology (5,6). During our study period of 2004–2014, PET was recognized in clinical guidelines as being “essential” for staging DLBCL, “useful in select cases” of FL, and “generally not useful” for CLL/SLL (7–9). We hypothesized ownership would have the greatest impact on PET utilization in FL and CLL/SLL, where the utility of PET is comparable to standard computer tomography imaging (7–9).
Our study cohort included Medicare beneficiaries initiating first-line immunochemotherapy in the community setting. Beneficiaries were assigned to their treating oncologist using Healthcare Common Procedure Coding System codes that identified immunochemotherapy in Medicare claims (10). Our main explanatory variable was whether a beneficiary’s treating oncologist was listed as the billing provider on at least one PET claim, providing evidence of ownership or self-referral (1,2,4). To accommodate changes in ownership or leasing arrangements, we evaluated Medicare PET claims within a 12-month look-back period from each treatment initiation to categorize active ownership status. Our primary outcome was a claim for PET or combined PET/computed tomography imaging within 60 days prior to first-line treatment. We evaluated pretreatment staging rather than initial staging at diagnosis because our study included histologies (FL and CLL/SLL) where patients can be observed for years prior to requiring lymphoma-directed therapy (7–9).
In addition to descriptive statistics and bivariate analysis, we used linear probability models to estimate differences in receipt of PET by ownership status for our three non-Hodgkin lymphoma (NHL) subtypes. Our multivariable models included year of treatment, patient sociodemographics, Elixhauser comorbidity index, disability status (11), and lymphoma stage (12). We used χ2 to perform pairwise comparison of our linear probability estimates across the three models (13). Two-sided statistical tests were completed using SAS version 9.4 (SAS Institute Inc., Cary, NC) with alpha = .05.
We identified 9879 Medicare beneficiaries diagnosed with DLBCL (n = 4917), FL (n = 2433), or CLL/SLL (n = 2529) initiating first-line therapy through 2014. The median age was 75 years (interquartile range = 71–81 years), and 50.3% were male (Table 1). A total of 2014 oncologists were linked to our beneficiaries, with 178 (8.8%) listed as billing providers on at least one PET claim during our study period. In total, 735 of 9879 (7.4%) beneficiaries initiated therapy with active PET owners. These beneficiaries were more likely to receive a staging PET regardless of lymphoma subtype compared to those treated by non-owners (DLBCL: 72.8% vs 65.6%, P = .005; FL: 71.3% vs 53.2%, P < .001; CLL/SLL: 29.4% vs 14.8%, P < .001) (Supplementary Figure 1, available online).
Patient characteristics*
| Characteristic | Overall | Treated by non-PET owning oncologist | Treated by PET owning oncologist | P |
|---|---|---|---|---|
| No. (%) | No. (%) | No. (%) | ||
| Entire cohort | 9879 | 9144 (92.6) | 735 (7.4) | — |
| Histology | .37 | |||
| CLL/SLL | 2529 (25.6) | 2325 (25.4) | 204 (27.8) | — |
| DLBCL | 4917 (49.8) | 4560 (49.9) | 357 (48.6) | — |
| FL | 2433 (24.6) | 2259 (24.7) | 174 (23.7) | — |
| Age group, y | .56 | |||
| 66–69 | 1869 (18.9) | 1715 (18.8) | 154 (21.0) | — |
| 70–74 | 2558 (25.9) | 2376 (26.0) | 182 (24.8) | — |
| 75–79 | 2463 (24.9) | 2279 (24.9) | 184 (25.0) | — |
| 80–84 | 1885 (19.1) | 1744 (19.1) | 141 (19.2) | — |
| ≥85 | 1104 (11.2) | 1030 (11.3) | 74 (10.1) | — |
| Female sex | 4912 (49.7) | 4525 (49.5) | 387 (52.7) | .10 |
| Race | <.001 | |||
| Non-Hispanic white | 8633 (87.4) | 8015 (87.7) | 618 (84.1) | — |
| Non-Hispanic black | 300 (3.0) | 282 (3.1) | 18 (2.5) | — |
| Non-Hispanic other | 432 (4.4) | 397 (4.3) | 35 (4.8) | — |
| Hispanic | 514 (5.2) | 450 (4.9) | 64 (8.7) | — |
| Married | 5700 (57.7) | 5290 (57.9) | 410 (55.8) | .27 |
| Year of treatment | <.001 | |||
| 2004–2005 | 1703 (17.2) | 1639 (17.9) | 64 (8.7) | — |
| 2006–2007 | 2094 (21.2) | 1917 (21.0) | 177 (24.1) | — |
| 2008–2009 | 2239 (22.7) | 2050 (22.4) | 189 (25.7) | — |
| 2010–2011 | 1951 (19.8) | 1772 (19.4) | 179 (24.4) | — |
| 2012–2014 | 1892 (19.2) | 1766 (19.3) | 126 (17.1) | — |
| Geographic region | <.001 | |||
| Midwest | 1452 (14.7) | 1419 (15.5) | 33 (4.5) | — |
| Northeast | 1876 (19.0) | 1836 (20.1) | 40 (5.4) | — |
| South | 2410 (24.4) | 2229 (24.4) | 181 (24.6) | — |
| West | 4141 (41.9) | 3660 (40.0) | 481 (65.4) | — |
| HS education (% adults ≥25 in zip code beyond HS education) | <.001 | |||
| ≥70 | 2113 (21.4) | 1895 (20.7) | 218 (29.7) | — |
| 60 to <70 | 1626 (16.5) | 1534 (16.8) | 92 (12.5) | — |
| 50 to <60 | 2361 (23.9) | 2227 (24.4) | 134 (18.2) | — |
| 40 to <50 | 1741 (17.6) | 1627 (17.8) | 114 (15.5) | — |
| < 40 | 2038 (20.6) | 1861 (20.4) | 177 (24.1) | — |
| Metro residency | 8209 (83.1) | 7629 (83.4) | 580 (78.9) | .002 |
| Medicaid dual coverage | 909 (9.2) | 808 (8.8) | 101 (13.7) | <.001 |
| Elixhauser comorbidity index | .58 | |||
| None | 3114 (31.5) | 2871 (31.4) | 243 (33.1) | — |
| 1–2 | 4122 (41.7) | 3827 (41.9) | 295 (40.1) | — |
| >3 | 2643 (26.8) | 2446 (26.8) | 197 (26.8) | — |
| Disabled | 735 (7.4) | 664 (7.3) | 71 (9.7) | .02 |
| Combined stage (Ann Arbor and CLL/SLL algorithm) | .03 | |||
| Early/Limited | 3386 (34.3) | 3135 (34.3) | 251 (34.2) | — |
| Advanced | 4202 (42.5) | 3916 (42.8) | 286 (38.9) | — |
| Unknown | 2291 (23.2) | 2093 (22.9) | 198 (26.9) | — |
CLL/SLL = chronic lymphocytic leukemia/small lymphocytic lymphoma; DLBCL = diffuse large B cell lymphoma; FL = follicular lymphoma; HS = high school; metro = metropolitan status; PET = positron emission tomography.
On adjusted analyses, the probability of receiving PET was 17% higher (95% confidence interval [CI] = 10% to 24%, P < .001) for beneficiaries treated by physicians who were PET owners compared to non-owners in the setting of FL, where consensus guidelines on PET are equivocal, and 13% higher (95% CI = 6% to 20%, P <.001) in the setting of CLL/SLL, where consensus guidelines recommend against PET. However, the difference between owners and non-owners was smaller (6%, 95% CI = 2% to 11%, P =.01) in the setting of DLBCL, where guidelines recommend use of PET. On pairwise testing, the association between PET ownership and staging differed between DLBCL and FL settings (z = 2.48, P = .04) (Figure 1).
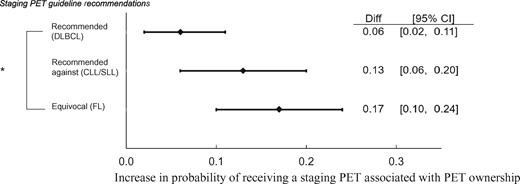
Forest plot of differences in linear probability estimates of pretreatment positron emission tomography by ownership and histology. *DLBCL vs FL; P < 0.05 on pairwise testing. Our three separate linear probability models were adjusted for age, sex, race, marital status, year of treatment, geographic region, metropolitan residency, Medicaid dual eligibility status, Elixhauser comorbidity index, disability status, and lymphoma stage. CI = confidence interval; CLL/SLL = chronic lymphocytic leukemia/small lymphocytic lymphoma; Diff = difference in linear probability estimates; DLBCL = diffuse large B cell lymphoma; FL = follicular lymphoma; PET = positron emission tomography
Prior research has also found imaging self-referral arrangements to be associated with greater utilization of diagnostic imaging (1–4). However, this research focused on clinical settings where imaging offers low or marginal clinical utility, limiting the ability to address whether ownership is associated with appropriateness of scans. By evaluating three unique NHL settings with differing guideline recommendations, we set out to measure the association between ownership and appropriateness of staging PET. We found imaging ownership to be associated with higher rates of PET staging across NHL settings. However, the difference in PET staging between patients receiving care from PET owners vs non-owners was smallest in the setting where PET is of high clinical utility and recommended by guidelines.
Although our analysis offers novel findings, limitations exist. Appropriateness of imaging may depend on patient characteristics and symptoms not readily apparent in claims. This has limited the ability of prior work that focused on settings of lower back pain and headache to assess appropriateness of imaging (2,4). Although staging for NHL is less influenced by patient characteristics outside of the known histologic diagnosis, appropriateness of PET staging could be influenced by whether patients are candidates for treatment with curative intent. However, these patient factors are likely to be relatively balanced among patients seeing PET owners and non-owners. Further, we restricted our DLBCL cohort to beneficiaries well enough to receive cytotoxic chemotherapy and adjusted for comorbidities and disability status in our multivariable models (11) (Supplementary Table 1, available online). Future studies outside of NHL and the Medicare population may be helpful to assess whether self-referral practices impact both appropriate and inappropriate testing.
In conclusion, Medicare beneficiaries newly diagnosed with NHL had greater utilization of PET staging when treated by oncologists with financial incentives tied to PET imaging. Ownership had the greatest impact on PET staging in the setting where clinical guidelines are equivocal (FL), with lesser effect in the setting where PET is recommended (DLBCL). Overall, policies limiting imaging self-referral practices may reduce utilization during cancer care, with greatest influence on settings where imaging is of equivocal or low clinical utility.
Funding
This work was supported by the National Center for Advancing Translational Science (CTSA grant KL2 TR001862 to SFH).
Note
Affiliations of authors: Department of Internal Medicine, Section of Hematology (SFH, AMZ, SG, NAP, SDG) and Cancer Outcomes, Public Policy, and Effectiveness Research (COPPER) Center (SFH, WZ, JRH, RW, AMZ, SG, XM, CPG, AJD), Yale University, New Haven, CT; Department of Chronic Disease Epidemiology (RW, XM) and Department of Health Policy and Management (AJD), Yale School of Public Health, New Haven, CT.
References
