


Abstract
Multidisciplinary cancer care (neoadjuvant chemotherapy followed by radical cystectomy or trimodality therapy) is crucial for outcome of muscle-invasive bladder cancer (MIBC), a potentially curable illness. Medicaid expansion through Affordable Care Act (ACA) increased insurance coverage especially among patients of racial minorities. This study aims to investigate the association between Medicaid expansion and racial disparity in timely treatment in MIBC.
This quasi-experimental study analyzed Black and White individuals aged 18-64 years with stage II and III bladder cancer treated with neoadjuvant chemotherapy followed by radical cystectomy or trimodality therapy from National Cancer Database 2008-2018. Primary outcome was timely treatment started within 45 days following cancer diagnosis. Racial disparity is the percentage-point difference between Black and White patients. Patients in expansion and nonexpansion states were compared using difference-in-differences and difference-in-difference-in-differences analyses, controlling for age, sex, area-level income, clinical stage, comorbidity, metropolitan status, treatment type, and year of diagnosis.
The study included 4991 (92.3% White, n = 4605; 7.7% Black, n = 386) patients. Percentage of Black patients who received timely care increased following the ACA in Medicaid expansion states (54.5% pre-ACA vs 57.4% post-ACA) but decreased in nonexpansion states (69.9% pre-ACA vs 53.7% post-ACA). After adjusting covariates, Medicaid expansion was associated with a net 13.7 percentage-point reduction of Black–White patient disparity in timely receipt of MIBC treatment (95% confidence interval = 0.5% to 26.8%; P < .01).
Medicaid expansion was associated with statically significant reduction in racial disparity between Black and White patients in timely multidisciplinary treatment for MIBC.
Timely treatment is critical for outcomes in muscle-invasive bladder cancer (MIBC), a potentially curable disease. Both recommended MIBC treatments, namely, neoadjuvant chemotherapy followed by radical cystectomy (NAC+RC) and trimodality therapy (TMT), require close multidisciplinary collaborations between medical oncologists, urologists, and/or radiation oncologists (1). Racial minority patients often endure considerable treatment delays and impediments to high-quality multidisciplinary cancer care because of lack of health insurance (2), leading to worsened patient experience and unfavorable clinical results (3).
Medicaid expansion is a major provision of the 2010 Patient Protection and Affordable Care Act (ACA), expanding Medicaid coverage eligibility to 138% of the federal poverty level (4). Despite its primary goal of expanding health-care coverage for all persons younger than age 65 years, the US Supreme Court declared the Medicaid expansion optional for states (4). Twenty-five US states and the District of Columbia adopted the Medicaid expansion provision in January 2014; other states opted for the expansion later or remained opted out as of 2023 (4).
Previous research showed that Medicaid expansion was associated with increased insurance coverage, cancer screening, and earlier stage at disease diagnosis (5). A recent study showed evidence for the expansion reducing racial disparities in timely systemic treatment for patients with advanced cancer (6). However, limited data are available on the effect of Medicaid expansion on racial disparities in timely, multidisciplinary, curative treatment for MIBC patients. To inform future health policy and team-based cancer care, this study aimed to examine the changes in Black–White patient disparities in timely therapy of MIBC following the ACA–Medicaid expansion.
Methods
Study participants
The National Cancer Database (NCDB), a program co-sponsored by the Commission on Cancer of the American College of Surgeons and the American Cancer Society, is a nationwide facility-based cancer registry that collects information on approximately 70% of all new invasive cancer diagnoses in the United States (7).
We studied patients newly diagnosed with primary stage II-III MIBC from January 1, 2008, to December 31, 2018. We only included patients who had malignant urothelial bladder cancer and received either NAC+RC or TMT. We chose this patient group as they received category 1 recommended treatment according to the NCCN guideline. Urothelial bladder cancer was selected by histology codes: 8120, 8130, 8131, 8082, 8122, 8031, and 8020. Consistent with previous study (8), NAC+RC was identified as any chemotherapy prior to radical cystectomy (Facility Oncology Registry Data Standards appendix: 50, 60-64, 70-74). We identified TMT from the NCDB database as local surgery (Facility Oncology Registry Data Standards appendix: 20-25, 30) with any chemotherapy and any radiation (5).
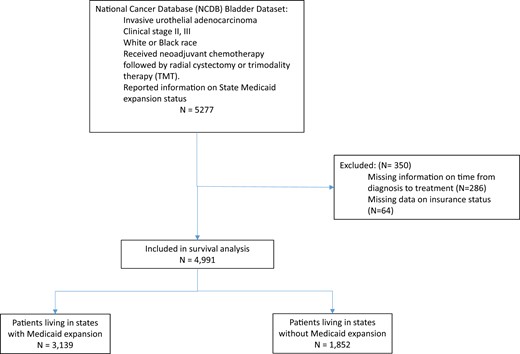
To compare the disparity between Black and White patients in receiving timely care, we exclusively included White and Black patients aged 40-64 years. Patients missing information on insurance status at diagnosis, date of diagnosis, or date of first therapy were excluded (see Figure 1).
Positive DID or DDD indicates net improvement in timely treatment among Black patients compared with White patients.
Measures
We defined timely treatment as treatment initiation (chemotherapy, radiation, or surgery) within 45 days from the diagnosis of MIBC. Racial disparity was quantified as percentage-point (PP) difference for Black vs White patients.
We identified the expansion status based on the NCDB variable indicating Medicaid expansion status for groups of states. January 1, 2014, was marked the beginning of the postexpansion in our analyses. Race and ethnicity in the NCDB were abstracted from patients’ medical records.
Statistical analyses
We used χ2 tests to compare the sample characteristics between patients in expansion and nonexpansion states. As a standard statistical method for evaluating the impact of health policy on disparities in quasi-experimental studies, a difference-in-difference-in-differences (DDD) method was used to compare the difference in expansion effects by race (6,9). A 2-period model with year 2014 as the cutoff for the pre- and postperiods was used as the NCDB public data do not provide individual state of residence. To assess the change in racial disparity, we used the DDD method and generated a linear probability regression for timely treatment, with 2- and 3-way interactions among state expansion status, race, and postexpansion. The DDD approach is widely adopted in studying health disparities associated with policy change (10-12). The linear probability regression has been used in previous studies examining effects of the ACA–Medicaid expansion (13,14). It is preferred over logistic regression because of its easily interpretable coefficients and the fact that it performs as well as a logistic model in fitting the data when the probability is not extreme (15). The model also controlled for covariates including age (40-49, 50-59, or 60-64 years), sex (male, female), zip code–level median income (<$40 227, $40 227-50 353, $50 354-63 332, or ≥$63 333), location of residence (metro or nonmetro), Charlson–Deyo Comorbidity Index (0, 1, 2, or more), clinical stage (stage II, stage III), and treatment (NAC+RC or TMT). Insurance status was considered in the causal pathway; thus, it was not include in the models. Graphical inspection was conducted to demonstrate parallel trends for the DDD model (Supplementary Figures 1 and 2, available online).
Additionally, we performed 2 sensitivity analyses: first, receiving treatment within 60 days following the diagnosis of MIBC was used as an alternative definition for timely treatment; second, patients from states that expanded Medicaid eligibility later than January 2014 (New Hampshire, Indiana, Michigan, Pennsylvania, Alaska, Montana, and Louisiana) were excluded.
All statistical analyses were performed using SAS software, version 9.4 (SAS Institute Inc., Cary, NC, USA). All statistical significance testing was 2-sided at a P value less than .05. Because the public use files of the NCDB data are de-identified, the Office of Research Subject Protection at the Roswell Park Comprehensive Cancer Center exempted this study from institutional review board review.
Results
Participant characteristics
A total of 4991 MIBC patients aged 40-64 years were identified from the NCDB 2009-2018, including 4605 (92.3%) White and 386 (7.7%) Black patients. Among all patients, 3139 (62.9%) were in expansion states, and 1852 (37.1%) patients were in nonexpansion states. Black patients disproportionately lived in nonexpansion states (nonexpansion states 10.5% vs expansion states 6.1%; P < .001). Medicaid expansion was associated with lower uninsured rates and higher rates of Medicaid coverage (uninsured: 2.8% vs 6.9%; Medicaid: 7.8% vs 13.0%; P < .001) (Table 1).
Characteristics of patients newly diagnosed with stage II-III muscle-invasive bladder cancer who received multidisciplinary treatment in the National Cancer Database from 2008 to 2018
| Characteristics | Total, No. (%) (n = 4991) | Nonexpansion states, No. (%) (n = 1852) | Expansion states, No. (%) (n = 3139) | Pa |
|---|---|---|---|---|
| Age, y | .28 | |||
| 40-49 | 429 (8.6) | 168 (9.1) | 261 (8.3) | |
| 50-59 | 2376 (47.6) | 856 (46.2) | 1520 (48.4) | |
| 60-64 | 2186 (43.8) | 828 (44.7) | 1358 (43.3) | |
| Sex | .23 | |||
| Male | 3862 (77.4) | 1416 (76.5) | 2446 (77.9) | |
| Female | 1129 (22.6) | 436 (23.5) | 693 (22.1) | |
| Race | <.001 | |||
| White | 4605 (92.3) | 1658 (89.5) | 2947 (93.9) | |
| Black | 386 (7.7) | 194 (10.5) | 192 (6.1) | |
| Health insurance | <.001 | |||
| Private and othersb | 4222 (84.6) | 1581 (85.4) | 2641 (84.1) | |
| Medicaid | 553 (11.1) | 144 (7.8) | 409 (13.0) | |
| Uninsured | 212 (4.3) | 127 (6.9) | 89 (2.8) | |
| Income quartile by zip code, US$ | <.001 | |||
| <$40 227 | 757 (15.2) | 246 (13.3) | 511 (16.3) | |
| $40 227-$50 353 | 741 (14.8) | 400 (21.6) | 341 (10.9) | |
| $50 35-$63 332 | 971 (19.5) | 468 (25.3) | 503 (16) | |
| ≥$63 333 | 1037 (20.8) | 370 (20) | 667 (21.2) | |
| Unknown | 1485 (29.8) | 368 (19.9) | 1117 (35.6) | |
| Geographic location | <.001 | |||
| Metro | 3954 (79.2) | 1430 (77.2) | 2524 (80.4) | |
| Nonmetro | 1037 (20.8) | 422 (22.8) | 615 (19.6) | |
| Charlson–Deyo score | .69 | |||
| 0 | 3738 (74.9) | 1382 (74.6) | 2356 (75.1) | |
| 1 | 854 (17.1) | 324 (17.5) | 530 (16.9) | |
| 2 | 278 (5.6) | 97 (5.2) | 181 (5.8) | |
| 3 or more | 121 (2.4) | 49 (2.6) | 72 (2.3) | |
| Clinical stage | .57 | |||
| II | 4038 (80.9) | 1506 (81.3) | 2532 (80.7) | |
| III | 953 (19.1) | 346 (18.7) | 607 (19.3) | |
| Treatment | .03 | |||
| NAC+RC | 3946 (79.1) | 1434 (77.4) | 2512 (80) | |
| TMT | 1045 (20.9) | 418 (22.6) | 627 (20) | |
| Year of diagnosis | .18 | |||
| Pre-ACA | 1946 (39) | 700 (37.8) | 1246 (39.7) | |
| Post-ACA | 3045 (61) | 1152 (62.2) | 1893 (60.3) |
P value was estimated using χ2 tests to compare the sample characteristics between patients in expansion and nonexpansion states. ACA = Patient Protection and Affordable Care Act; NAC+RC = neoadjuvant chemotherapy followed by radical cystectomy; TMT = trimodality therapy.
Private and others include private insurance and/or managed care, Medicare, and other government insurance.
Timely treatment
In Medicaid expansion states, more Black patients received timely care following the ACA (from 54.5% to 57.4%), but their counterparts in nonexpansion states experienced a drop in timely receipt of care (from 69.9% to 53.7%) (Figures 2 and 3).
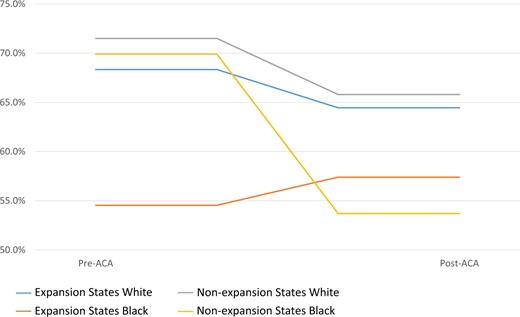
Proportions of patients who received timely multidisciplinary treatment of muscle-invasive bladder cancer by race and state expansion status. ACA = Patient Protection and Affordable Care Act.
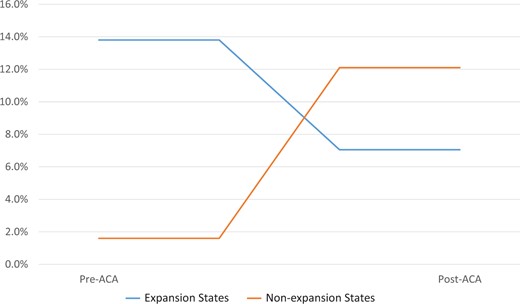
Black–White gap in proportions of patients who received timely multidisciplinary treatment of muscle-invasive bladder cancer, by state expansion status. ACA = Patient Protection and Affordable Care Act.
Multivariable analyses
After adjusting for covariates including age, insurance, zip code–level median income, location of residence, Charlson–Deyo Comorbidity Index, clinical stage, and treatment type, the disparity between Black and White patients receiving timely treatment shrunk dramatically in expansion states (from 15.2 PP pre-ACA to 7.7 PP post-ACA; adjusted DID = 7.5, 95% confidence interval [CI] = -4.1 to 19.2), but such disparity remained in nonexpansion states (from 4.7 PP pre-ACA to 10.8 PP post-ACA; adjusted DID = -6.1, 95% CI = -15.4 to 3.2). (Table 2). As a result, in the DDD analysis, we found Medicaid expansion was associated with a decreased gap in timely treatment between Black and White patients (adjusted DDD = 13.7, 95% CI = 0.5 to 26.8; P = .04) (Table 2).
Adjusted changes (percentage-point) in timely multidisciplinary treatment (≤45 days) and racial disparity from the pre-ACA and post-ACA periods by Medicaid expansion status
| Period | Patients receiving timely treatment, % | |||||
|---|---|---|---|---|---|---|
| Nonexpansion | Difference | Expansion | Difference | |||
| White | Black | Racial disparity, Black–White marginal effect | White | Black | Racial disparity, Black–White marginal effect | |
| Mean (95% CI) | Mean (95% CI) | Estimate (95% CI) | Mean (95% CI) | Mean (95% CI) | Estimate (95% CI) | |
| Pre-ACA | 78.1 (74.3 to 81.9) | 73.4 (67.8 to 78.9) | 4.7 (1.2 to 8.3) | 75.1 (69.0 to 81.1) | 59.8 (44.7 to 74.9) | 15.2 (4.4 to 26.1) |
| Post-ACA | 73.4 (69.2 to 77.5) | 62.5 (56.5 to 68.5) | 10.8 (3.4 to 18.2) | 73.4 (68.6 to 78.1) | 65.7 (53.3 to 78.1) | 7.7 (−4.3 to 19.7) |
| Pre- and post-difference | 4.7 (2.9 to 6.6) | 10.8 (2.7 to 19.0) | DID: -6.1 (−15.4 to 3.2) | 1.7 (−1.7 to 5.0) | -5.9 (−18.7 to 7.0) | DID: 7.5 (−4.1 to 19.2) |
| DDD | 13.7 (0.5 to 26.8) | |||||
ACA = Patient Protection and Affordable Care Act; CI = confidence interval; DID = difference-in-difference; DDD = difference-in-difference-in-difference.
Sensitivity analyses
We found similar results using 60 days instead of 45 days as definition of timely treatment (adjusted DDD = 15.7, 95% CI = 0.9 to 30.6; P = .04) (Supplementary Table 1, available online) or excluding patients from late expansion states (adjusted DDD = 20.4, 95% CI = -3.5 to 44.4; P = .09) (Supplementary Table 2, available online).
Discussion
In this quasi-experimental study, we found that the ACA’s Medicaid expansion was associated with reduced racial disparity in timely receipt of recommended multidisciplinary treatment among MIBC patients. In line with previous research showing reduced racial disparities in prompt treatment for metastatic cancer associated with Medicaid expansion (2,5), our study, for the first time, provides evidence from MIBC patients that Medicaid expansion may help increase timely access to multidisciplinary therapy and lessen racial disparities in timely receipt of quality curative treatment.
Our study focused on how health-care policy reform may narrow the racial gaps in timely delivery of high-quality, multidisciplinary, curative cancer treatments. Because of limited access to health care, racial minorities often have longer treatment wait time and more advanced illnesses at diagnosis than those of White patients (16). However, White and Black patients, when provided equal access to care in the US military health system, had a similar length of time from diagnosis to treatment for their cancer (17,18). ACA–Medicaid expansion provision has been shown to close the racial gap in treatment delay for advanced cancers (5). Furthermore, our study focused on curative treatment for nonmetastatic bladder cancer. It is especially crucial because past research revealed that Medicaid expansion is linked to trends toward earlier stage genitourinary cancer diagnoses (5). Such staging shifts provided a unique window not only to prolong survival but also to offer a cure for cancer patients.
Our study results are also important given the increasing complexity of cancer care. With emerging new treatment paradigm, multidisciplinary approaches are critical for patients to achieve cure or long-term survival. These approaches have been recommended and more frequently adopted in oncology practices, such as neoadjuvant systemic therapy followed by surgical resection or radiation (1). Numerous studies on MIBC found that multimodal strategies (such as NAC+RC and TMT) increased overall survival or life quality when compared with surgical resection alone (19,20). However, such strategies need access to a closely knit team of oncology experts from various subspecialties. Notably, most of Medicaid expansion’s protective effects on racial disparity were from a decline in timely treatment among Black patients in nonexpansion states. Without Medicaid expansion support, health-care facilities and providers may struggle to keep their practices open because of inadequate reimbursement. This financial strain could disproportionately affect Black patients residing in areas with already limited health-care infrastructure (21). Ensuring racial minorities access to this high-quality care is a key step to equity in cancer care.
Admittedly, equity in health-care access may not necessarily translate to equity in cancer outcomes. Existing literature suggested disparities in cancer survival may still exist in a single-payer system (22). These discrepancies could be the result of uneven comorbidity burdens brought on before cancer diagnoses throughout the spectrum of survivorship (23,24). Additionally, patients of racial minorities, especially those with low socioeconomic status, frequently experience structural racism, financial hardship, transportation barriers, housing issues, or even food insecurity (25-29). Our study did not explore the association of Medicaid expansion with further downstream cancer care and outcomes after treatment initiation; therefore, further study is warranted to evaluate the long-term outcomes of Medicaid expansion and to identify other potential policy interventions to close the racial gap in cancer outcomes.
Our study has several limitations. First, this is an observational study rather than a randomized trial. However, it could be challenging to conduct a randomized trial of health policy in the real world. The well-validated health economics approaches (DID and DDD) were employed to reduce unmeasured confounding effects. However, it is still possible that secular trends in time to treatment may have contributed to the observed effects, and these effects may not be solely attributable to the ACA–Medicaid expansion. Second, we did not have individual-level data including patients’ state of residence or eligibility for Medicaid, income, and education from the NCDB public use file. In addition, the public use files of the NCDB only contain the states’ Medicaid expansion status of patients aged 40-64 years. This age restriction may limit the generalizability of our data to younger patient population. Moreover, we were unable to include patients from racial or ethnic minority groups other than Black patients in our analysis because of small sample sizes. Some of our estimates for Black patients were also subject to uncertainty because of small numbers despite large magnitudes. Last, more states expanded Medicaid after the study period, necessitating further research on these states.
We discovered that the ACA–Medicaid expansion was associated with a statically significant decline in the Black and White patient gap in timely receipt of high-quality, multidisciplinary, curative care for MIBC. Future studies are required to investigate the long-term health effects of Medicaid expansion and to pinpoint effective legislative reforms that will expand all cancer patients’ access to care.
Data availability
The data underlying this article were provided by the American Cancer Society and the American College of Surgeons by permission. Data access can be requested directly from the American College of Surgeons: https://www.facs.org/quality-programs/cancer/ncdb/puf.
Author contributions
Changchuan Jiang, MD, MPH (Conceptualization; Data curation; Formal analysis; Funding acquisition; Investigation; Methodology; Project administration; Resources; Supervision; Writing—original draft; Writing—review & editing), Stuthi Perimbeti, MD, MPH (Writing—review & editing), Lei Deng, MD (Writing—review & editing), Jiazhang Xing, MD (Writing—original draft; Writing—review & editing), Gurkamal S Chatta, MD (Supervision; Writing—review & editing), Xuesong Han, PhD (Conceptualization; Supervision; Writing—review & editing), and Dharmesh Gopalakrishnan, MD (Supervision; Writing—review & editing).
Funding
Not applicable.
Conflicts of interest
XH has received grant from AstraZeneca for research outside of the current study. The authors have no declaration in potential conflict of interest.

