


Abstract
PTEN Hamartoma Tumor Syndrome (PHTS) is a rare syndrome with a broad phenotypic spectrum, including increased risks of breast (BC, 67%-78% at age 60 years), endometrial (EC, 19%-28%), and thyroid cancer (TC, 6%-38%). Current risks are likely overestimated due to ascertainment bias. We aimed to provide more accurate and personalized cancer risks.
This was a European, adult PHTS cohort study with data from medical files, registries, and/or questionnaires. Cancer risks and hazard ratios were assessed with Kaplan-Meier and Cox regression analyses, and standardized incidence ratios were calculated. Bias correction consisted of excluding cancer index cases and incident case analyses.
A total of 455 patients were included, including 50.5% index cases, 372 with prospective follow-up (median 6 years, interquartile range = 3-10 years), and 159 of 281 females and 39 of 174 males with cancer. By age 60 years, PHTS-related cancer risk was higher in females (68.4% to 86.3%) than males (16.4% to 20.8%). Female BC risks ranged from 54.3% (95% confidence interval [CI] = 43.0% to 66.4%) to 75.8% (95% CI = 60.7% to 88.4%), with two- to threefold increased risks for PTEN truncating and approximately twofold for phosphatase domain variants. EC risks ranged from 6.4% (95% CI = 2.1% to 18.6%) to 22.1% (95% CI = 11.6% to 39.6%) and TC risks from 8.9% (95% CI = 5.1% to 15.3%) to 20.5% (95% CI = 11.3% to 35.4%). Colorectal cancer, renal cancer, and melanoma risks were each less than 10.0%.
Females have a different BC risk depending on their PTEN germline variant. PHTS patients are predominantly at risk of BC (females), EC, and TC. This should be the main focus of surveillance. These lower, more unbiased and personalized risks provide guidance for optimized cancer risk management.
PTEN Hamartoma Tumor Syndrome (PHTS) is caused by pathogenic germline variants in the tumor suppressor gene PTEN. The estimated prevalence of 1:200 000 is likely higher because many patients remain unrecognized (1,2). The phenotype is diverse and includes increased risks for several cancer types and macrocephaly, developmental delay, cutaneous pathology, thyroid pathology, vascular malformations, and benign tumors (2). Cancer management is hampered by uncertain, overestimated, and population-averaged risks that do not consider the diverse phenotype and PTEN variant spectrum of PHTS.
Current PHTS population-averaged estimates indicate cancer risks of 85%-90% in females and 54%-66% in males by age 60 years. In particular, increased risks for female breast (BC; 67%-78%), endometrial (EC; 19%-28%), thyroid (TC; 6%-38%), colorectal (CRC; 9%-20%), and renal cancer (RC; 2%-11%) and melanomas (0%-6%) are reported (3-6). These estimates are uncertain and are probably overestimated due to ascertainment bias and small cohorts with limited follow-up time. In addition, cancer has been suggested to be more common in patients with truncating PTEN variants, though genotype-specific risks are lacking (4,7). Various expert-opinion guidelines advise annual BC surveillance from age 25 years or 30 years, and TC surveillance starting during childhood or from age 18 years or PHTS diagnosis onwards. Advice for EC, CRC, RC, and melanoma varies from no surveillance to annual surveillance (8-12).
More accurate and personalized cancer risks are needed to optimize cancer risk management. Therefore, the study aim was to assess the cancer risks of PHTS patients per cancer type, sex, and genotype in a large European cohort.
Methods
Patients
Adult patients were retrospectively recruited via genetic centers and PHTS expert centers across Europe and via self-recruitment (www.pten.eu) (13). Patients with a pathogenic or likely pathogenic PTEN germline variant reported by the genetic center or self-reported by the patient (n = 450), a PTEN germline variant of unknown significance and clear PHTS phenotype (n = 1), or no genetic test and clear PHTS phenotype and PTEN variant in first-degree relatives (n = 4) were included.
The institutional ethics committees approved this study, and written informed consent was obtained when indicated by the ethical committee.
Clinical and genetic information
Data were obtained from medical files (n = 450), registries (n = 235), and/or questionnaires (n = 128; Supplementary Figure 1, available online). Information on vital status, cancer, clinical characteristics, surgeries, and genetic testing was collected from medical files using a standardized data dictionary. Similar information was collected from questionnaires completed by patients. For Dutch patients, information on cancer diagnoses, precursor lesions, and surgeries was additionally collected via the Dutch Nationwide Pathology Databank (PALGA) (14). Ninety-eight percent of patients had validated genetic test reports. Of primary cancers, 75.0% were pathology confirmed, maximally 10.0% were self-reported, and the remainder was based on clinical reports.
Primary cancers included the first primary cancer of that specific type. Moment of last contact included date of last clinical follow-up, questionnaire completion, or last pathology report, whichever came last. When moment of last contact was absent, latest date of known phenotypic symptoms was used. Any cancer included all cancers observed, and PHTS-relatedcancers included BC, EC, TC, CRC, RC, and melanoma.
Variant coding effect was categorized as truncating (including predicted truncating), missense, or other, and spatial categorization was according to protein domains (Supplementary Tables 1 and 2, available online).
Statistical analyses
Descriptive statistics were performed using appropriate measures depending on data distribution. Cancer risks were calculated using Kaplan-Meier Analyses. Standardized incidence ratios (SIRs) were calculated using cancer, age, sex, birth cohort, and country-specific population incidence data (15–17). Right-censoring was applied at moment of site-relevant surgery, last follow-up, age 70 years or death, whichever came first. Site-relevant surgeries included bilateral mastectomy, hysterectomy, total thyroidectomy, total colectomy, bilateral tubectomy, or ovariectomy, irrespective of prophylactic or elective intent. Relative risks associated with variant coding effect and domain were analyzed using multivariable Cox regression. The proportionality assumption was verified by assessing log-minus-log plots and Schoenfeld residuals.
To correct for ascertainment bias, we performed 1) prevalent case analyses excluding index patients (ie, first identified patient in a family) who had cancer before genetic testing (abbreviated as ca-index patients); and 2) incident case analyses by prospective analyses from the age of genetic testing onward (18).
Surveillance bias was addressed by composite endpoints combining in situ with invasive BC and adenomatous polyps (APs) with invasive CRC. CRC risk was also modelled by AP-to-CRC progression using 10% and 20% progression rates and 3-, 5-, and 10-year dwell time (19–21). Survival bias was addressed by sensitivity analyses per data source (data not shown).
Analyses were performed using RStudio (V.3.6.2). A 2-sided P value less than .05 was considered statistically significant.
Results
Patient population
A total of 455 adult PHTS patients, of whom 61.8% were female, were included from 312 families, with 1 to 8 patients per family. The cohort included 50.5% index cases, including 108 ca-index patients (Table 1). Of non-index patients (n = 219), 18.7% had cancer before PHTS diagnosis. The median age of PHTS diagnosis was 37 years (interquartile range [IQR] = 29-49) in females and 39 years (IQR = 28-46) in males, which was slightly lower in the cohort excluding ca-index patients. Information after genetic diagnosis was available for 81.8% of patients with a median follow-up of 6 years (IQR = 3-10). Overall, 33.0% of patients had missense variants and 66.8% truncating variants, and 54.0% had a variant located in the phosphatase domain (PD) and 24.8% in domain C2 (Table 1; Supplementary Tables 1 and 2, available online). Missense variants in C2 were rarely observed (n = 9). Data sources and variant distributions were similar between subgroups.
Cohort baseline characteristics
| Characteristics | Total | Females | Males | |||
|---|---|---|---|---|---|---|
| Including ca-index patients | Excluding ca-index patients | Including ca-index patients | Excluding ca-index patients | Including ca-index patients | Excluding ca-index patients | |
| Population, No. (% of total)a | 455 (100.0) | 347 (76.3) | 281 (61.8) | 195 (56.2) | 174 (38.2) | 152 (43.8) |
| Index, No. (%) | 230 (50.5) | 122 (35.2) | 149 (53.0) | 63 (32.3) | 81 (46.6) | 59 (38.8) |
| Age at last follow-up, median (IQR)b | 44 (33-55) | 41 (29-51) | 44 (34-55) | 40 (30-51) | 43 (30-53) | 43 (28-50) |
| Follow-up after genetic testing | ||||||
| No. (%) | 372 (81.8) | 274 (79.0) | 240 (85.4) | 160 (82.1) | 132 (75.9) | 114 (75.0) |
| Years, median (IQR) | 6 (3-10) | 6 (3-10) | 6 (3-10) | 6 (3-10) | 6 (3-10) | 6 (3-10) |
| Data sources, No. (%) | ||||||
| Medical files | 450 (98.9) | 342 (98.6) | 278 (98.9) | 192 (98.5) | 172 (98.9) | 150 (98.7) |
| Pathology databank | 235 (51.6) | 184 (53.0) | 146 (52.0) | 102 (52.3) | 89 (51.1) | 82 (53.9) |
| Questionnaire | 128 (28.1) | 96 (27.7) | 84 (29.9) | 57 (29.2) | 44 (25.3) | 39 (25.7) |
| Age at genetic diagnosis of PHTS | ||||||
| No. (%) | 437 (96.0) | 329 (94.8) | 274 (97.5) | 188 (96.4) | 163 (93.7) | 141 (92.8) |
| Age, median (IQR) | 38 (28-47) | 36 (25-44) | 37 (29-49) | 35 (24-43) | 39 (28-46) | 38 (26-44) |
| Coding effect, No. (%) | 443 (97.4) | 335 (96.5) | 276 (98.2) | 190 (97.4) | 167 (96.0) | 145 (95.4) |
| Missense | 146 (33.0) | 116 (34.6) | 86 (31.2) | 63 (33.2) | 60 (35.9) | 53 (36.6) |
| Truncating | 296 (66.8) | 219 (65.4) | 189 (68.5) | 127 (66.8) | 107 (64.1) | 92 (63.4) |
| Other | 1 (0.2) | 0 (0.0) | 1 (0.4) | 0 (0.0) | 0 (0.0) | 0 (0.0) |
| Domain location, No. (%) | 443 (97.4) | 335 (96.5) | 276 (98.2) | 190 (97.4) | 167 (96.0) | 145 (95.4) |
| C2 | 110 (24.8) | 78 (23.3) | 61 (22.1) | 34 (17.9) | 49 (29.3) | 44 (30.3) |
| Phosphatase | 239 (54.0) | 189 (56.4) | 148 (53.6) | 110 (57.9) | 91 (54.5) | 79 (54.5) |
| Other | 94 (21.2) | 68 (20.3) | 67 (24.3) | 46 (24.2) | 27 (16.2) | 22 (15.2) |
Percentage of total corresponding cohort. ca-index patients = index patients who had cancer before genetic testing; PHTS = PTEN Hamartoma Tumor Syndrome.
Interquartile range, that is, quantile 1 to quantile 3.
Cancer description
Overall, 159 females (56.6%) and 39 males (22.4%) developed cancer, including 85 and 18 ca-index patients, respectively. Cancer characteristics and ages are presented per cohort and sex in Supplementary Table 3 (available online) and Figure 1. Females, excluding ca-index patients, most often developed BC (n = 50, 25.6%), TC (n = 13, 6.7%), and EC (n = 13, 6.7%) and males TC (n = 5, 3.3%). Among these, 23 (31.1%) females had multiple primary cancers, where BC cooccurred most often with TC or EC when considering PHTS-related cancers (each n= 4). In males, this was 19.0% (n = 4) and did CRC and TC cooccur when considering PHTS-related cancers (n = 1).
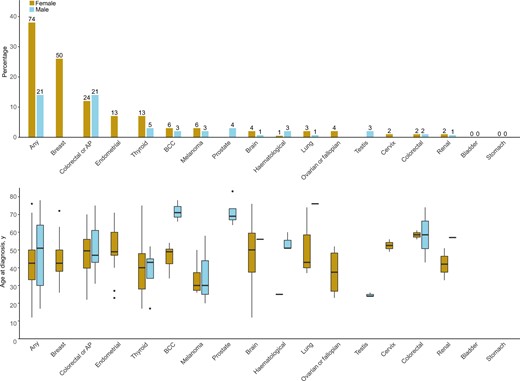
Cancer prevalence and age in the prevalent cohort excluding ca-index patients. For the prevalent cohort excluding index patients who had cancer before genetic testing (ca-index patients), the prevalence is presented in percentages (%) on the y-axis for females (left bars) and males (right bars) for different cancer types in the upper panel. The exact number of diagnoses is presented above each bar. In the lower panel is the age at diagnosis in years presented for the different cancer types in a boxplot for females (left bars) and males (right bars). “Breast” includes in situ carcinomas as well. Any = any cancer; AP = adenomatous polyps; BCC = basal cell carcinoma.
Risk-reducing surgeries
Among females, 10.4%-31.0% had surgery before primary cancer development (Supplementary Table 4, available online). Females more often had total thyroidectomy than males (13.3%-31.0% vs 12.9%-19.5%, respectively).
Cancer risks
All cancer
Of females, 74 (37.9%) developed cancer at a median age of 43 years (IQR = 33-50 years) excluding ca-index patients, and 33 (13.8%) had an incident cancer at a median age of 43 years (IQR = 36-49 years). For males, this was 13.8% (n = 21) at a median age of 51 years (IQR = 30-64 years) and 5.3% (n = 7) at a median age of 56 years (IQR = 51-64 years), respectively.
Risks for PHTS-related and any cancer were similar. Risks for PHTS-related cancers were 7.2% (95% CI = 4.2% to 12.4%) at age 30 years, 68.4% (95% CI = 57.0% to 79.2%) at age 60 years, and 88.4% (95% CI = 72.5% to 97.2%) at age 70 years in females excluding ca-index patients, and 21.8% (95% CI = 9.7% to 44.7%), 86.3% (95% CI = 72.9% to 95.1%), and 95.4% (95% CI = 82.1% to 99.6%) in the prospective analyses, respectively. This was 16.4% (95% CI = 7.6% to 33.2%) at both ages 60 years and 70 years in males excluding ca-index patients and 20.8% (95% CI = 6.9% to 53.5%) and 36.6% (95% CI = 13.6% to 75.9%) in the prospective analyses, respectively. Cancer risks are presented per cohort and sex in Table 2, Figure 2, and Supplementary Table 5 (available online).
![Cumulative cancer risks by cancer type and sex. Per cancer type, age- and sex-specific cumulative cancer risks in percentages (%) are presented for the prevalent cohort excluding index patients who had cancer before genetic testing (ca-index patients) (left graphs) and incident cases in the prospective analyses (right graphs). Dashed lines represent 95% confidence intervals. In risk tables, the number of patients at risk (Nrisk) and the cumulative number of events (Nevent) is presented from age 10 years onward. Nrisk and Nevent for age 0 is for all groups the same as for age 10 years. Cumulative cancer risks are presented for A) any cancer for females and males; B) PTEN Hamartoma Tumor Syndrome (PHTS)-related cancers for females and males (including breast [including in situ carcinomas], endometrium, thyroid, colorectal, and renal cancer and melanoma); C) breast cancer for females and males (including in situ carcinomas); D) endometrium cancer for females; E) thyroid cancer for females and males; F) colorectal cancer for the total population; G) colorectal cancer or adenomatous polyps (AP) together for the total population; H) renal cancer for the total population; and I) melanoma for the total population.](https://oup.silverchair-cdn.com/oup/backfile/Content_public/Journal/jnci/115/1/10.1093_jnci_djac188/1/m_djac188f2.jpeg?Expires=1750199088&Signature=SmBHLW~W10095b-zDOUCntNrbczvS0oaAshpYVD51iCcC4ZLHj01lLRogyJawuYTYShIVkcCJGiLW71h1xAV60bIkaFDmql~DnF-WzZQksIkhrOf1tiV1~zVsR~j5dbbmyfU16Naq~NA9Y-f2RZKfchSL5EqRJUWQ~u2ToEBjz-kn1CsZw59sBgZYNcqb8M-Ea7Lt~B6UBJmAAxVPEBl05x~atFaCU~H-AyLxqN5BJM-35tWLytQp1YTGg4kYSqwRwmDjoJzVK1Nn~Uwt~h2rNiDr2SrnwHtgKWVYwzLDlbuN9mjsXDk9P6SdhiG3e99W-4Gg6Sj2-P6UT8hrh0wGw__&Key-Pair-Id=APKAIE5G5CRDK6RD3PGA)
Cumulative cancer risks by cancer type and sex. Per cancer type, age- and sex-specific cumulative cancer risks in percentages (%) are presented for the prevalent cohort excluding index patients who had cancer before genetic testing (ca-index patients) (left graphs) and incident cases in the prospective analyses (right graphs). Dashed lines represent 95% confidence intervals. In risk tables, the number of patients at risk (Nrisk) and the cumulative number of events (Nevent) is presented from age 10 years onward. Nrisk and Nevent for age 0 is for all groups the same as for age 10 years. Cumulative cancer risks are presented for A) any cancer for females and males; B) PTEN Hamartoma Tumor Syndrome (PHTS)-related cancers for females and males (including breast [including in situ carcinomas], endometrium, thyroid, colorectal, and renal cancer and melanoma); C) breast cancer for females and males (including in situ carcinomas); D) endometrium cancer for females; E) thyroid cancer for females and males; F) colorectal cancer for the total population; G) colorectal cancer or adenomatous polyps (AP) together for the total population; H) renal cancer for the total population; and I) melanoma for the total population.
Cancer risks per sex and analyses strategya
| Prevalent cases in cohort excluding ca-index patients | Incident cases in cohort including ca-index patients | |||||||
|---|---|---|---|---|---|---|---|---|
| Cumulative risk | Standardized incidence ratio | Cumulative risk | Standardized incidence ratio | |||||
| Population and cancer type | Age, y | Risk (95% CI) | Age category, y | Ratio (95% CI) | Age, y | Risk (95% CI) | Age category, y | Ratio (95% CI) |
| Total | ||||||||
| Any cancer | 20 | 1.2 (0.4 to 3.1) | — | — | 20 | 2.5 (0.4 to 16.5) | — | — |
| 30 | 6.7 (4.4 to 10.2) | 20-29 | — | 30 | 13.3 (5.1 to 32.2) | 20-29 | — | |
| 40 | 15.5 (11.6 to 20.7) | 30-39 | — | 40 | 32.9 (20.6 to 49.9) | 30-39 | — | |
| 50 | 33.1 (26.4 to 40.9) | 40-49 | — | 50 | 53.1 (40.3 to 67.2) | 40-49 | — | |
| 60 | 52.2 (43.2 to 61.8) | 50-59 | — | 60 | 72.2 (58.7 to 84.3) | 50-59 | — | |
| 70 | 70.0 (57.2 to 81.9) | 60-69 | — | 70 | 83.3 (68.9 to 93.6) | 60-69 | — | |
| — | — | 20-69 | — | — | — | 20-69 | — | |
| PHTS-related cancer | 20 | 0.9 (0.3 to 2.7) | — | — | 20 | 2.4 (0.3 to 16.1) | – | — |
| 30 | 5.1 (3.1 to 8.4) | 20-29 | — | 30 | 16.1 (6.9 to 34.8) | 20-29 | — | |
| 40 | 13.5 (9.8 to 18.5) | 30-39 | — | 40 | 35.5 (23.1 to 51.8) | 30-39 | — | |
| 50 | 30.8 (24.2 to 38.8) | 40-49 | — | 50 | 54.5 (41.9 to 68.1) | 40-49 | — | |
| 60 | 47.4 (38.4 to 57.3) | 50-59 | — | 60 | 67.8 (54.7 to 80.2) | 50-59 | — | |
| 70 | 60.4 (48.0 to 73.1) | 60-69 | — | 70 | 78.3 (64.1 to 89.8) | 60-69 | — | |
| — | — | 20-69 | — | — | — | 20-69 | — | |
| Thyroid cancer | 20 | 0.6 (0.1 to 2.3) | — | — | 20 | 2.5 (0.4 to 16.5) | — | — |
| 30 | 1.6 (0.7 to 3.8) | 20-29 | 41.3 (8.3 to 120.7) | 30 | 6.0 (1.5 to 22.3) | 20-29 | 103.3 (1.3 to 574.6) | |
| 40 | 3.6 (1.8 to 6.9) | 30-39 | 26.4 (5.3 to 77.2) | 40 | 9.9 (3.7 to 25.0) | 30-39 | 29.3 (0.4 to 162.7) | |
| 50 | 7.6 (4.4 to 13.0) | 40-49 | 74.5 (27.2 to 162.2) | 50 | 17.8 (9.5 to 32.1) | 40-49 | 145.1 (53.0 to 315.9) | |
| 60 | 8.9 (5.1 to 15.3) | 50-59 | 25.5 (0.3 to 142.0) | 60 | 20.5 (11.3 to 35.4) | 50-59 | 49.3 (0.6 to 274.1) | |
| 70 | 16.5 (8.1 to 32.0) | 60-69 | 48.7 (0.6 to 271.2) | 70 | 29.3 (14.5 to 53.4) | 60-69 | 0.0 (0.0 to 0.0) | |
| — | — | 20-69 | 42.9 (23.4 to 72.0) | — | — | 20-69 | 78.9 (36.0 to 149.7) | |
| Colorectal cancer | 20 | 0.0 (0.0 to 0.0) | — | — | 20 | 0.0 (0.0 to 0.0) | — | — |
| 30 | 0.0 (0.0 to 0.0) | 20-29 | 0.0 (0.0 to 0.0) | 30 | 0.0 (0.0 to 0.0) | 20-29 | 0.0 (0.0 to 0.0) | |
| 40 | 0.0 (0.0 to 0.0) | 30-39 | 0.0 (0.0 to 0.0) | 40 | 0.0 (0.0 to 0.0) | 30-39 | 0.0 (0.0 to 0.0) | |
| 50 | 0.6 (0.1 to 4.4) | 40-49 | 4.0 (0.1 to 22.1) | 50 | 0.0 (0.0 to 0.0) | 40-49 | 0.0 (0.0 to 0.0) | |
| 60 | 2.2 (0.5 to 9.8) | 50-59 | 2.2 (0.0 to 12.2) | 60 | 5.2 (1.3 to 19.2) | 50-59 | 7.1 (0.8 to 25.6) | |
| 70 | 4.5 (1.3 to 14.8) | 60-69 | 2.0 (0.0 to 11.1) | 70 | 15.2 (5.4 to 38.6) | 60-69 | 7.3 (0.8 to 26.4) | |
| — | — | 20-69 | 2.2 (0.4 to 6.5) | — | — | 20-69 | 5.6 (1.5 to 14.2) | |
| Colorectal cancer or AP | 20 | 0.0 (0.0 to 0.0) | — | — | 20 | 0.0 (0.0 to 0.0) | — | — |
| 30 | 0.7 (0.2 to 2.6) | 20-29 | — | 30 | 3.0 (0.4 to 19.6) | 20-29 | — | |
| 40 | 3.8 (2.0 to 7.3) | 30-39 | — | 40 | 12.6 (6.1 to 25.3) | 30-39 | — | |
| 50 | 13.4 (8.9 to 19.7) | 40-49 | — | 50 | 31.2 (21.3 to 44.2) | 40-49 | — | |
| 60 | 29.8 (21.7 to 40.2) | 50-59 | — | 60 | 52.2 (39.9 to 65.8) | 50-59 | — | |
| 70 | 48.0 (35.1 to 62.7) | 60-69 | — | 70 | 72.4 (57.3 to 85.8) | 60-69 | — | |
| — | — | 20-69 | — | — | — | 20-69 | — | |
| Renal cancer | 20 | 0.0 (0.0 to 0.0) | — | — | 20 | 0.0 (0.0 to 0.0) | —– | — |
| 30 | 0.0 (0.0 to 0.0) | 20-29 | 0.0 (0.0 to 0.0) | 30 | 0.0 (0.0 to 0.0) | 20-29 | 0.0 (0.0 to 0.0) | |
| 40 | 0.4 (0.1 to 2.9) | 30-39 | 28.0 (0.4 to 156.1) | 40 | 2.1 (0.3 to 14.2) | 30-39 | 100.5 (1.3 to 559.3) | |
| 50 | 0.4 (0.1 to 2.9) | 40-49 | 0.0 (0.0 to 0.0) | 50 | 3.7 (0.9 to 14.1) | 40-49 | 22.5 (0.3 to 125.0) | |
| 60 | 3.3 (0.9 to 11.1) | 50-59 | 17.6 (2.0 to 63.5) | 60 | 8.6 (3.3 to 21.6) | 50-59 | 27.0 (3.0 to 97.4) | |
| 70 | 3.3 (0.9 to 11.1) | 60-69 | 0.0 (0.0 to 0.0) | 70 | 8.6 (3.3 to 21.6) | 60-69 | 0.0 (0.0 to 0.0) | |
| — | — | 20-69 | 8.8 (1.8 to 25.6) | — | — | 20-69 | 21.2 (5.7 to 54.3) | |
| Melanoma | 20 | 0.3 (0.0 to 2.1) | — | — | 20 | 0.0 (0.0 to 0.0) | — | — |
| 30 | 1.8 (0.7 to 4.2) | 20-29 | 20.5 (5.5 to 52.5) | 30 | 3.2 (0.5 to 20.8) | 20-29 | 36.4 (0.5 to 202.4) | |
| 40 | 2.6 (1.3 to 5.5) | 30-39 | 9.0 (1.8 to 26.3) | 40 | 3.2 (0.5 to 20.8) | 30-39 | 0.0 (0.0 to 0.0) | |
| 50 | 3.7 (1.7 to 7.9) | 40-49 | 0.0 (0.0 to 0.0) | 50 | 4.8 (1.1 to 19.1) | 40-49 | 0.0 (0.0 to 0.0) | |
| 60 | 5.5 (2.4 to 12.1) | 50-59 | 8.6 (1.0 to 31.2) | 60 | 7.3 (2.3 to 21.6) | 50-59 | 11.5 (1.3 to 41.6) | |
| 70 | 5.5 (2.4 to 12.1) | 60-69 | 0.0 (0.0 to 0.0) | 70 | 11.7 (4.3 to 29.8) | 60-69 | 11.0 (0.1 to 61.3) | |
| — | — | 20-69 | 7.3 (3.3 to 13.9) | — | — | 20-69 | 6.6 (1.8 to 16.9) | |
| Female | ||||||||
| Any cancer | 20 | 1.0 (0.3 to 4.0) | — | — | 20 | 5.6 (0.8 to 33.4) | — | — |
| 30 | 8.3 (5.0 to 13.6) | 20-29 | — | 30 | 22.6 (10.1 to 46.0) | 20-29 | — | |
| 40 | 23.1 (16.9 to 31.1) | 30-39 | — | 40 | 45.2 (30.0 to 63.9) | 30-39 | — | |
| 50 | 52.1 (42.1 to 63.0) | 40-49 | — | 50 | 75.4 (60.9 to 87.6) | 40-49 | — | |
| 60 | 70.5 (59.4 to 80.9) | 50-59 | — | 60 | 88.5 (74.9 to 96.6) | 50-59 | — | |
| 70 | 89.2 (74.2 to 97.4) | 60-69 | — | 70 | 96.2 (84.1 to 99.7) | 60-69 | — | |
| — | — | 20-69 | — | – | – | 20-69 | — | |
| PHTS-related cancer | 20 | 0.5 (0.1 to 3.6) | — | — | 20 | 5.3 (0.8 to 31.9) | – | — |
| 30 | 7.2 (4.2 to 12.4) | 20-29 | — | 30 | 21.8 (9.7 to 44.7) | 20-29 | — | |
| 40 | 21.3 (15.3 to 29.2) | 30-39 | — | 40 | 45.5 (30.5 to 63.5) | 30-39 | — | |
| 50 | 49.5 (39.4 to 60.5) | 40-49 | — | 50 | 74.2 (60.0 to 86.6) | 40-49 | — | |
| 60 | 68.4 (57.0 to 79.2) | 50-59 | — | 60 | 86.3 (72.9 to 95.1) | 50-59 | — | |
| 70 | 88.4 (72.5 to 97.2) | 60-69 | — | 70 | 95.4 (82.1 to 99.6) | 60-69 | — | |
| — | — | 20-69 | — | — | — | 20-69 | — | |
| Breast cancer (including in situ carcinoma) | 20 | 0.0 (0.0 to 0.0) | — | — | 20 | 0.0 (0.0 to 0.0) | — | — |
| 30 | 2.7 (1.0 to 6.9) | 20-29 | 20.9 (2.4 to 75.6) | 30 | 10.1 (2.6 to 34.7) | 20-29 | 58.3 (0.8 to 324.7) | |
| 40 | 16.4 (11.0 to 24.2) | 30-39 | 23.6 (13.5 to 38.4) | 40 | 38.4 (24.4 to 56.8) | 30-39 | 57.4 (29.6 to 100.4) | |
| 50 | 38.5 (29.1 to 49.7) | 40-49 | 16.2 (9.6 to 25.7) | 50 | 63.3 (48.5 to 77.9) | 40-49 | 21.2 (10.1 to 39.0) | |
| 60 | 54.3 (43.0 to 66.4) | 50-59 | 12.5 (6.2 to 22.3) | 60 | 75.8 (60.7 to 88.4) | 50-59 | 19.5 (7.1 to 42.4) | |
| 70 | 59.5 (47.4 to 72.0) | 60-69 | 4.1 (0.5 to 14.8) | 70 | 79.8 (64.6 to 91.5) | 60-69 | 5.5 (0.1 to 30.7) | |
| — | — | 20-69 | 15.1 (11.1 to 19.9) | — | — | 20-69 | 25.3 (17.0 to 36.1) | |
| Breast in situ carcinoma only | 20 | 0.0 (0.0 to 0.0) | — | — | 20 | 0.0 (0.0 to 0.0) | — | |
| 30 | 0.6 (0.1 to 4.3) | 20-29 | — | 30 | 4.5 (0.7 to 28.1) | 20-29 | — | |
| 40 | 9.6 (5.5 to 16.4) | 30-39 | — | 40 | 29.0 (16.9 to 46.8) | 30-39 | — | |
| 50 | 18.0 (11.4 to 27.7) | 40-49 | — | 50 | 41.4 (27.6 to 58.7) | 40-49 | — | |
| 60 | 22.0 (14.2 to 33.1) | 50-59 | — | 60 | 50.0 (34.0 to 68.6) | 50-59 | — | |
| 70 | 22.0 (14.2 to 33.1) | 60-69 | — | 70 | 50.0 (34.0 to 68.6) | 60-69 | — | |
| — | — | 20-69 | — | — | — | 20-69 | — | |
| Endometrial cancer | 20 | 0.0 (0.0 to 0.0) | — | — | 20 | 0.0 (0.0 to 0.0) | — | — |
| 30 | 1.2 (0.3 to 4.7) | 20-29 | 941.8 (105.8 to 3400.5) | 30 | 0.0 (0.0 to 0.0) | 20-29 | 0.0 (0.0 to 0.0) | |
| 40 | 2.1 (0.7 to 6.7) | 30-39 | 0.0 (0.0 to 0.0) | 40 | 2.0 (0.3 to 13.1) | 30-39 | 0.0 (0.0 to 0.0) | |
| 50 | 9.0 (4.1 to 18.9) | 40-49 | 107.6 (34.7 to 251.1) | 50 | 6.4 (2.1 to 18.6) | 40-49 | 80.3 (9.0 to 289.8) | |
| 60 | 22.1 (11.6 to 39.6) | 50-59 | 17.9 (2.0 to 64.8) | 60 | 6.4 (2.1 to 18.6) | 50-59 | 14.5 (0.2 to 80.6) | |
| 70 | 33.2 (15.6 to 61.7) | 60-69 | 41.3 (8.3 to 120.5) | 70 | 6.4 (2.1 to 18.6) | 60-69 | 0.0 (0.0 to 0.0) | |
| — | — | 20-69 | 48.4 (25.0 to 84.5) | — | — | 20-69 | 20.0 (4.0 to 58.4) | |
| Thyroid cancer | 20 | 0.5 (0.1 to 3.6) | — | — | 20 | 5.6 (0.8 to 33.4) | — | — |
| 30 | 2.3 (0.9 to 6.1) | 20-29 | 50.2 (10.1 to 146.8) | 30 | 10.8 (2.8 to 36.7) | 20-29 | 117.7 (1.5 to 655.1) | |
| 40 | 5.1 (2.4 to 10.6) | 30-39 | 21.4 (2.4 to 77.2) | 40 | 15.7 (5.9 to 38.3) | 30-39 | 31.2 (0.4 to 173.9) | |
| 50 | 9.9 (5.1 to 18.8) | 40-49 | 65.2 (17.5 to 166.9) | 50 | 23.0 (11.2 to 43.7) | 40-49 | 119.4 (32.1 to 305.7) | |
| 60 | 9.9 (5.1 to 18.8) | 50-59 | 0.0 (0.0 to 0.0) | 60 | 23.0 (11.2 to 43.7) | 50-59 | 0.0 (0.0 to 0.0) | |
| 70 | 24.1 (10.1 to 51.3) | 60-69 | 65.1 (0.9 to 362.1) | 70 | 42.2 (16.7 to 80.7) | 60-69 | 0.0 (0.0 to 0.0) | |
| — | — | 20-69 | 38.9 (18.6 to 71.5) | — | — | 20-69 | 64.0 (23.4 to 139.2) | |
| Male | ||||||||
| Any cancer | 20 | 1.3 (0.3 to 5.2) | — | — | 20 | 0.0 (0.0 to 0.0) | — | — |
| 30 | 4.6 (2.1 to 10.0) | 20-29 | — | 30 | 0.0 (0.0 to 0.0) | 20-29 | — | |
| 40 | 5.5 (2.7 to 11.4) | 30-39 | — | 40 | 0.0 (0.0 to 0.0) | 30-39 | — | |
| 50 | 8.1 (4.2 to 15.3) | 40-49 | — | 50 | 4.2 (0.6 to 26.1) | 40-49 | — | |
| 60 | 26.2 (15.1 to 43.0) | 50-59 | — | 60 | 36.1 (16.2 to 68.0) | 50-59 | — | |
| 70 | 41.8 (23.5 to 66.6) | 60-69 | — | 70 | 52.1 (24.6 to 85.2) | 60-69 | — | |
| — | — | 20-69 | — | — | — | 20-69 | — | |
| PHTS-related cancer | 20 | 1.3 (0.3 to 5.2) | — | — | 20 | 0.0 (0.0 to 0.0) | — | — |
| 30 | 2.2 (0.7 to 6.8) | 20-29 | — | 30 | 0.0 (0.0 to 0.0) | 20-29 | — | |
| 40 | 3.2 (1.2 to 8.4) | 30-39 | — | 40 | 0.0 (0.0 to 0.0) | 30-39 | — | |
| 50 | 5.8 (2.6 to 12.9) | 40-49 | — | 50 | 4.2 (0.6 to 26.1) | 40-49 | — | |
| 60 | 16.4 (7.6 to 33.2) | 50-59 | — | 60 | 20.8 (6.9 to 53.5) | 50-59 | — | |
| 70 | 16.4 (7.6 to 33.2) | 60-69 | — | 70 | 36.6 (13.6 to 75.9) | 60-69 | — | |
| — | — | 20-69 | — | — | — | 20-69 | — | |
| Thyroid cancer | 20 | 0.7 (0.1 to 4.6) | — | — | 20 | 0.0 (0.0 to 0.0) | — | — |
| 30 | 0.7 (0.1 to 4.6) | 20-29 | 0.0 (0.0 to 0.0) | 30 | 0.0 (0.0 to 0.0) | 20-29 | 0.0 (0.0 to 0.0) | |
| 40 | 1.7 (0.4 to 6.8) | 30-39 | 49.9 (0.7 to 277.6) | 40 | 0.0 (0.0 to 0.0) | 30-39 | 0.0 (0.0 to 0.0) | |
| 50 | 4.8 (1.7 to 12.8) | 40-49 | 104.4 (11.7 to 377.0) | 50 | 8.7 (2.2 to 30.5) | 40-49 | 255.0 (28.6 to 920.8) | |
| 60 | 7.8 (3.0 to 19.9) | 50-59 | 84.2 (1.1 to 468.7) | 60 | 17.8 (5.6 to 49.0) | 50-59 | 160.1 (2.1 to 890.6) | |
| 70 | 7.8 (3.0 to 19.9) | 60-69 | 0.0 (0.0 to 0.0) | 70 | 17.8 (5.6 to 49.0) | 60-69 | 0.0 (0.0 to 0.0) | |
| — | — | 20-69 | 57.9 (15.6 to 148.2) | — | — | 20-69 | 147.7 (29.7 to 431.7) | |
− = not assessed; AP = adenomatous polyps; CI = confidence interval. ca-index patients = index patients who had cancer before genetic testing.
Breast cancer
Fifty (25.6%) females, excluding ca-index patients, developed invasive or in situ BC at a median age of 43 years (IQR = 38-50 years), and 30 (12.5%) females had an incident BC at a median age of 42 years (IQR = 37-48 years). No males were diagnosed with BC.
BC risk in females excluding ca-index patients was 2.7% (95% CI = 1.0% to 6.9%), 54.3% (95% CI = 43.0% to 66.4%), and 59.5% (95% CI = 47.4% to 72.0%) at ages 30 years, 60 years, and 70 years, respectively. Risks for incident BC were consistently higher but more uncertain, with 10.1% (95% CI = 2.6% to 34.7%), 75.8% (95% CI = 60.7% to 88.4%), and 79.8% (95% CI = 64.6% to 91.5%), respectively. BC risk was strongly increased compared to the general population (SIR = 15.1, 95% CI = 11.1 to 19.9 and SIR = 25.3, 95% CI = 17.0 to 36.1, respectively). The highest statistically significant increase was observed between ages 30 years and 40 years (SIR = 23.6, 95% CI = 13.5 to 38.4 and SIR = 57.4, 95% CI 29.6 to 100.4, respectively). Risks after age 60 years were 4 to 6 times increased though not statistically significant.
Endometrial cancer
In females excluding ca-index patients, 13 (6.7%) developed EC at a median age of 49 years (IQR = 47-60 years). In total, 3 females (1.3%) had incident EC (ages 40 years, 42 years, and 50 years).
EC risk in females excluding ca-index patients was 1.2% (95% CI = 0.3% to 4.7%), 22.1% (95% CI = 11.6% to 39.6%), and 33.2% (95% CI = 15.6% to 61.7%) at ages 30 years, 60 years, and 70 years, respectively. Risk for incident EC was 6.4% (95% CI = 2.1% to 18.6%) from age 50 years onwards. SIRs were 48.4 (95% CI = 25.0 to 84.5) and 20.0 (95% CI = 4.0 to 58.4) respectively, with highest risk increases between ages 40 years and 50 years.
Thyroid cancer
In patients excluding ca-index patients, 13 (6.7%) females and 5 (3.3%) males developed TC. Incident TC was observed in 9 (3.8%) females and 3 (2.3%) males. The overall median ages were 42 years (IQR = 30-48 years) and 43 years (IQR = 39-48 years), respectively.
TC risk in patients excluding ca-index patients was 1.6% (95% CI = 0.7% to 3.8%), 8.9% (95% CI = 5.1% to 15.3%), and 16.5% (95% CI = 8.1% to 32.0%) at ages 30 years, 60 years, and 70 years. Risks for incident TC were 6.0% (95% CI = 1.5% to 22.3%), 20.5% (95% CI = 11.3% to 35.4%), and 29.3% (95% CI = 14.5% to 53.4%), respectively. Sex-specific risks at age 60 years were similar. TC risk was strongly increased compared to the general population (SIR = 42.9, 95% CI = 23.4 to 72.0 and SIR = 78.9, 95% CI = 36.0 to 149.7, respectively). TC risk was already statistically significantly increased compared to the general population between ages 10 years and 20 years (SIR = 90.3, 95% CI = 10.1 to 326.0 [2 events] and SIR = 365.3, 95% CI = 4.8 to 2032.5 [1 event], respectively). In both females and males, the highest risk increase was between ages 40 years and 50 years.
Colorectal cancer
In both cohorts, 4 patients (1.2% and 1.1%, respectively) developed CRC at a median age of 59 years (IQR = 53-64 years) and 60 years (IQR = 58-62 years), respectively.
In patients excluding ca-index patients, the CRC risk was 2.2% (95% CI = 0.5% to 9.8%) at age 60 years and 4.5% (95% CI = 1.3% to 14.8%) at age 70 years. Risks for incident CRC were 5.2% (95% CI = 1.3% to 19.2%) and 15.2% (95% CI = 5.4% to 38.6%), respectively. Risks were not statistically significantly increased compared to the general population when excluding ca-index patients (SIR = 2.2, 95% CI = 0.4 to 6.5) and slightly increased for incident cases (SIR = 5.6, 95% CI = 1.5 to 14.2).
In both cohorts, the risk for CRC and APs combined was approximately 10 times higher, with 29.8% (95% CI = 21.7% to 40.2%) and 52.2% (95% CI = 39.9% to 65.8%) at age 60 years, respectively. Based on modelled AP progression, risks at age 60 years ranged from 2.4% to 6.5% and from 5.5% to 16.6%, respectively.
Renal Cancer
In patients excluding ca-index patients, 3 (0.9%) developed RC (ages 33 years, 51 years, and 57 years), and 4 (1.1%) had incident RC at a median age of 53 years (IQR = 45-57 years).
In patients excluding ca-index patients, the RC risk was 3.3% (95% CI = 0.9% to 11.1%) from age 60 years onwards and 8.6% (95% CI = 3.3% to 21.6%) in the prospective analyses. RC risk was 9 to 21 times increased compared to the general population (SIR = 8.8, 95% CI = 1.8 to 25.6 and SIR = 21.2, 95% CI = 5.7 to 54.3, respectively).
Melanoma
In patients excluding ca-index patients, 9 (2.6%) developed melanoma at a median age of 30 years (IQR = 27-39 years), and 4 (1.1%) had incident melanoma at a median age of 53 years (IQR = 45-58 years).
Excluding ca-index patients, the risk of melanoma was 5.5% (95% CI = 2.4% to 12.1%) from age 60 years onwards. In the prospective analyses, risks were 7.3% (95% CI = 2.3% to 21.6%) and 11.7% (95% CI = 4.3% to 29.8%) by age 60 years and 70 years. Melanoma risk was approximately 7 times higher compared to the general population (SIR = 7.3, 95% CI = 3.3 to 13.9 and SIR = 6.6, 95% CI = 1.8 to 16.9, respectively).
Relative Cancer Risks by Variant Coding Effect and Domain
Female BC risk was consistently 2 to 3 times higher for truncating compared to missense variants (patients excluding ca-index patients: hazard ratio [HR] = 2.65, 95% CI = 1.29 to 5.48; prospective analyses: HR = 3.08, 95% CI = 1.16 to 8.17) in patients with a variant in the same domain and approximately 2 times for variants in PD compared to C2 in patients with the same type of variant (HR = 2.26, 95% CI = 0.89 to 5.73 and HR = 1.46, 95% CI = 0.45 to 4.70, respectively; Figure 3). This means that females with a PD truncating variant have the highest BC risk, those with a C2 missense variant have the lowest risk, and other groups have a more similar risk. Figure 4 shows these risks with the stratified BC risk curves by variant type and location.
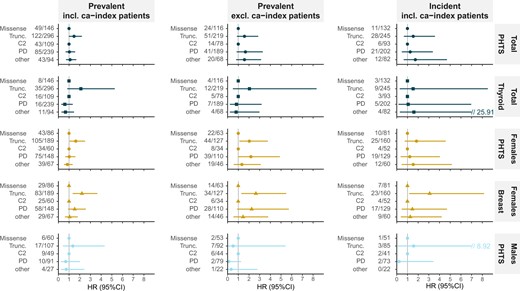
Relative risk for cancer per coding effect and domain. Hazard ratios (HRs) are presented with corresponding 95% confidence intervals (95% CIs) for the multivariable Cox regression, including coding effect and domain. For coding effect, missense was the reference category, and for domain, C2 was the reference category. The vertical dashed line indicates hazard ratio = 1.00, meaning no risk difference. For each group, the number of patients with the corresponding cancer type (n) and the total number of patients with the genotypic characteristics (N) are presented (n/N). The coding effect category “other” was not taken into account in Cox regression analyses (N = 1). Hazard ratios are presented for the prevalent cohort including index patients who had cancer before genetic testing (ca-index patients) (left), the prevalent cohort excluding ca-index patients (middle), and the incident cases including index patients (right) for the total population (upper 2 rows), females (third and fourth rows), and males (bottom row). Breast = breast cancer; C2 = C2 domain; other = other domain location than C2 or PD alone; PD = phosphatase domain; PHTS = PTEN Hamartoma Tumor Syndrome–related cancers; thyroid = thyroid cancer; Trunc.= truncating variants.
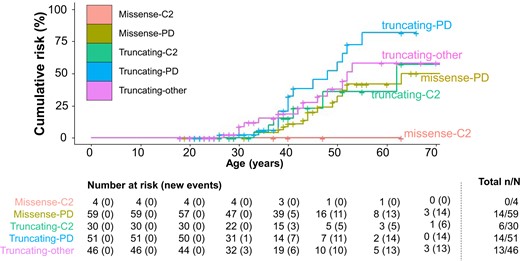
Genotype-specific cumulative breast cancer risks. For female breast cancer, the genotype-specific cumulative cancer risk by variant coding effect and domain is presented for the prevalent cohort excluding index patients who had cancer before genetic testing (ca-index patients). Per age category, the number of females at risk and cumulative number of breast cancer events are presented. At the end, the cumulative number of breast cancer events (n) and the total number of patients included in each genotypic category (N) are presented. C2 = C2 domain; missense = missense variants; other = other domain location than C2 or PD alone; PD = phosphatase domain; truncating = truncating variants.
For PHTS-related cancers, truncating variants were associated with a statistically non-significant, 1.5-times increased risk. In females, a stronger, potentially BC-driven, statistically non-significant effect was observed with 2-times higher risks in those with truncating compared to missense variants and of PD compared to C2 (Figure 3).
For TC, a statistically non-significant effect of up to 2-times increased risk was observed in those with truncating compared to missense variants.
The number of EC, CRC, RC, and melanoma events in the variant subgroups was too low for analysis.
Discussion
This large, European cohort study resulted in lower, more bias-corrected cancer risks than previously reported, with a predominant risk for female PHTS patients. Females were most at risk for BC (54.3% to 75.8%), EC (6.4% to 22.1%), and TC (9.9% to 23.0%) and males for TC (7.8% to 17.8%). CRC, RC, and melanoma risks were all less than 10.0% by age 60 years. Importantly, truncating variants were associated with 2 to 3 times higher BC risk compared to missense variants, with an additional approximately 2 times increased risk for variants in PD compared to domain C2. Despite that underlying mechanisms remain to be elucidated, these statistically significant genotype-specific BC risks warrant evaluation of genotype-related surveillance, especially evaluation of reduced BC surveillance for patients with missense variants in domain C2 because these variants are often observed in patients with (mild) developmental delay (22).
Female BC risks (54.3% to 75.8%, SIR = 15.1 to 25.3) were lower than in the literature (67%-78%, SIR = 22-39) (3), with a similar median age of 42-43 years (5,6,23). Overall BC risks are comparable with BRCA1/2 (24,25). Previous case-control studies showed no to moderately increased PTEN-associated BC risks (26–29). However, cohort studies would be more informative for rare syndromic conditions, especially because these patients are likely underrepresented in case-control studies (30). Current BC surveillance advice starting from age 25-30 years onward is supported by the youngest incident BC at 26 years and the statistically significant increased risk from age 20-30 years until age 50-60 years (8–11). From age 60 years onward, numbers were too small to reach statistical significance, though they indicate a four- to sixfold risk increase, which is similar to BRCA1/2-associated risk. This supports surveillance continuation outside population screening after age 60 years (24,31).
EC risks (6.4% to 22.1%) were lower than previous estimates (19%-28%) (3), with similar median ages of diagnosis (6). The EC risk was strongly increased (20 to 48 times) compared to the general population. This was more pronounced in the cohort excluding ca-index patients, being similar to previous findings (SIR = 48 vs 43-49) (6,23). Because both bias-corrected results indicated high increased risks, our study supports investigation of EC surveillance efficacy, especially because guidelines differ at this point (8–11).
TC risks (8.9% to 20.5%) were lower than previous estimates (6%-38%) (5,6,23). The youngest age was similar to that was found in the literature (9 years vs 7-16 years), and median ages were somewhat higher (42-43 years vs 31-37 years) (5,6,23,32). In contrast to other guidelines, European guidelines do not advise surveillance initiation in childhood (8–12). The pediatric-onset and statistically significantly increased risk between ages 10 years and 20 years in our analyses support surveillance initiation from age 10 years, with additional investigation of surveillance efficacy in childhood.
CRC risks (2.2% to 5.2% at age 60 years, SIR = 2.2 to 5.6) were lower than previously reported (9%-20%, SIR = 10-224), with a somewhat higher median age of diagnosis (59-60 years vs 46-58 years) (4–6,23,33). When modeling AP-to-CRC progression, risk at age 60 years remained low, with 2.4%-6.5% in the cohort excluding ca-index patients and 5.5%-16.6% in the prospective analyses. Because the risk is only slightly increased compared to the general population, a baseline colonoscopy around age 45 years might suffice (8) instead of regular colonoscopy for all PHTS patients (9–11).
RC risks (3.3% to 8.6% at age 60 years, SIR = 8.8 to 21.2) were lower (2%-11%, SIR = 11-49), and median age of diagnosis was similar compared to the literature (51 and 53 years vs 49-55 years) (4–6,23,34). Current recommendations vary between no surveillance and repeated surveillance starting at age 40 years (8–11). Our lower risks only support investigation of a baseline RC examination around age 45 years.
Melanoma was not often observed, and risks were similar to those found in the literature (5.5% to 7.3% at age 60 years vs 0%-6%), with somewhat lower SIRs (6.6 to 7.3 vs 9-39). Median ages at diagnosis were both lower and higher compared to the literature (30 and 53 years vs 40 years) (4,6,23). These risks and youngest diagnoses (20 and 28 years in respective cohorts) support baseline skin examination before age 30 years as stated in European and UK guidelines (8,11).
The numbers of non–PHTS-related cancers was low, and surveillance measures are not advised. Besides a few brain and haematological cancers, the spectrum of non–PHTS-related cancers was similar to the literature (3).
This is the largest cohort to date to our knowledge, with a median prospective follow-up of 6 years. Nevertheless, the number of patients at an older age (60+ years) and prospective follow-up remain limited, especially for subgroup evaluations and less prevalent cancers. Therefore, overall conclusions were based on risks at age 60 years, and continuous patient follow-up is needed for further risk evaluation and stratification. Risks for PHTS-related cancer and female BC by age 70 years are based on larger numbers and can be used for counseling.
In the prospective analyses, we observed higher BC, TC, and CRC cumulative risk and SIR estimates than in the cohort excluding ca-index patients. This could not be explained by differences in genotype, birth cohort, country of origin, or data sources (data not shown) and might be an effect of surveillance programs. Genetic testing bias likely hardly affects the results excluding ca-index patients, because only 18.7% of non-index patients had cancer at genetic testing, and other phenotypes may contribute to testing. Cancer risks from this large cohort can be used to counsel both selected and unselected patients; however, ethnicity should be considered because this cohort was mainly European, and risks between ethnicities may differ (35,36).
In addition to accurate cancer risk estimates, studies concerning the yield of surveillance programs are needed, in particular to define surveillance intervals and modules. Furthermore, evaluation of other risk factors and phenotypic clustering is needed to improve personalized risk stratification and our understanding of the PHTS cancer spectrum.
Taken together, females have a different BC risk depending on their PTEN germline variant, with additive two- to threefold risk increases for truncating variants and variants in PD, providing direction for more personalized cancer risk surveillance. We determined lower, more unbiased, and more personalized risks in PHTS for BC, EC, and TC than previously reported. CRC, RC, and melanoma risks were only slightly increased and should not be the main focus of attention in surveillance. Our study provides guidance for optimized cancer risk management in PHTS patients.
Funding
This work was supported by the PTEN Research Foundation (grant number 17-001 to L.A.J.H and J.R.V.); and the National Institute for Health Research (NIHR) Biomedical Research Centre Manchester (Grant Reference Number 1215-200074 to D.G.E. and E.R.W.).
Notes
Role of the funder: The funders had no role in the study design, data analysis, interpretation of the results, writing of the manuscript or the decision to submit the manuscript for publication.
Disclosures: The authors have no conflict of interest to declare.
Author contributions: Resources, Writing—review and editing: all authors; Investigation, Methodology, Visualization, Writing—original draft: L.A.J.H., J.R.V., N.H.
Prior presentations: Part of this research, and mainly preliminary results, has been presented at the Dutch hereditary breast and ovarian cancer congress (Virtual conference, November 2021), at the European Reference Network on Genetic Tumour Risk Syndromes (ERN GENTURIS) conference (Virtual conference, February 2022), and at the Joint UK/Dutch Clinical Genetics Societies and Cancer Genetics Group Meeting (Virtual conference, March 2022) and at the European Human Genetics Conference (Vienna, Austria, June 2022).
Acknowledgements: This research is supported (not financially) by the European Reference Network on Genetic Tumour Risk Syndromes (ERN GENTURIS)—Project ID No 739547. ERN GENTURIS is partly cofunded by the European Union within the framework of the Third Health Programme “ERN-2016—Framework Partnership Agreement 2017-2021”.
We thank the Dutch Nationwide Pathology Databank (PALGA) for retrieval of the pathology data and contribution to this study, and Iris D. Nagtegaal, department of Pathology, Radboudumc, Nijmegen for her contribution.
Data availability
Individual patient data cannot be shared due to privacy or ethical restrictions. Requests for aggregate study data can be submitted to the corresponding author.
References
Forman D, Bray F, Brewster DH, et al. Cancer Incidence in Five Continents, Vol. X. IARC Scientific Publication No. 164. Lyon: International Agency for Research on Cancer; 2014.

