


Abstract
Studies conducted in Swedish populations have shown that men with lowest prostate-specific antigen (PSA) levels at ages 44–50 years and 60 years have very low risk of future distant metastasis or death from prostate cancer. This study investigates benefits and harms of screening strategies stratified by PSA levels.
PSA levels and diagnosis patterns from two microsimulation models of prostate cancer progression, detection, and mortality were compared against results of the Malmö Preventive Project, which stored serum and tracked subsequent prostate cancer diagnoses for 25 years. The models predicted the harms (tests and overdiagnoses) and benefits (lives saved and life-years gained) of PSA-stratified screening strategies compared with biennial screening from age 45 years to age 69 years.
Compared with biennial screening for ages 45–69 years, lengthening screening intervals for men with PSA less than 1.0 ng/mL at age 45 years led to 46.8–47.0% fewer tests (range between models), 0.9–2.1% fewer overdiagnoses, and 3.1–3.8% fewer lives saved. Stopping screening when PSA was less than 1.0 ng/mL at age 60 years and older led to 12.8–16.0% fewer tests, 5.0–24.0% fewer overdiagnoses, and 5.0–13.1% fewer lives saved. Differences in model results can be partially explained by differences in assumptions about the link between PSA growth and the risk of disease progression.
Relative to a biennial screening strategy, PSA-stratified screening strategies investigated in this study substantially reduced the testing burden and modestly reduced overdiagnosis while preserving most lives saved. Further research is needed to clarify the link between PSA growth and disease progression.
It has long been understood that controlling the harm–benefit trade-off of prostate-specific antigen (PSA) screening is critical for its sustainability. Strategies for reducing harms while preserving benefits include screening less frequently, using higher thresholds for biopsy referral in older men, and tailoring screening algorithms by PSA level (1–15).
The recommendation to stratify screening by PSA level is largely based on studies that stored ethylenediamine tetraacetic acid plasma in an unscreened cohort of Swedish men aged 44–60 years in the 1980s (4,11,12,16,17). Prostate cancer cases diagnosed up to 25 years later had statistically significantly higher PSA levels at their baseline blood draw than those not diagnosed. There was also a strong association between baseline PSA and prostate cancer mortality: 44% of prostate cancer deaths occurred in men with PSA in the top 10% of the PSA distribution at ages 44–49 years (12). In addition, only 0.2% of men with PSA below 1.0 ng/mL at age 60 years died from prostate cancer within 25 years (11). Other studies, including screened and unscreened cohorts, have confirmed that baseline PSA predicts the risk of future prostate cancer diagnosis or prostate cancer death (5–7,13,15,18). These studies have motivated proposals to tailor the screening intensity to a man’s current PSA level. However, the implications of such stratified policies for clinically important outcomes, such as prostate cancer deaths or overdiagnosis, compared with current practices have not been evaluated. Despite this, some guidelines are already incorporating PSA-stratified screening. The European Association of Urology guideline states that targeting men at a higher risk of prostate cancer (older than age 50 years, or with PSA >1.0 ng/mL at age 40 years, or >2.0 ng/mL at age 60 years) might reduce the number of unnecessary biopsies (19). The American Urological Association guideline suggests that baseline PSA may be used to guide alternative screening strategies that screen less frequently (20).
Some studies have attempted to evaluate the relative harms and benefits of different PSA-based screening strategies. Multiple studies using data from the European Randomized Study of Screening for Prostate Cancer support using a screening interval of 8 years in men with initial PSA levels below 1.0 ng/mL (8–10,14). A modeling study showed that switching from annual to biennial screening when PSA is less than 2.5 ng/mL did not affect the probabilities of detection and overdiagnosis (2). Although it is believed that screening intervals longer than 2 years delay the diagnosis of aggressive cancers yet still detect most indolent cancers, there are few studies with quantitative predictions.
This study analyzes harm–benefit trade-offs associated with lengthening the screening interval when PSA is below 1.0 ng/mL at age 45 or 50 years or discontinuing screening when PSA is below 1.0 ng/mL at age 60 years. We focus specifically on how these policies are likely to affect clinically important outcomes like lives saved and overdiagnosis. Ultimately, we aim to determine how stratified screening might change the balance between harms and benefits of screening compared with using a single screening strategy for the entire population.
Methods
Microsimulation Models
Two microsimulation models—the Erasmus University Medical Center-MIcrosimulation SCreening ANalysis (Erasmus-MISCAN) model and the Fred Hutchinson Cancer Research Center (FHCRC) model—were used. The models were independently developed within the Cancer Intervention and Surveillance Modeling Network to describe the natural history of prostate cancer and to investigate disease progression and survival given screening and primary treatment. The two models have been described previously (https://resources.cisnet.cancer.gov/registry) (2,3,21,22). In both models, a virtual population of individuals can develop cancer and progress through a sequence of states defined by clinical stages and Gleason grades. The Erasmus-MISCAN model permits grade progression after onset whereas the FHCRC model does not; rather, the FHCRC model allocates a specific grade at onset, with older men more likely to be assigned high-grade disease. Both models include individual-specific PSA trajectories that accelerate after disease onset. The FHCRC model links PSA growth (increasing levels of PSA in blood) with disease progression; patients with high PSA doubling times are more likely to progress slowly. The Erasmus-MISCAN model does not link PSA growth with disease progression; in this model, cases with high PSA doubling times are as likely to progress quickly or slowly (see Supplementary Materials available online). If a PSA level at a designated screening age exceeds a specified threshold for referral to biopsy and disease is present, it is diagnosed depending on the biopsy frequency and sensitivity to detect latent cancer. The model states and primary determinants of state transitions are presented in Figure 1.
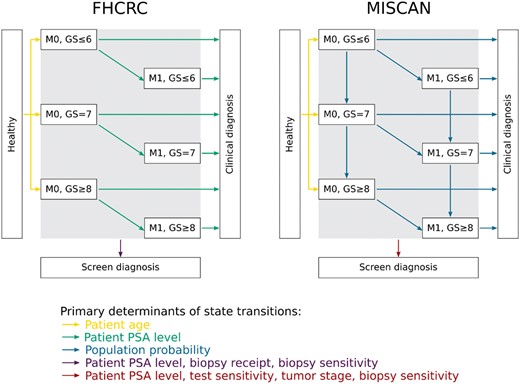
The structures of the Fred Hutchinson Cancer Research Center (FHCRC) model and the Erasmus University Medical Center-MIcrosimulation SCreening ANalysis (Erasmus-MISCAN) model. PSA = prostate-specific antigen.
Both models generate prostate cancer survival from clinical diagnosis in the absence of screening or localized treatment benefit (23) based on Cox regression models fit to Surveillance, Epidemiology, and End Results (SEER) survival data (Supplementary Materials available online) before the widespread adoption of PSA screening. This survival is improved for localized cases who receive radical prostatectomy, or radiation therapy, using a hazard ratio of 0.56 (24). Distributions of treatments depending on age, Gleason score, and stage are based on multinomial regression models fit to SEER cases diagnosed in the year 2012, just before the US Preventive Services Task Force recommendation against PSA screening (25).
The mortality benefit of PSA screening is modeled via a cure probability that increases with the lead time. The lead time is the interval by which detection of the cancer is advanced by screening and is produced as an individual-level output under any specified screening policy (26). In both models, the cure probability is calibrated to reproduce the mortality rate ratio in the European Randomized Study of Screening for Prostate Cancer (26). Deaths due to noncancer causes are generated independently based on US life tables. The primary harm of PSA screening is overdiagnosis, which is the diagnosis of cancer that would not have been diagnosed during the patient’s lifetime in the absence of screening.
Calibration
Malmö Preventive Project data provided to us for this study consisted of summary tables of PSA quantiles and 25-year predicted probabilities of diagnosis given log PSA levels for men ages 44–50 years at the time of blood draw. Individual PSA levels and 25-year case-control status for men age 60 years at the time of blood draw were also provided (see Supplementary Materials, available online).
To compare modeled PSA distributions at ages 44–50 years and age 60 years with the Malmö data, we calculated densities of individual PSA levels simulated by the models at the corresponding ages. To compare probabilities of diagnosis within 25 years of these ages predicted by the models and by using Malmö data, we fitted logistic regressions of 25-year case status to log observed and modeled PSA levels.
In the FHCRC model, previously estimated PSA growth and natural history parameter values reasonably approximated the Malmö results over the bulk of the range of observed PSA values and were used without additional calibration (21). In the Erasmus-MISCAN model, the PSA growth parameters were reestimated in combination with the parameters for onset of prostate cancer by calibrating to the PSA distribution in the Malmö study and to SEER incidence in the period 1990–2002 (see Supplementary Materials, available online). Since opportunistic screening was increasing during the late 1990s in the Malmö area (27,28), predicted probabilities of diagnosis from the Malmö study until 1995 and 2000 (15 and 20 years of follow-up) for the 44- to 50-year-olds provided by the Malmö study investigators, were also compared with the model predictions.
Screening Strategies
Using the calibrated models, we simulated cohorts of men in the United States age 45 or 50 years in 2017 and followed until age 85 years. We implemented the following screening strategies: screening up to age 69 years with 2-year intervals; lengthening the screening interval to 8 years for baseline PSA less than 1.0 ng/mL but decreasing again to 2 years when PSA is greater than 1.0 ng/mL at a later screen; stopping screening when PSA is less than 1.0 ng/mL at age 60 years and older; or a combination of the last two strategies. For reference, we also implemented strategies that stop screening all men at age 60 years. In all strategies, a PSA threshold of 4.0 ng/mL was used. To evaluate the optimal strategy, a 100% attendance rate to each screen was specified, and positive screens were followed with a biopsy compliance and sensitivity of 100%. For each screening policy, we projected the number of tests conducted, cancers diagnosed (screen and clinically detected), overdiagnoses, lives saved, and life-years gained.
Results
Comparison of Calibrated Models With Malmö Results
The calibrated models reasonably replicated the PSA distributions at ages 44–50 years and at age 60 years in the Malmö study (Figures 2 and 3). The median PSA values in the models were within 0.2 ng/mL of the median in Malmo at ages 44–50 years and 60 years. The 25-year probability of diagnosis in the absence of screening predicted by the FHCRC model slightly overpredicted the Malmö results, particularly in the upper tail of the PSA distribution at ages 44–50 years, where data were sparse. A similar pattern was observed in the comparison of the 15- and 20-year FHCRC predictions with the corresponding Malmö results (Supplementary Materials, available online). The 25-year probability of diagnosis in the absence of screening predicted by the Erasmus-MISCAN model considerably underpredicted the Malmö results, but the 15- and 20-year predictions were much closer to the observed data.
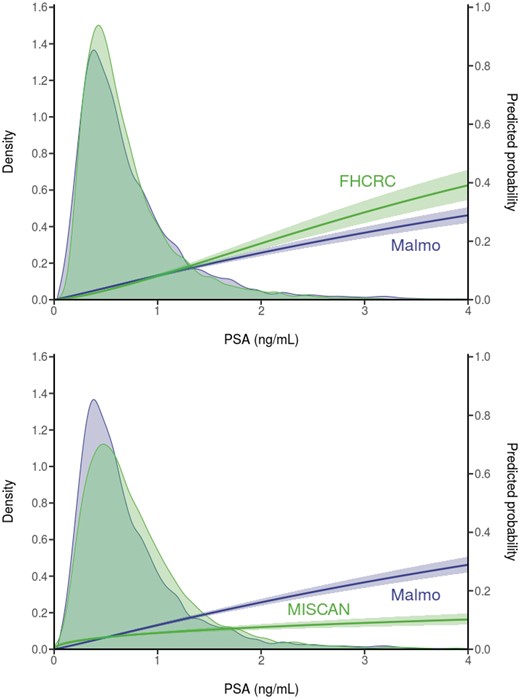
Observed prostate-specific antigen (PSA) distributions and predicted 25-year risk of diagnosis based on empirical data from the Malmö Preventive Project (N = 10 357) and corresponding model projections in the absence of screening for men ages 44–50 years. Both empirical and model projections are derived from logistic regression models for event of disease diagnosis over 25 years in either the empirical or the modeled data. Erasmus-MISCAN = Erasmus University Medical Center-MIcrosimulation SCreening ANalysis; FHCRC = Fred Hutchinson Cancer Research Center.
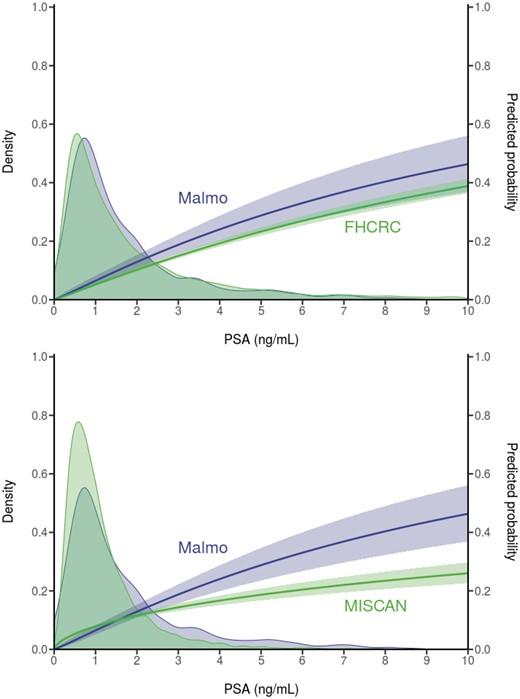
Observed prostate-specific antigen (PSA) distributions and predicted 25-year risk of diagnosis based on empirical data from the Malmö Preventive Project (N = 1162) and corresponding model projections in the absence of screening for men aged 60 years. Both empirical and model projections are derived from logistic regression models for event of disease diagnosis over 25 years in either the empirical or the modeled data. Erasmus-MISCAN = Erasmus University Medical Center-MIcrosimulation SCreening ANalysis; FHCRC = Fred Hutchinson Cancer Research Center.
Predictions of Calibrated Models Under Stratified Screening
The models projected that screening 10 000 men ages 45–69 years biennially would require more than 110 000 screens, yield 277 (Erasmus-MISCAN model) to 348 (FHCRC model) overdiagnoses, save 110 (Erasmus-MISCAN model) to 160 (FHCRC model) lives, and gain 921 (Erasmus-MISCAN model) to 1312 (FHCRC model) life-years relative to no screening (Table 1). The predicted reduction in prostate cancer mortality (assuming 100% adherence and biopsy compliance) was 38.6% for the Erasmus-MISCAN model and 53.3% for the FHCRC model compared with a no-screening scenario.
Results of the biennial screening strategies starting at age 45 y*
| Model outcome | No screening,No. | Screening ages 45–69 y every 2 y | Screening ages 45–59 y every 2 y, No. (%‡) | |||
|---|---|---|---|---|---|---|
| (a) No stratification, No. | (b) 8 y if PSA <1.0 ng/mL, change to 2 y if PSA >1.0 ng/mL, No. (%‡) | (c) Stop if PSA <1.0 ng/mL at age ≥60 y, No. (%‡) | (b) and (c), No. (%‡) | |||
| Erasmus-MISCAN | ||||||
| Tests | 0 | 116 172 | 61 751 (−46.8) | 97 533 (−16.0) | 55 555 (−52.2) | 76 273 (−34.3) |
| Cancers detected | 966 | 1270 | 1263 (−0.6) | 1196 (−5.8) | 1194 (−6.0) | 1020 (−19.7) |
| Screen detected | 0 | 740 | 717 (−3.1) | 591 (−20.1) | 582 (−21.3) | 202 (−72.7) |
| Overdiagnosed | 0 | 277 | 271 (−2.1) | 211 (−24.0) | 209 (−24.4) | 51 (−81.7) |
| Lives saved† | 0 | 110 | 106 (−3.8) | 95 (−13.1) | 94 (−14.8) | 49 (−55.4) |
| Life-years gained | 0 | 921 | 881 (−4.4) | 850 (−7.6) | 826 (−10.3) | 571 (−38.0) |
| Overdiagnosis per life saved | 2.5 | 2.6 | 2.2 | 2.2 | 1.0 | |
| FHCRC | ||||||
| Tests | 0 | 112 849 | 59 846 (−47.0) | 98 379 (−12.8) | 55 233 (−51.1) | 74 986 (−33.6) |
| Cancers detected | 1130 | 1479 | 1476 (−0.2) | 1460 (−1.3) | 1459 (−1.4) | 1203 (−18.7) |
| Screen detected | 0 | 1115 | 1108 (−0.6) | 1065 (−4.5) | 1060 (−4.9) | 424 (−62.0) |
| Overdiagnosed | 0 | 348 | 345 (−0.9) | 329 (−5.5) | 328 (−5.7) | 72 (−79.3) |
| Lives saved† | 0 | 160 | 155 (−3.1) | 152 (−5.0) | 148 (−7.5) | 84 (−47.5) |
| Life-years gained | 0 | 1312 | 1251 (−4.6) | 1270 (−3.2) | 1217 (−7.2) | 882 (−32.8) |
| Overdiagnosis per life saved | – | 2.2 | 2.2 | 2.2 | 2.2 | 0.9 |
All results are given per 10 000 men, followed until age 85 years. Erasmus-MISCAN = Erasmus University Medical Center-MIcrosimulation SCreening ANalysis; FHCRC = Fred Hutchinson Cancer Research Center; PSA = prostate-specific antigen.
In the absence of screening, the Erasmus-MISCAN model predicted 285 prostate cancer deaths, the FHCRC model 300.
The percentages compare the results with the no-stratification results (a) screening ages 45–69 years every 2 years.
Relative to this nonstratified policy, the Erasmus-MISCAN model predicted that lengthening the screening interval from 2 to 8 years when PSA is less than 1.0 ng/mL at age 45 years would reduce the screen tests by 46.8%, overdiagnoses by 2.1%, and lives saved by 3.8%. The FHCRC model predicted a 47.0% reduction in screen tests, 0.9% reduction in overdiagnosis, and 3.1% reduction in lives saved.
Relative to the same nonstratified policy, the Erasmus-MISCAN model predicted that early cessation when PSA is less than 1.0 ng/mL at age 60 years and older would decrease overdiagnoses by 24.0% and lives saved by 13.1%. The FHCRC model projected a modest impact of early cessation with a 5.5% reduction in overdiagnosis and a 5.0% reduction in lives saved relative to the nonstratified biennial screening policy.
When combining PSA-stratified screening intervals at age 45 years and early cessation at age 60 years, the Erasmus-MISCAN model projected a 52.2% reduction in screening tests, a 24.4% reduction in overdiagnoses, and a 14.8% reduction in lives saved. The FHCRC model projected a 51.1% reduction in screening tests, a 5.7% reduction in overdiagnoses, and a 7.5% reduction in lives saved.
The ratio of overdiagnoses to lives saved was 2.2 for all strategies for the FHCRC model. The Erasmus-MISCAN model predicted a slightly higher ratio of overdiagnosis to lives saved for biennial screening for all ages 45–69 years (ratio = 2.5) and for lengthening the screening interval from 2 to 8 years when PSA is less than 1.0 ng/mL (ratio = 2.6).
Finally, the models predicted that discontinuing screening at age 60 years for everyone would greatly reduce overdiagnoses (by 79.3–81.7%) but would save substantially fewer lives (47.5–55.4%) and life-years gained (34.3–33.6%) compared with screening until age 69 years.
The results for strategies starting at age 50 years were comparable with those for strategies starting at age 45 years (Table 2).
Results of the biennial screening strategies starting at age 50 y*
| Model outcome | No screening, No. | Screening ages 50–69 y every 2 y | Screening ages 50–59 y every 2 y, No. (%‡) | |||
|---|---|---|---|---|---|---|
| (a) No stratification, No. | (b) 8 y if PSA <1.0 ng/mL, change to 2 y if PSA >1.0 ng/mL, No. (%‡) | (c) Stop if PSA <1.0 ng/mL at age ≥60 y, No. (%‡) | (b) and (c), No. (%‡) | |||
| Erasmus-MISCAN | ||||||
| Tests | 0 | 87 959 | 50 473 (−42.6) | 68 458 (−22.2) | 46 716 (−46.9) | 47 142 (−46.4) |
| Cancers detected | 966 | 1231 | 1227 (−0.4) | 1162 (−5.6) | 1212 (−1.6) | 1007 (−18.2) |
| Screen detected | 0 | 658 | 642 (−2.4) | 513 (−22.0) | 612 (−7.0) | 157 (−76.1) |
| Overdiagnosed | 0 | 243 | 239 (−1.7) | 180 (−25.7) | 219 (−9.6) | 39 (−83.7) |
| Lives saved† | 0 | 101 | 97 (−3.4) | 85 (−15.2) | 94 (−6.4) | 39 (−61.0) |
| Life-years gained | 0 | 782 | 757 (−3.2) | 702 (−10.2) | 748 (−4.4) | 408 (−47.9) |
| Overdiagnosis per life saved | 2.4 | 2.5 | 2.1 | 2.3 | 1 | |
| FHCRC | ||||||
| Tests | 0 | 85 078 | 50 050 (−41.2) | 69 625 (−18.2) | 48 110 (−43.5) | 46 233 (−45.7) |
| Cancers detected | 1130 | 1440 | 1439 (−0.1) | 1422 (−1.3) | 1433 (−0.5) | 1188 (−17.5) |
| Screen detected | 0 | 1039 | 1034 (−0.5) | 987 (−5.0) | 1020 (−1.8) | 362 (−65.2) |
| Overdiagnosed | 0 | 310 | 308 (−0.6) | 291 (−6.1) | 302 (−2.6) | 57 (−81.6) |
| Lives saved† | 0 | 152 | 149 (−2.0) | 143 (−5.9) | 147 (−3.3) | 72 (−52.6) |
| Life-years gained | 0 | 1239 | 1197 (−3.4) | 1189 (−4.0) | 1188 (−4.1) | 758 (−38.8) |
| Overdiagnosis per life saved | – | 2.0 | 2.1 | 2.0 | 2.1 | 0.8 |
All results are given per 10 000 men, followed until age 85 years. Erasmus-MISCAN = Erasmus University Medical Center-MIcrosimulation SCreening ANalysis; FHCRC = Fred Hutchinson Cancer Research Center; PSA = prostate-specific antigen.
In the absence of screening, the Erasmus-MISCAN model predicted 285 prostate cancer deaths, the FHCRC model 300.
The percentages compare the results with the no-stratification results (a) screening ages 50–69 years every 2 years.
Discussion
This study used modeling to explore the likely policy implications of stratifying prostate cancer screening strategies by PSA level. Such approaches have been strongly suggested by retrospective data from the Malmö Preventive Project and other cohorts on disease incidence in relation to baseline PSA, but their impact on clinically important downstream outcomes has never been prospectively evaluated.
Modeling is of value in this setting because it enables the translation of observed data on cumulative disease incidence given PSA into projected harm–benefit trade-offs for specific stratified screening policies. The results show that the proximal effect of stratifying screening by PSA level is a marked reduction in the number of tests by 50% compared with a biennial screening strategy for all men.
Although the models suggest that stratified screening is likely to affect overdiagnoses and lives saved, quantitative results appear to depend on the specific model used. The Erasmus-MISCAN and FHCRC models make different assumptions about disease natural history and, in particular, about how PSA levels are linked with progression. This may explain why the models produce different overdiagnosis results under PSA-stratified screening at age 60 years. At this age, most men with PSA less than 1.0 ng/mL are cancer free. In the Erasmus-MISCAN model, slowly progressing and potentially overdiagnosed cancers that develop after this point may have either fast or slow PSA growth. The potential overdiagnoses with fast PSA growth will be screen detected if screening continues beyond age 60 years and are prevented when screening stops early. Therefore, early cessation for low PSA leads to a reduction in overdiagnosis in the Erasmus-MISCAN model. In the FHCRC model, slowly progressing and potentially overdiagnosed cancers that develop after age 60 years generally have slow PSA growth. The potential overdiagnoses with slow PSA growth will generally not be screen detected even if screening continues because they will tend to remain below the screen-positive threshold of 4.0 ng/mL until after age 69 years when screening stops for all men. Therefore, early cessation for men with low PSA levels does not lead to a meaningful reduction in overdiagnosis in the FHCRC model.
Overdiagnoses avoided with early cessation are 60 of 10 000 men for the Erasmus-MISCAN model and 19 of 10 000 for the FHCRC model. These results are both lower than the estimate of 171 of 10 000 overdiagnoses avoided over 15 years from early cessation based on comparing 15-year incidence in the screening arm of the Göteborg trial to incidence from the unscreened Malmö cohort, conditional on PSA level at age 60 years (4). A partial reason for the discrepancy may be that this study uses excess incidence over 15 years as a proxy for overdiagnosis, whereas the models explicitly calculate the frequency of overdiagnosis in the simulated cohorts under the different screening policies.
There are also differences between the models and empirical studies with respect to the risk of prostate cancer–specific death in men with low PSA. In the mostly unscreened Malmö cohort, the death rate for men with PSA less than 1.0 ng/mL at age 60 years was 20 per 10 000 by age 85 years (11). In contrast, the models project a higher risk of prostate cancer–specific death for these men: 85 (FHCRC model) and 140 (Erasmus-MISCAN model) per 10 000 men by age 85 years. Because models project a higher risk of death for men with PSA less than 1.0 ng/mL at age 60 years than that estimated in the Malmö study, they also project a more pronounced impact on lives saved associated with stopping screening when PSA is less than 1.0 ng/mL at age 60 years.
Although using two models that simultaneously approximate high-dimensional empirical data from two sources creates some robustness around the main result, it also leaves the primary scientific question partially unanswered. The models concur that a key effect of stratifying screening by PSA level is a large reduction in testing burden. The models also agree about the effects of lengthening screening intervals for men with low PSA. The models predict quantitatively different effects of early cessation for men with low PSA at age 60 years and older. Nevertheless, the models agree qualitatively across all settings that PSA-stratified strategies will lead to modest reductions in both overdiagnoses and lives saved, and therefore these strategies are ready to be evaluated in a clinical setting.
Limitations of this study include the necessary simplification of biology represented by disease models and the difficulty in quantifying uncertainty around model projections. Discrepancies between the empirical and model-predicted probabilities of prostate cancer diagnosis may be due at least in part to the unknown proportion of men who received screening tests in the later years in Sweden, which probably increased the probability of diagnosis in the observed data, and to the low number of men with baseline PSA greater than 1.5 ng/mL, leading to uncertainty in the predicted probability of diagnosis for men with PSA levels in this range. Several assumptions were made to simplify comparisons across strategies. We assumed 100% of men received biopsy after a positive PSA test. In practice, receipt of biopsy after a positive PSA test depends on patient risk factors, preferences, and comorbidities. Lower receipt of biopsy, particularly in low-risk men, is likely to reduce overdiagnosis more than it reduces lives saved under both stratified and nonstratified strategies. We also assumed receipt of definitive treatment based on patient age and tumor grade. In practice, genomic profiling, imaging, and other technologies can guide treatment selection. Our results with the greatest uncertainty concern overdiagnosis, which cannot be accurately predicted for individual patients.
An additional benefit of screening is the reduction in metastases at diagnosis and after diagnosis (29). Effects of risk-stratified screening on this endpoint, and implications for quality of life, should be examined in future research.
Less intensive PSA screening in men with low PSA levels can substantially reduce the testing burden. The specific quantitative impact on overdiagnosis and lives saved is sensitive to the model used, but both models project that stratifying screening by PSA level is expected to reduce overdiagnosis by a modest amount while preserving the majority of the benefit of screening. Depending on how these harms and benefits are valued, our results confirm that PSA-based stratification could lead to more efficient use of the PSA test in early detection of prostate cancer.
Funding
This work was supported by the National Cancer Institute (U01CA199338; R50CA221836) as part of the Cancer Intervention and Surveillance Modeling Network. Its contents are solely the responsibility of the authors and do not necessarily represent the official views of the National Cancer Institute.
This work was also supported in part by a Cancer Center Support Grant to Memorial Sloan Kettering Cancer Center (P30CA008748), a SPORE grant in Prostate Cancer to Dr H. Scher (P50CA92629), the Sidney Kimmel Center for Prostate and Urologic Cancers, and David H. Koch through the Prostate Cancer Foundation.
Notes
The study sponsors had no role in the design of the study; the collection, analysis, and interpretation of the data; the writing of the manuscript; and the decision to submit the manuscript for publication.
Dr A. J. Vickers is a co-inventor on US patent # 9,672,329 for a statistical method to predict the result of prostate biopsy. Patent has been commercialized and will receive royalties from clinical use. He is a co-inventor of the 4kscore and may receive royalties from sales of the test. He owns stock options in Opko, which offers the test.
We thank Dr Hans Lilja for providing access to the data of the Malmö Preventive Project.
References
Author notes
Eveline A.M. Heijnsdijk and Roman Gulati contributed equally to this work.

