


Abstract
Although 20 pancreatic cancer susceptibility loci have been identified through genome-wide association studies in individuals of European ancestry, much of its heritability remains unexplained and the genes responsible largely unknown.
To discover novel pancreatic cancer risk loci and possible causal genes, we performed a pancreatic cancer transcriptome-wide association study in Europeans using three approaches: FUSION, MetaXcan, and Summary-MulTiXcan. We integrated genome-wide association studies summary statistics from 9040 pancreatic cancer cases and 12 496 controls, with gene expression prediction models built using transcriptome data from histologically normal pancreatic tissue samples (NCI Laboratory of Translational Genomics [n = 95] and Genotype-Tissue Expression v7 [n = 174] datasets) and data from 48 different tissues (Genotype-Tissue Expression v7, n = 74–421 samples).
We identified 25 genes whose genetically predicted expression was statistically significantly associated with pancreatic cancer risk (false discovery rate < .05), including 14 candidate genes at 11 novel loci (1p36.12: CELA3B; 9q31.1: SMC2, SMC2-AS1; 10q23.31: RP11-80H5.9; 12q13.13: SMUG1; 14q32.33: BTBD6; 15q23: HEXA; 15q26.1: RCCD1; 17q12: PNMT, CDK12, PGAP3; 17q22: SUPT4H1; 18q11.22: RP11-888D10.3; and 19p13.11: PGPEP1) and 11 at six known risk loci (5p15.33: TERT, CLPTM1L, ZDHHC11B; 7p14.1: INHBA; 9q34.2: ABO; 13q12.2: PDX1; 13q22.1: KLF5; and 16q23.1: WDR59, CFDP1, BCAR1, TMEM170A). The association for 12 of these genes (CELA3B, SMC2, and PNMT at novel risk loci and TERT, CLPTM1L, INHBA, ABO, PDX1, KLF5, WDR59, CFDP1, and BCAR1 at known loci) remained statistically significant after Bonferroni correction.
By integrating gene expression and genotype data, we identified novel pancreatic cancer risk loci and candidate functional genes that warrant further investigation.
Pancreatic cancer is the third leading cause of cancer deaths in the United States (1) and seventh worldwide (2). Established risk factors include tobacco smoking, long-standing diabetes, obesity, heavy alcohol consumption, chronic pancreatitis, and family history of pancreatic cancer (3). Inherited rare mutations in hereditary cancer and pancreatitis genes, identified in families with a high incidence of disease, account for a small percentage of cases (4). At the other end of the spectrum, common risk variants with low penetrance have been discovered through genome-wide association studies (GWAS) (5–11). However, these loci explain a small fraction of genetic heritability for pancreatic cancer, and the genes underlying the associations at most of these are unknown (11–14).
Most susceptibility alleles discovered through GWAS reside in noncoding regions of the genome and likely function through allele-specific regulation of gene expression (15). A transcriptome-wide association study (TWAS) builds on this premise by imputing genetically predicted gene expression levels into GWAS datasets to discover genes whose cis-regulated expression is associated with complex traits (16–18). This approach has been applied to several common diseases, including melanoma, breast, prostate, and ovarian cancers (19–24). In this comprehensive TWAS for pancreatic cancer, we leveraged two expression quantitative trait loci (eQTL) datasets generated from histologically normal pancreatic tissue samples from individuals of European ancestry (25,26), with GWAS summary statistics [Pancreatic Cancer Cohort Consortium (PanScan) I–III and Pancreatic Cancer Case-Control Consortium (PanC4) (6–11)] to identify genes associated with risk of pancreatic cancer.
Methods
Transcriptome and Genotype Datasets
Two histologically normal-derived pancreatic expression datasets, the National Cancer Institute’s Laboratory of Translational Genomics (LTG) (25) and the Genotype-Tissue Expression (GTEx, v7) (27), were used. Only samples with more than 80% European ancestry were included (LTG, n = 95; GTEx, n = 174). Alignment of RNA-seq reads from the LTG data (Illumina HiSeq 2000, phs001776.v1.p1) was performed using STAR v2.4.2a (28) based on GENCODE v19 gene annotations (GRCh37/hg19). For GTEx, gene expression read counts (Illumina HiSeq 2000/2500) for pancreatic tissue samples were obtained through controlled access (phs000424.v7.p2). The LTG and GTEx pancreatic transcriptome datasets were also combined for genes expressed in both datasets (see Supplementary Methods, available online).
Blood- or normal tissue–derived DNA samples (LTG dataset) were genotyped on Illumina OmniExpress or Omni1M arrays (25). After quality control, genotypes were imputed using the 1000 Genomes imputation reference dataset via the Michigan Imputation Server (29). Genotypes for GTEx samples were obtained via dbGaP (phs000424.v7.p2). Principal components were calculated for genotype data using SNPRelate (30). Gene expression values were adjusted for five principal components, probabilistic estimation of expression residuals factors (31), and gender.
Building Pancreatic Tissue Gene Expression Prediction Models
Expression prediction models were computed in FUSION (17) using variants ±500 kb of each gene. Genes with nominally significant cis–single-nucleotide polymorphism (SNP)-heritability (likelihood ratio test P < .05) and cross-validation (R2 > 0.01) were used to train TWAS prediction models with a fivefold cross-validation. Prediction models were also computed using MetaXcan (16) for variants ±1 Mb of each gene. The model for each gene was implemented in the glmnet R package, with a ridge-lasso mixing parameter (α = 0.5) and a penalty parameter lambda chosen through 10-fold cross-validation (32). Model performance was compared across the three expression datasets (LTG, GTEx, and LTG + GTEx) and two TWAS methods (FUSION and MetaXcan) showing good correlation (Supplementary Figure 1, available online). For cross-tissue TWAS, we used gene expression prediction models for 48 different human tissues from PredictDB (http://predictdb.org/) (16). These models were trained using GTEx (v7) data for European participants only, using PrediXcan (see Supplementary Methods, available online).
TWAS Association Analysis
The pancreatic cancer GWAS summary statistics included 9040 pancreatic ductal adenocarcinoma (PDAC) cases and 12 496 controls of European ancestry from PanScan I–III and PanC4 (11). Using FUSION and MetaXcan, associations between predicted expression and pancreatic cancer risk were estimated based on gene prediction model weights, GWAS summary statistics, and a SNP-correlation (linkage disequilibrium) matrix (17,22). A false discovery rate (FDR) corrected P value threshold of less than .05 was used for each analysis. Bonferroni correction for multiple testing was also used based on the number of tests in each analysis (Supplementary Figure 2, available online). Finally, we used Summary-MulTiXcan (SMulTiXcan) (33) to test associations between predicted gene expression levels and pancreatic cancer risk with cross-tissue models. Quantile-quantile plots are shown in Supplementary Figure 3 (available online).
We assessed statistical power by simulating gene expression and GWAS summary statistics using data from PanScan I–III and PanC4 (11). Parameters included the number of causal SNPs for gene expression in the cis region, the fraction of gene expression variance explained by causal SNPs, and the fraction of phenotypic variance explained by gene expression. We varied H2 (, 0.1, 0.3, and 0.5), causal SNPs (1, 1%, and 10%), and R2 (, 0 to 0.001) and recomputed each configuration 100 times to assess how often the TWAS and GWAS tests were statistically significant (TWAS P < 2.27 × 10⁻⁶ [.05/22k]; GWAS P < 5 × 10⁻⁸) (Supplementary Figure 4 and Methods, available online).
Transcriptome Differences and Pathway Analyses for TWAS-Identified Genes
Transcriptome changes associated with high and low expression of genes identified by TWAS in the LTG and GTEx pancreatic datasets were assessed by comparing gene expression for samples in the bottom quartile with those in the top quartile of expression for each gene using EdgeR (34,35). Genes differentially expressed at FDR less than .05 and fold-change greater than twofold (|logFC| > 1) were included in pathway analyses using DAVID (36,37) to identify enrichment in Gene Ontology (GO) biological processes, GO molecular functions, and Kyoto Encyclopedia of Genes and Genomes pathways (Supplementary Methods, available online).
Statistical Analyses
Expression prediction models (LASSO, Elastic Net, BLUP, BSLMM) were selected for genes with nominally significant SNP-heritability (cis- LRT P < .05) and cross-validation (R2 > 0.01). Logistic and linear (LASSO) models were used in GWAS and TWAS simulations for power estimates. TWAS P values were determined from calculated TWAS z scores and adjusted at FDR less than .05. For increased stringency, nominal TWAS P values were also compared with a Bonferroni corrected α threshold. Independence of SNPs and predicted expression effects on pancreatic cancer risk were tested by conditional (joint) tests using GWAS and TWAS summary statistics. Differential expression analyses used an empirical Bayes method (EdgeR) to estimate gene-level biological variation; exact test P values were corrected for multiple testing by FDR less than .05. All statistical tests were two-sided.
Results
Gene Expression Prediction Model Building
We performed TWAS by integrating pancreatic-specific and cross-tissue gene expression prediction models with results from a recent meta-analysis of pancreatic cancer GWAS data, performed within the PanScan and the PanC4, including 9040 PDAC cases and 12 496 controls (8,11). Two pancreatic transcriptome datasets from histologically normal pancreatic tissue samples were used: LTG (n = 95) (10) and GTEx v7 (n = 174) (27). Both the GWAS and gene expression datasets included only individuals of European ancestry. Two complementary TWAS approaches, FUSION (17) and MetaXcan (16,32), were used to build robust gene expression prediction models (see Supplementary Methods and Table 1, available online). We first assessed the power of the TWAS as compared with GWAS by simulating causal SNP-expression-trait models to identify genome-wide significant signals. We found that TWAS substantially increased statistical power as compared with GWAS, particularly when multiple causal SNPs underlie signals (Supplementary Figure 4, available online).
After comparing gene prediction models (prediction performance R2 ≥ 0.01) in the three datasets (LTG, GTEx, and combined LTG + GTEx), we found that each had distinct and valuable characteristics for TWAS analysis. First, whereas some gene expression prediction models were common to all three datasets (FUSION: n = 1687; MetaXcan: n = 1408), a larger number was unique to one of these (FUSION: n = 658 885, and 1421 models for LTG, GTEx, and LTG + GTEx, respectively; MetaXcan: n = 648 975, and 1705 models for LTG, GTEx, and LTG + GTEx, respectively) (Supplementary Figure 2, available online). Second, a greater number of gene prediction models were observed for the combined LTG + GTEx dataset (FUSION: n = 5902; MetaXcan: n = 5775) as compared with the individual datasets (2440–4992 models for LTG and GTEx using FUSION and MetaXcan) (Supplementary Figure 2, available online). Third, among gene prediction models common to the three datasets, the number of models with improved performance in the combined LTG + GTEx dataset (n = 826–1283) was greater than those with poorer performance (n = 342–738) as compared with the individual LTG or GTEx datasets (Supplementary Figure 5, available online). Fourth, although gene prediction model performance was highly correlated between pancreatic tissue datasets (Pearson r = 0.60–0.93) and TWAS approaches (Pearson r = 0.87–0.98) (Supplementary Figure 1, available online), a substantial number of gene prediction models had improved performance in FUSION (n = 5730) or MetaXcan (n = 4267) (Supplementary Figure 6, available online). Finally, although both the LTG and GTEx datasets were derived from histologically normal pancreatic tissue samples, the former was generated mostly from samples adjacent to tumors, whereas the latter was generated using nondiseased tissues from rapid autopsy programs. Based on these factors, we performed the analysis using each of the three transcriptome datasets and the two TWAS methods.
Because a large proportion of cis-regulated gene expression is shared across multiple tissues (38,39), we also took advantage of publicly available gene expression models generated from 48 different tissues (n = 2043–21 422 models per tissue, n = 74–421 samples per tissue type; http://predictdb.org/) from 608 individuals of European ancestry (GTEx v7) (27) to discover additional pancreatic cancer susceptibility genes using PrediXcan (16). The quantile-quantile plots showed little evidence for inflation of the test statistics as compared with the expected distribution (λ1000 = 1.004–1.025) (Supplementary Figure 3, available online).
Association Analyses Between Genetically Predicted Gene Expression and PDAC Risk
We evaluated associations between genetically predicted gene expression and pancreatic cancer risk by an integrated analysis using FUSION (17), MetaXcan (16,32), and SMulTiXcan (33) (Figure 1; Tables 1 and 2). First, using FUSION and the LTG pancreas gene expression models (n = 2827), we found that genetically predicted expression of ABO, CFDP1, PNMT, RCCD1, and PGAP3 was associated with PDAC risk (TWAS: P < 9.11 × 10⁻⁵, FDR < .05); in the GTEx (v7) pancreas gene expression models (n = 4992), we identified six additional PDAC risk-associated genes: KLF5, SUPT4H1, BTBD6, CDK12, SMUG1, and CELA3B (TWAS: P < 6.96 × 10⁻⁵, FDR < .05); in the combined LTG + GTEx pancreas dataset (n = 5902), we identified three additional genes: SMC2, WDR59, and HEXA (TWAS: P < 6.52 × 10⁻⁵, FDR < .05). Of these genes, CELA3B, SMC2, ABO, KLF5, WDR59, CFDP1, and PNMT were associated after Bonferroni correction (TWAS: P < 1.77 × 10⁻⁵ for LTG, P < 1.00 × 10⁻⁵ for GTEx, and P < 8.47 × 10⁻⁶ for LTG + GTEx).
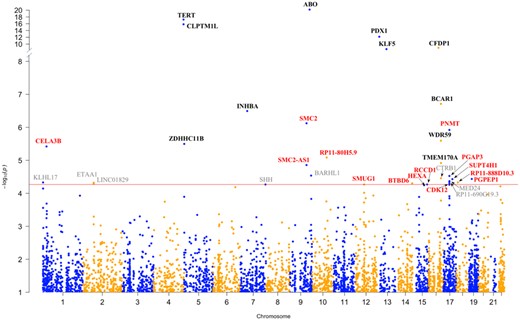
Manhattan plot of the results from the pancreatic cancer transcriptome-wide association study (TWAS). Each point corresponds to an association test between genetically predicted gene expression for a specific gene and pancreatic ductal adenocarcinoma risk. Genes listed in red are located at novel genomic loci, and those in black are known pancreatic cancer risk loci. Genes listed in gray did not pass the threshold for multiple testing (false discovery rate < 0.05) in the independent TWAS analyses. Genes with TWAS P ≤ 9.11 × 10⁻⁵ in at least one analysis are annotated.
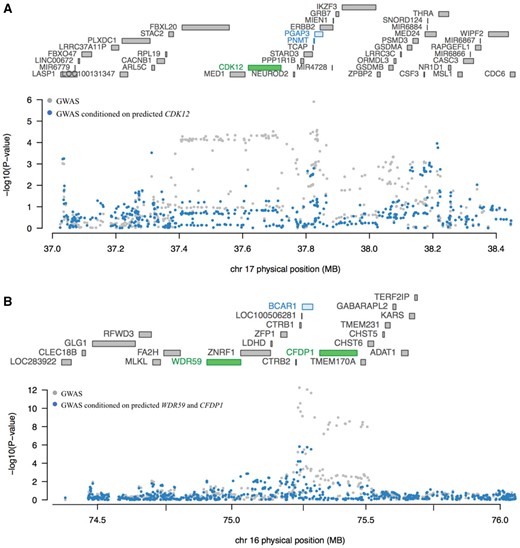
Conditional transcriptome-wide association study (TWAS) analysis for loci showing marginally statistically significant associations with multiple genes. A) Genes at chr17q12 are listed according to chromosomal location in the upper part of the plot with TWAS statistically significant genes shown in green (CDK12). The Manhattan plot for the genome-wide association studies (GWAS) results is shown in the lower part of the figure with pancreatic cancer GWAS P values before (gray) and after (blue) conditioning the analysis on imputed gene expression levels for CDK12. Genetically predicted expression of CDK12 appears to explain a large part of the GWAS-identified signal at chr17q12 in the Genotype-Tissue Expression (GTEx) dataset. B) Similarly, genes at chr16q23 are listed according to chromosomal location in the upper part of the plot with TWAS statistically significant genes shown in green (WDR59 and CFDP1). The Manhattan plot for GWAS results is shown in the lower part of the figure with pancreatic cancer GWAS P values before (gray) and after (blue) conditioning the analysis on imputed gene expression levels for WDR59 and CFDP1. Genetically predicted expression of WDR59 and CFDP1 appears to explain the majority of the GWAS-identified signal at chr16q23.1. Marginal and joint analyses were performed in the GTEx pancreas dataset for chr17q12 and in the combined Laboratory of Translational Genomics + GTEx pancreas dataset for chr16q23.1.
Second, using MetaXcan and the LTG pancreas gene expression models (n = 2440), we observed predicted ABO expression to be associated with PDAC risk (TWAS: P < 8.07 × 10⁻²⁷, FDR < .05); in the GTEx (v7) pancreas gene expression models (n = 4763), we identified six additional PDAC risk-associated genes: PDX1, INHBA, CELA3B, PGAP3, SUPT4H1, and RP11-888D10.3 (TWAS: P < 6.96 × 10⁻⁵, FDR < .05); in the gene expression models (n = 5775) trained by the combined pancreas dataset, we identified two additional genes: SMC2 and PGPEP1 (TWAS: P < 3.67 x 10⁻⁵, FDR < .05). Of these genes, CELA3B, INHBA, ABO, and PDX1 were associated after Bonferroni correction (TWAS: P < 2.05 × 10⁻⁵ for LTG, P < 1.05 × 10⁻⁵ for GTEx, and P < 8.65 × 10⁻⁶ for LTG + GTEx).
Finally, using SMulTiXcan (33) and gene expression models (n = 2043–21 422) trained in 48 different tissues (GTEx v7), we observed associations for predicted SMC2, INHBA, PDX1, and CFDP1 expression and identified seven additional genes associated with PDAC risk: TERT, CLPTM1L, BCAR1, ZDHHC11B, RP11-80H5.9, TMEM170A, and SMC2-AS1 (TWAS: P < 1.39 × 10⁻⁵, FDR < .05). Of these, TERT, CLPTM1L, PDX1, CFDP1, and BCAR1 were statistically significant after Bonferroni correction (TWAS: P < 2.33 × 10⁻⁶).
Overall, we discovered 25 genes (Figure 1) whose genetically predicted gene expression was associated with PDAC risk (FDR < .05), including 14 genes at 11 novel loci—1p36.12 (CELA3B), 9q31.1 (SMC2, SMC2-AS1), 10q23.31 (RP11-80H5.9), 12q13.13 (SMUG1), 14q32.33 (BTBD6), 15q23 (HEXA), 15q26.1 (RCCD1), 17q12 (PNMT, CDK12, PGAP3), 17q22 (SUPT4H1), 18.q11.22 (RP11-888D10.3), and 19p13.11 (PGPEP1) (Table 1)—and 11 genes at six known risk loci (8,11)—5p15.33 (TERT, CLPTM1L, ZDHHC11B), 7p14.1 (INHBA), 9q34.2 (ABO), 13q12.2 (PDX1), 13q22.1 (KLF5), and 16q23.1 (WDR59, CFDP1, BCAR1, TMEM170A) (Table 2). Three TWAS genes identified at novel loci (CELA3B, SMC2, PNMT) and nine at previously reported GWAS loci (TERT, CLPTM1L, INHBA, ABO, PDX1, KLF5, WDR59, CFDP1, BCAR1) were statistically significant after Bonferroni correction (Tables 1 and 2). Genes showing positive and negative effects in different tissues are listed in Table 1 and Supplemental Figure 7 (available online).
Statistically significant expression–trait associations for genes at loci not previously identified by pancreatic cancer GWAS
| Region | Gene name | Lead GWAS variant (±1 Mb)† | GWAS P† | Approach | Training tissue | R2,‡ | TWAS Z§ | TWAS P¶ | TWAS P after conditioning on lead GWAS variant# |
|---|---|---|---|---|---|---|---|---|---|
| 1p36.12 | CELA3B* | rs61132601 | 2.27 × 10⁻⁷ | FUSION | GTEx pancreas | 0.06 | −3.98 | 6.89 × 10⁻⁵ | .08 |
| FUSION | Combined pancreas | 0.04 | −4.62 | 3.80 × 10⁻⁶* | .03 | ||||
| MetaXcan | GTEx pancreas | 0.05 | −4.43 | 9.38 × 10⁻⁶* | .21 | ||||
| MetaXcan | Combined pancreas | 0.05 | −4.29 | 1.83 × 10⁻⁵ | .03 | ||||
| 9q31.1 | SMC2* | rs147699343 | 8.77 × 10⁻⁸ | FUSION | Combined pancreas | 0.04 | 4.95 | 7.52 × 10⁻⁷* | .08 |
| MetaXcan | Combined pancreas | 0.02 | 4.93 | 8.19 × 10⁻⁷* | .06 | ||||
| SMulTiXcan | Cross-tissue | 0.02–0.61 | −3.34 to 5.35 | 8.50 × 10⁻⁶ | .66 | ||||
| 9q31.1 | SMC2-AS1 | rs147699343 | 8.70 × 10⁻⁸ | SMulTiXcan | Cross-tissue | 0.04-0.18 | −4.9 to 4.8 | 1.39 × 10⁻⁵ | .61 |
| 10q23.31 | RP11-80H5.9 | rs7083351 | 5.22 × 10⁻⁵ | SMulTiXcan | Cross-tissue | 0.02–0.20 | −2.21 to 4.4 | 8.23 × 10⁻⁶ | .04 |
| 12q13.13 | SMUG1 | rs4759336 | 1.39 × 10⁻⁴ | FUSION | GTEx pancreas | 0.28 | −4.04 | 5.40 × 10⁻⁵ | .06 |
| 14q32.33 | BTBD6 | rs10638535 | 2.73 × 10⁻⁵ | FUSION | GTEx pancreas, | 0.07 | 4.06 | 4.98 × 10⁻⁵ | .94 |
| FUSION | Combined pancreas | 0.05 | 4.00 | 6.30 × 10⁻⁵ | .73 | ||||
| 15q23 | HEXA | rs11636684 | 2.35 × 10⁻⁵ | FUSION | Combined pancreas | 0.02 | −4.02 | 5.68 × 10⁻⁵ | 5.31 × 10⁻³ |
| 15q26.1 | RCCD1 | rs8028409 | 3.77 × 10⁻⁵ | FUSION | LTG pancreas | 0.44 | −3.98 | 6.94 × 10⁻⁵ | .87 |
| FUSION | GTEx pancreas | 0.28 | −4.04 | 5.38 × 10⁻⁵ | .86 | ||||
| FUSION | Combined pancreas | 0.37 | −3.99 | 6.52 × 10⁻⁵ | .95 | ||||
| 17q12 | PNMT* | rs12951693 | 6.17 × 10⁻⁷ | FUSION | LTG pancreas | 0.02 | 4.86 | 1.20 × 10⁻⁶* | 4.01 × 10⁻⁵ |
| 17q12 | CDK12 | rs12951693 | 6.17 × 10⁻⁷ | FUSION | GTEx pancreas | 0.02 | −4.05 | 5.15 × 10⁻⁵ | 1.37 × 10⁻³ |
| 17q12 | PGAP3 | rs12951693 | 6.17 × 10⁻⁷ | FUSION | LTG pancreas | 0.10 | 3.91 | 9.11 × 10⁻⁵ | 1.44 × 10⁻³ |
| FUSION | GTEx pancreas | 0.25 | 3.98 | 6.96 × 10⁻⁵ | 2.16 × 10⁻⁴ | ||||
| MetaXcan | GTEx pancreas | 0.24 | 4.11 | 3.03 × 10⁻⁵ | 1.03 × 10⁻⁴ | ||||
| MetaXcan | Combined pancreas | 0.18 | 4.17 | 2.98 × 10⁻⁵ | 1.04 × 10⁻⁴ | ||||
| 17q22 | SUPT4H1 | rs6503868 | 2.15 × 10⁻⁵ | FUSION | GTEx pancreas | 0.08 | 4.12 | 3.72 × 10⁻⁵ | 3.32 × 10⁻³ |
| MetaXcan | GTEx pancreas | 0.07 | 4.11 | 3.90 × 10⁻⁵ | 6.50 × 10⁻³ | ||||
| 18.q11.22 | RP11-888D10.3 | rs28637808 | 1.30 × 10⁻⁵ | MetaXcan | GTEx pancreas | 0.09 | −4.07 | 4.67 × 10⁻⁵ | .07 |
| 19p13.11 | PGPEP1 | rs12985909 | 3.48 × 10⁻⁵ | MetaXcan | Combined pancreas | 0.06 | −4.13 | 3.67 × 10⁻⁵ | .85 |
Genes and corresponding TWAS P that are statistically significant after Bonferroni correction for multiple testing in each of the analyses. GTEx = Genotype-Tissue Expression; GWAS = genome-wide association studies; LTG = Laboratory of Translational Genomics; SMulTiXcan = Summary-MulTiXcan; TWAS = transcriptome-wide association study.
The lead GWAS variant and GWAS P value indicates the most statistically significant GWAS variant within ± 1 Mb for each gene listed.
R2: model prediction performance.
TWAS Z: effect size and direction. Effect sizes for SMulTiXcan results in individual tissues are shown in Supplementary Figure 7 (available online).
TWAS P: P value from the TWAS for genes that passed the false discovery rate corrected P value ≤ 0.05 in each of the analyses.
TWAS P values after conditioning on the lead GWAS variant within ± 1 Mb for each gene is shown in the last column.
Statistically significant expression–trait associations for genes at known pancreatic cancer risk loci previously identified by GWAS
| Region | Gene name | Lead GWAS Variant (± 1 Mb)† | GWAS P† | Approach | Training tissue | R2,‡ | TWAS Z§ | TWAS P¶ | TWAS P after conditioning on lead GWAS variant# |
|---|---|---|---|---|---|---|---|---|---|
| 5p15.33 | TERT* | rs31490 | 1.28 × 10⁻¹⁷ | SMulTiXcan | Cross-tissue | 0.05–0.11 | −8.24 to 4.20 | 5.80 × 10⁻¹⁸* | 3.37 × 10⁻⁴ |
| 5p15.33 | CLPTM1L* | rs31490 | 1.28 × 10⁻¹⁷ | SMulTiXcan | Cross-tissue | 0.02–0.06 | −8.33 to 0.91 | 1.48 × 10⁻¹⁶* | 6.10 × 10⁻⁴ |
| 5p15.33 | ZDHHC11B | rs31490 | 1.28 × 10⁻¹⁷ | SMulTiXcan | Cross-tissue | 0.02–0.19 | −1.16 to 3.13 | 3.18 × 10⁻⁶ | 1.56 × 10⁻⁵ |
| 7p14.1 | INHBA* | rs12701838 | 3.59 × 10−09 | MetaXcan | GTEx pancreas | 0.04 | −5.11 | 3.20 × 10⁻⁷* | .81 |
| SMulTiXcan | Cross-tissue | 0.04–0.34 | −5.11 to −0.72 | 4.10 × 10⁻⁶ | .02 | ||||
| 9q34.2 | ABO* | rs687621 | 2.37 × 10⁻²⁷ | FUSION | LTG pancreas | 0.37 | 9.38 | 6.71 × 10⁻²¹* | .49 |
| FUSION | GTEx pancreas | 0.56 | 6.96 | 3.44 × 10⁻¹²* | .21 | ||||
| FUSION | Combined pancreas | 0.50 | 7.55 | 4.34 × 10⁻¹⁴* | .23 | ||||
| MetaXcan | LTG pancreas | 0.30 | 10.72 | 8.07 × 10⁻²⁷* | .98 | ||||
| MetaXcan | GTEx pancreas | 0.55 | 7.08 | 1.41 × 10⁻¹²* | .08 | ||||
| MetaXcan | Combined pancreas | 0.49 | 7.65 | 2.05 × 10⁻¹⁴* | .07 | ||||
| 13q12.2 | PDX1* | rs2297316 | 4.43 × 10⁻¹³ | MetaXcan | GTEx pancreas | 0.05 | −7.18 | 6.85 × 10⁻¹³* | .64 |
| SMulTiXcan | Cross-tissues | 0.03–0.05 | −7.18 to −6.59 | 4.87 × 10⁻¹²* | .45 | ||||
| 13q22.1 | KLF5* | rs9573166 | 1.51 × 10⁻²⁵ | FUSION | GTEx pancreas | 0.05 | 4.91 | 9.17 × 10⁻⁷* | 4.91 × 10⁻⁴ |
| FUSION | Combined pancreas | 0.03 | 5.92 | 3.15 × 10⁻⁹* | .02 | ||||
| 16q23.1 | WDR59* | rs72802357 | 1.32 × 10⁻¹⁶ | FUSION | Combined pancreas | 0.01 | −4.70 | 2.54 × 10⁻⁶* | 3.42 × 10⁻³ |
| 16q23.1 | CFDP1* | rs72802357 | 1.32 × 10⁻¹⁶ | FUSION | LTG pancreas | 0.03 | 6.07 | 1.26 × 10⁻⁹* | .06 |
| FUSION | Combined pancreas | 0.12 | 5.76 | 8.47 × 10⁻⁹* | .03 | ||||
| MetaXcan | Combined pancreas | 0.17 | 5.58 | 2.40 × 10⁻⁸* | .05 | ||||
| SMulTiXcan | Cross-tissue | 0.03–0.20 | 2.50 to 6.89 | 2.02 × 10⁻⁸* | .12 | ||||
| 16q23.1 | BCAR1* | rs72802357 | 1.32 × 10⁻¹⁶ | SMulTiXcan | Cross-tissue | 0.02–0.21 | −5.60 to 6.49 | 1.94 × 10⁻⁷* | .22 |
| 16q23.1 | TMEM170A | rs72802357 | 1.32 × 10⁻¹⁶ | SMulTiXcan | Cross-tissue | 0.02–0.22 | −3.69 to 2.86 | 1.21 × 10⁻⁵ | .41 |
Genes and corresponding TWAS P values that are statistically significant after Bonferroni correction for multiple testing in each of the analyses. GTEx = Genotype-Tissue Expression; GWAS = genome-wide association studies; LTG = Laboratory of Translational Genomics; SMulTiXcan = Summary-MulTiXcan; TWAS = transcriptome-wide association study.
The lead GWAS variant and GWAS P value indicates the most statistically significant GWAS variant within ±1 Mb for each gene listed.
R2: model prediction performance.
TWAS Z: effect size and direction. Effect sizes for SMulTiXcan results in individual tissues are shown in Supplementary Figure 7 (available online).
TWAS P: P value from the TWAS for genes that passed the false discovery rate corrected P value ≤ .05 in each of the analyses.
TWAS P values after conditioning on the lead GWAS variant within ± 1 Mb for each gene is shown in the last column.
We performed conditional tests at two loci containing more than one TWAS gene using pancreatic tissue models to determine if they represented conditionally independent signals. At chr17q12, three adjacent genes (Table 1;Figure 2A) were identified by TWAS: PNMT, CDK12, and PGAP3. The TWAS signal for PNMT and PGAP3 dropped substantially after conditioning the analysis on predicted CDK12 expression in the GTEx pancreas dataset (PNMT TWAS P value changed from 5.10 × 10⁻⁴ to .53 and PGAP3 TWAS P value from 6.96 × 10⁻⁵ to .09). The GWAS signal at this locus also dropped markedly after conditioning on predicted expression of CDK12 (Figure 2A) indicating that CDK12 may explain a large part of the signal at this locus. The gene expression correlation for the three genes was low (CDK12 and PNMT, Pearson r = 0.09 in both LTG and GTEx) to moderate (PNMT and PGAP3, Pearson r = 0.33 and r = 0.27; CDK12 and PGAP3, Pearson r = 0.66 and r = 0.29 in the LTG and GTEx pancreas datasets, respectively) (Supplementary Table 2, available online). In contrast, the association with PDAC risk for two adjacent genes at chr16q23.1 (Table 2;Figure 2B), WDR59 and CFDP1, appeared largely independent (TWAS P value changed from 2.54 × 10⁻⁶ to 5.60 × 10⁻⁴ for WDR59 and from 8.47 × 10⁻⁹ to 1.70 × 10⁻⁶ for CFDP1 in a joint analysis in the combined LTG + GTEx pancreatic dataset). The GWAS signal at this locus dropped dramatically after conditioning on predicted expression of WDR59 and CFDP1, indicating that genetically predicted expression of WDR59 and CFDP1 together explain most of the signal at this locus (Figure 2B). The expression of these two genes was moderately to strongly correlated in the two datasets (Pearson r = 0.52–0.80) (Supplementary Table 2, available online).
To determine whether the associations between predicted gene expression and PDAC risk were independent of the lead GWAS-identified variants at each locus, we performed conditional analyses adjusting for the most statistically significant risk variants within ±1 Mb of TWAS-identified genes in the PanScan and PanC4 GWAS datasets. Among the 25 TWAS-identified genes, the association for three genes at novel loci (PNMT, CDK12, and PGAP3) and four genes at known loci (TERT, CLPTM1L, ZDHHC11B, and KLF5) remained statistically significant at the Bonferroni corrected P value threshold (P < .05/25 genes, ie, P < .002, Tables 1 and 2), indicating that these genes may be associated with PDAC risk independently of the GWAS-identified lead risk variants. Interestingly, at chr5p15.33, substantial loss of the TWAS signals for both TERT and CLPTM1L was seen after conditioning on three of the four GWAS-identified variants that mark independent pancreatic cancer risk signals at this locus (Table 3; Supplementary Table 3, available online) indicating that the underlying biology at this locus may involve both genes.
TWAS results on chr5p15.33 before and after conditional analyses for SNPs that mark independent GWAS risk signals on chr5p15.33
| Gene name | TWAS P* | ||||
|---|---|---|---|---|---|
| GWAS conditioned on: | |||||
| rs31490 | rs2736098 | rs36115365 | rs35226131 | ||
| TERT | 5.80 × 10⁻¹⁸ | 3.37 × 10⁻⁴ | 7.48 × 10⁻⁹ | 9.86 × 10⁻⁶ | 3.88 × 10⁻¹⁶ |
| CLPTM1L | 1.48 × 10⁻¹⁶ | 6.10 × 10⁻⁴ | 4.83 × 10⁻⁸ | 4.85 × 10⁻⁵ | 4.04 × 10⁻¹⁴ |
| ZDHHC11B | 3.18 × 10⁻⁶ | 1.56 × 10⁻⁵ | 8.41 × 10⁻³ | 3.00 × 10⁻² | 6.50 × 10⁻³ |
Transcriptome-wide association study (TWAS) P values are shown prior to and after conditioning the Pancreatic Cancer Cohort Consortium–Pancreatic Cancer Case-Control Consortium genome-wide association studies analysis on four independent pancreatic cancer risk signals at chr5p15.33 per Wang et al. (50), Petersen et al. (7), Wolpin et al. (8), Zhang et al. (10), and Fang et al. (12).
Transcriptome Changes Associated With High and Low Expression of Genes Identified by TWAS
To begin unravelling the potential consequences associated with different expression levels of TWAS-identified genes, we assessed transcriptome differences in samples in the top vs bottom quartiles of expression for each gene in the GTEx and LTG pancreatic datasets (see Supplementary Methods and Tables 4 and 5, available online) as previously described (40). As this analysis may be most relevant for well-expressed genes that are highly differentially expressed between samples in the top vs bottom quartile of expression, we focused on CELA3B, which was highly expressed and with a large difference in median expression (GTEx = 76%; LTG = 91%) in samples in the top and bottom quartiles (Supplementary Table 6 and Figure 8, available online). Pathway enrichment analyses for genes differentially expressed in samples at the top vs bottom quartile of CELA3B gene expression showed a negative correlation between expression of CELA3B and inflammatory and immune response genes (Table 4) indicating that low CELA3B expression may be associated with an inflammatory state in the pancreas.
Pathway enrichment analysis for genes expressed at higher levels in samples with low vs high CELA3B expression in the GTEx and LTG transcriptome datasets
| Pathways enrichment for genes inversely associated with CELA3B expression | ||||||
|---|---|---|---|---|---|---|
| GTEx | LTG | |||||
| Category | Term | DE genes, No.* | Fold enrichment† | P‡ | Fold enrichment† | P‡ |
| GO biological process | Inflammatory response | 72 | 6.3 | 3.8 × 10⁻³³ | 3.2 | 6.0 × 10−55 |
| GO biological process | Immune response | 70 | 5.6 | 1.2 × 10⁻²⁸ | 3 | 2.7 × 10−50 |
| KEGG | Staphylococcus aureus infection | 24 | 11.5 | 7.9 × 10⁻¹⁷ | 4.5 | 3.5 × 10⁻²¹ |
| GO biological process | Cell adhesion | 57 | 4.1 | 1.4 × 10⁻¹⁶ | 2.7 | 1.2 × 10−40 |
| GO biological process | Innate immune response | 52 | 4 | 1.6 × 10⁻¹⁴ | 2.4 | 8.6 × 10⁻²⁵ |
Genes expressed at twofold or higher levels in samples in the bottom vs top quartile of CELA3B (chymotrypsin-like elastase 3B) mRNA expression in the GTEx pancreas and LTG histologically normal pancreatic transcriptome datasets were included in a pathway enrichment analysis using DAVID. GTEx = Genotype-Tissue Expression; LTG = Laboratory of Translational Genomics; DE = Differentially expressed genes; GO = Gene Ontology; KEGG = Kyoto Encyclopedia of Genes and Genomes.
Fold enrichment for these genes in the pathways listed are shown as well as ‡Benjamini-Hochberg false discovery rate corrected P values.
Discussion
To identify novel susceptibility loci and putative causally relevant genes for pancreatic cancer development, we integrated eQTL datasets derived from pancreatic, as well as other tissues, with the largest currently available pancreatic cancer GWAS dataset (11) and identified 25 genes whose genetically predicted expression associated with pancreatic cancer risk. These genes localize to 17 genomic regions, of which 11 do not overlap with known PDAC risk loci.
Several TWAS genes identified at novel loci function in DNA repair, chromosome organization, and cell division. SMC2 (9q31.1) encodes structural maintenance of chromosomes protein 2, a core component of the condensin complex, which regulates chromosome organization during mitosis and meiosis and plays a critical role in single-strand break DNA repair (41–43). SMUG1 (12q13.13) encodes a base excision repair enzyme (single-strand-selective monofunctional uracil-DNA glycosylase 1) that repairs several DNA-pyrimidine oxidation products, some of which are mutagenic (44). RCCD1 (15q26.1) encodes RCC1 domain-containing protein 1, a partner of histone H3K36 demethylase KDM8; this complex is important for spindle organization, chromosome segregation, and accurate mitotic division (45). CDK12 (cyclin-dependent kinase 12, 17q12) belongs to the cyclin-dependent kinase (CDK) family of serine and threonine protein kinases that regulate transcriptional and posttranscriptional processes, including DNA damage response, splicing, pre-mRNA processing, development, and differentiation (46,47). CDK12 is mutated in some tumors and overexpressed in others, indicating that it may have context-dependent oncogenic and tumor suppressor functions (46). Decreased genetically predicted expression of SMUG1, RCCD1, and CDK12 was associated with increased risk of pancreatic cancer, in agreement with their roles in maintaining genome stability. Conversely, increased SMC2 expression was associated with pancreatic cancer risk, which is less consistent with its role in cell division and DNA repair but aligns with reports showing that its expression is regulated by the transcription factors β-catenin-TCF4 and that it is important for WNT-mediated cell proliferation in intestinal cells (48).
At chr1p36, another locus not previously reported in GWAS, genetically predicted CELA3B expression was inversely associated with risk of pancreatic cancer. This gene encodes chymotrypsin-like elastase family member 3B and, along with other pancreatic serine proteases, has a digestive function (49). Pathway enrichment analysis indicated that low expression of CELA3B may be associated with an inflammatory state in the pancreas, which is interesting in the light that inflammatory conditions, including pancreatitis, increase risk of pancreatic cancer (3).
Chr5p15.33 is a well-known multicancer risk locus with multiple independent signals reported in the TERT-CLPTM1L gene region for more than 10 different cancers, including pancreatic cancer (5,10,12,50–53). TERT encodes the catalytic subunit of the telomerase reverse transcriptase complex, whose major function is to maintain the ends of our chromosomes and overall chromosomal integrity (54–58). The CLPTM1L gene, relatively unknown until a few years ago, is now known to encode a multipass transmembrane protein that promotes growth and is frequently overexpressed in pancreatic and lung cancers (59–61). It is important for endoplasmic reticulum stress, apoptosis and cytokinesis, and KRAS-driven lung cancer (61). Using cross-tissue prediction models, we identified both TERT and CLPTM1L as pancreatic cancer TWAS genes with positive and negative effects, depending on the tissues. This type of pleiotropy for chr5p15.33 has been previously described by us and others (5,10,12,50–53).
Some of the genes identified in our study have been reported in TWAS for breast (RCCD1, KLF5), ovarian cancer (RCCD1), and type 2 diabetes (RCCD1) (20,22,62,63). KLF5 is located at chr13q22.1, a pancreatic cancer risk locus in a large, nongenic region flanked by KLF5 and KLF12 (13). It encodes Kruppel Like Factor 5, a zinc finger transcription factor frequently overexpressed in pancreatic cancer, and is important for Kras mediated pancreatic tumorigenesis in mouse models (64). Because we have previously shown that DIS3, a gene that encodes a catalytic subunit of the nuclear RNA exosome complex that mediates RNA processing and decay, represents a functional gene at chr13q22.1 (13), our current findings indicate that KLF5 may also play a role at this risk locus. None of the suggestive genes (unadjusted P < .05) reported in a recent but much smaller TWAS for pancreatic cancer (65) overlap with the genes reported in our study. Three loci overlap with our recent pathway-based analysis of pancreatic cancer GWAS data (chr9q31.1: SMC2; chr15q23: HEXA; and chr17q12: PNMT, CDK12, and PGAP3) and are suggestive in the GWAS analysis (66).
Although TWAS represents an attractive method to map risk loci that influence gene expression, this approach has advantages and disadvantages. Benefits include the reduced multiple testing burden and nomination of plausible candidate risk genes. However, identification of trait-associated gene expression differences by TWAS does not imply causality, and functional studies are needed to comprehensively determine underlying mechanisms of risk. Furthermore, coregulated genes can present as multiple associated genes at the same locus, even though only one gene underlies the signal. Finally, only cis-eQTLs are assessed, and genes whose genetically regulated gene expression cannot be predicted using SNPs are not evaluated. In the future, larger transcriptome and GWAS datasets for pancreatic cancer are likely to further improve statistical power for gene identification using this approach. Likewise, transcriptome datasets from specific cellular subtypes within the pancreas, such as acinar and ductal cells, could also improve future pancreatic cancer TWAS approaches.
In summary, we report 25 genes whose genetically predicted expression was associated with pancreatic cancer risk (FDR < .05), including 14 genes at 11 novel genomic loci. Twelve of these genes remained statistically significant after Bonferroni correction. Our findings provide new insights into the genetic basis of pancreatic cancer risk and identify target genes for future functional studies to thoroughly explore the mechanistic underpinnings of risk at each locus.
Funding
This work was supported by the Intramural Research Program (IRP) of the Division of Cancer Epidemiology and Genetics, National Cancer Institute, US National Institutes of Health (NIH).
Notes
The funders had no role in the design of the study; the collection, analysis, and interpretation of the data; the writing of the manuscript; and the decision to submit the manuscript for publication. The authors have no conflicts of interest to disclose. Acknowledgements, data access, and additional funding information are listed in the Supplementary Material (available online).
The content of this publication does not necessarily reflect the views or policies of the US Department of Health and Human Services, nor does mention of trade names, commercial products, or organizations imply endorsement by the US government.
References

