


Abstract
Childhood cancer survivors are at increased risk of therapy-related premature menopause (PM), with a cumulative incidence of 8.0%, but the contribution of genetic factors is unknown.
Genome-wide association analyses were conducted to identify single nucleotide polymorphisms (SNPs) associated with clinically diagnosed PM (menopause < 40 years) among 799 female survivors of childhood cancer participating in the St. Jude Lifetime Cohort Study (SJLIFE). Analyses were adjusted for cyclophosphamide equivalent dose of alkylating agents and ovarian radiotherapy (RT) dose (all P values two-sided). Replication was performed using self-reported PM in 1624 survivors participating in the Childhood Cancer Survivor Study (CCSS).
PM was clinically diagnosed in 30 (3.8%) SJLIFE participants. Thirteen SNPs (70 kb region of chromosome 4q32.1) upstream of the Neuropeptide Receptor 2 gene (NPY2R) were associated with PM prevalence (minimum P = 3.3 × 10⁻⁷ for rs9999820, all P < 10-5). Being a homozygous carrier of a haplotype formed by four of the 13 SNPs (seen in one in seven in the general population but more than 50% of SJLIFE clinically diagnosed PM) was associated with markedly elevated PM prevalence among survivors exposed to ovarian RT (odds ratio [OR] = 25.89, 95% confidence interval [CI] = 6.18 to 138.31, P = 8.2 × 10⁻⁶); this finding was replicated in an independent second cohort of CCSS in spite of its use of self-reported PM (OR = 3.97, 95% CI = 1.67 to 9.41, P = .002). Evidence from bioinformatics data suggests that the haplotype alters the regulation of NPY2R transcription, possibly affecting PM risk through neuroendocrine pathways.
The haplotype captures the majority of clinically diagnosed PM cases and, with further validation, may have clinical application in identifying the highest-risk survivors for PM for possible intervention by cryopreservation.
While remarkable advances in the treatment of childhood cancers have greatly increased five-year survival rates (1,2), the burden of chronic disease reported in adults who had been treated for childhood cancer is substantial (3,4), creating a need to identify high-risk survivors for specific treatment-related morbidity, facilitating their access to interventions to preserve function and optimize quality of life (5). A serious late-effects condition that affects female survivors is premature menopause (PM), defined as menopause before the age of 40 years, due to the extreme sensitivity of ovarian tissue to cancer therapies (6,7). Among female participants in the Childhood Cancer Survivor Study (CCSS), the estimated cumulative incidence of PM was approximately 8.0% among survivors, compared with 0.8% among siblings (6). Identifying female survivors with the highest PM risk is a priority, as they may be able to benefit from fertility preservation interventions prior to PM onset (8).
Though treatment exposure is highly associated with PM risk, interindividual variability in PM susceptibility and/or sensitivity to gonadotoxic treatments make accurate prediction of PM difficult. We therefore investigated the contributions of genetic factors to PM risk following childhood cancer treatment to identify subgroups who may benefit most from the fertility-preserving interventions.
Methods
Study Participants
Participants were enrolled in the St. Jude Lifetime Cohort Study (SJLIFE) through an institutional review board–approved protocol with informed consent (Supplementary Methods, available online) (9). Blood samples were collected from all female SJLIFE participants to evaluate levels of luteinizing hormone (LH), follicle-stimulating hormone (FSH), and estradiol using electro-chemiluminescent immunometric assays (Roche Cobas 6000 analyzer, Roche Diagnostics, 9115 Hague Road, POBox 50457, Indianapolis, IN). A clinical endocrinologist diagnosed PM prior to genetic analyses based on the patients’ medical history (puberty, menarche, menstrual cycles, pregnancies, childbirth, hormonal therapies including contraception, and timing of last menstrual period), supplemented by clinical and laboratory data from SJLIFE campus visits: this clinical diagnosis of PM was used in the statistical analysis of having had PM by the age of clinical assessment below (10). Specifically, PM diagnosis was assigned to women with amenorrhea for a period of six months, younger than age 40 years, and not on hormonal therapies, in association with estradiol lower than 17 pg/mL and FSH higher than 30 IU/L. For women on hormone therapy, endocrinologists used clinical history, medical records, and hormone levels to diagnose PM. Women taking oral contraceptives to prevent pregnancy, regulate cycles, or treat polycystic ovarian syndrome were assumed not to have PM.
Genotyping
Genomic DNA was extracted from blood samples of SJLIFE participants using Qiagen DNeasy Blood and Tissue Kit and genotyped using Affymetrix HumanSNP6.0 array (Affymetrix Incorporated, Santa Clara, CA). Quality control (QC) of SJLIFE genotype data was performed using PLINK, version 1.90 (Supplementary Methods and Supplementary Figure 2, available online) (11).
Statistical Analysis
A nongenetic baseline model (“clinical model”) was built including age at the last St. Jude campus visit (truncated to 40 years), cumulative dose of alkylating agents with cyclophosphamide equivalent dose (CED) (12) of 8 g/m2 (yes/no) or higher, ovarian radiotherapy (RT) exposure (yes/no), and mean ovarian RT dose (Gy) (10). We then performed single–single nucleotide polymorphism (SNP) genome-wide association analyses, adjusting for the clinical model, to screen for genetic markers associated with having had PM by the campus visit age (additive effects) using logistic regression. The statistical significance of the association was assessed using the likelihood ratio test (LRT; two-sided). As a supplementary analysis, spatially clustered SNPs with suggestive statistical significance (P < 10-5) were tested for independent signals using forward selection analysis, sequentially conditioning on SNPs added to the clinical model with a nominal statistical significance cutoff P value of less than .05 (Supplementary Methods, available online). All models were adjusted for ancestry (continuous variables), estimated with STRUCTURE software, and checked for outliers (Supplementary Methods, available online) (13).
In addition, as a supplementary analysis, we also imputed genotypes of SNPs not represented on the Affymetrix array using the 1000 Genomes phase 3 version 5 reference panel, mixed population (14), on the University of Michigan Imputation Server (15), and assessed their PM associations using the same model above (Supplementary Methods, available online).
As a follow-up analysis of the single-SNP analysis, we investigated whether a combination of multiple SNPs was associated with a greater prevalence of treatment-associated PM than individual SNPs (Supplementary Methods, available online), for which the copies of a given haplotype were obtained from phased genotype data using PHASE software (16). Specifically, this analysis grouped survivors into three strata based on treatment exposure (10) and evaluated the multiple-SNP effects in each stratum (Stratum 1: CED < 8 g/m2 with no ovarian RT; Stratum 2: CED ≥ 8 g/m2 with no ovarian RT; Stratum 3: ovarian RT) (Supplementary Methods, available online). In SJLIFE, this treatment group–specific association was evaluated with 2.0×10⁶ random permutations of categories of the genetic factors of interest as the standard large-sample inference may not be tenable with its small number of PM cases (17). To assess the clinical relevance of genetic findings, we calculated sensitivity, specificity, and area under the receiver operating characteristic (ROC) curves for PM prediction of clinically diagnosed PM in SJLIFE data. To assess clinical implication, we predicted PM occurrence by age 35 years using the clinical model with and without the haplotype to compare the number of survivors meeting Edinburgh Criteria (18) for oocyte cryopreservation consideration.
All statistical tests were two-sided, and a P value of less than .05 was considered statistically significant unless specified otherwise.
Replication
Genetic findings from SJLIFE were assessed for replication using data from CCSS (19) using the identical statistical model from the SJLIFE discovery analysis. PM status in the CCSS cohort was ascertained using surveys and based on self-reported cessation of menses before age 40 years (6,20). CCSS survivors with a high risk of gonadotropin insufficiency (cranial irradiation > 30 Gy or with hypothalamic or pituitary tumors) or a history of bilateral oophorectomy were not included in the replication analysis. As CCSS dosimetry included stray (scatter/leakage) radiation estimation, an ovarian RT indicator variable was defined as greater than 0.5 Gy exposure to capture only individuals with radiation fields that targeted the ovaries. Genotyping in CCSS was performed using the Illumina HumanOmni5Exome microarray (Illumina Incorporated, CA) (21). SNPs on the Affymetrix platform not genotyped on the Illumina platform were replaced by their proxy SNPs in high linkage disequilibrium (LD) with the original SNPs (r2 ≥ 0.95, 1000 Genomes phase 3 version 5 reference panel European population) (14).
Bioinformatics
Bioinformatics analyses with publicly available data resources were conducted to characterize SNPs associated with PM risk. We investigated expression quantitative trait loci (eQTL) for SNPs of interest using Genotype-Tissue Expression (GTEx; version 7) (26). For each SNP of interest, HaploReg (version 4) (22) was used to identify SNPs within a 250 kb window in high LD (r2 ≥ 0.8) using the 1000 Genomes phase 3 version 5 reference panel, European population (14). The SNPs meeting these criteria represent an “expanded” genetic signal (expanded GS) and are the basis for bioinformatics analyses.
Chromatin state enrichment analyses were performed using the Roadmap Epigenomics Mapping Consortium annotation data (15 chromatin state-model predicted by ChromHMM) to assess whether SNPs in the expanded GS had statistically significant enrichment for gene-regulation states (enhancer, promoter, or Polycomb-repressed) (23). The expanded-GS SNPs were compared with a reference set of SNPs consisting of all the other SNPs from the original single-SNP analysis with PM association P values of less than .05 (“comparison SNP set”). For different cell types, we compared the expanded GS and the comparison SNP set with respect to the relative frequency of each of the three gene regulation states using the Fisher exact test. The WashU EpiGenome Browser (http://epigenomegateway.wustl.edu/) was used to visualize the expanded GS (Supplementary Methods, available online).
Software
PLINK 1.90 (11) and R 3.1.1 (24) were used for the genotype QC, the association testing, and bioinformatics analyses. We phased the genotype data, stratifying by ancestry, using PHASE 2.1.1 to form haplotypes and study additive vs recessive effects of haplotypes (16). LD patterns were visualized using Haploview (25).
Results
Discovery Analysis With SJLIFE
Among 1644 female survivors eligible for SJLIFE, 988 (60.1%) had a campus visit. With phenotype-specific exclusion criteria listed in the consort diagram (Supplementary Figures 1 and 2, available online), 799 remained in the analysis. PM was clinically identified in 30 (prevalence of 3.8%) participants (Table 1). Compared with non-PM survivors, PM survivors were older (mean [SD] = 37.7 [3.2] years vs mean [SD] = 31.5 [6.1] years, t test P < .001) and received higher doses of ovarian radiation (mean [SD] = 7.9 [8.9] Gy vs mean [SD] = 0.7 [3.2] Gy, t test P < .001) and cumulative CED (mean [SD] = 12.0 [8.4] g/m2 vs mean [SD] = 5.2 [6.7] g/m2, t test P < .001; data not shown).
Demographic and treatment characteristics of discovery and replication cohorts*
| Characteristics | SJLIFE (clinically diagnosed PM) | CCSS (self-reported PM) | ||
|---|---|---|---|---|
| Cases (%) | Controls (%) | Cases (%) | Controls (%) | |
| Premature menopause | 30 (3.8) | 769 (96.2) | 81 (5.0) | 1543 (95.0) |
| Self-reported race/ethnicity | ||||
| Black | 4 (13.3) | 111 (14.4) | 2 (2.5) | 26 (1.7) |
| White | 26 (86.7) | 655 (81.2) | 72 (88.9) | 1373 (90.0) |
| Other | 0 (0.0) | 3 (0.3) | 7 (8.6) | 144 (9.3) |
| Genetic ancestry | ||||
| STRUCTURE European ancestry > 0.5 | 27 (90.0) | 658 (85.6) | 79 (97.5) | 1517 (98.3) |
| STRUCTURE African ancestry > 0.5 | 3 (10.0) | 111 (14.4) | 2 (2.5) | 26 (1.7) |
| Diagnosis | ||||
| Leukemia | 9 (30.0) | 297 (38.6) | 24 (29.6) | 574 (37.2) |
| Lymphoma | 8 (26.7) | 109 (14.2) | 40 (49.4) | 283 (18.3) |
| CNS tumor | 1 (3.3) | 65 (8.5) | 1 (1.2) | 101 (6.5) |
| Embryonal tumors | 2 (6.7) | 137 (17.8) | 10 (12.3) | 346 (22.6) |
| Bone and soft tissue sarcoma | 4 (13.3) | 84 (10.9) | 6 (1.7) | 263 (17.0) |
| Carcinomas | 6 (20.0) | 65 (8.5) | 0 (0.0) | 0 (0.0) |
| Other | 0 (0.0) | 11 (1.4) | 0 (0.0) | 8 (0.5) |
| Year of primary diagnosis | ||||
| <1970 | 14 (46.7) | 125 (16.3) | 0 (0.0) | 0 (0.0) |
| 1970 to 1979 | 14 (46.7) | 306 (39.8) | 51 (63.0) | 677 (43.9) |
| 1980 to 1989 | 2 (6.7) | 324 (42.1) | 30 (37.0) | 866 (56.1) |
| ≥1990 | 0 (0.0) | 14 (1.8) | 0 (0.0) | 0 (0.0) |
| Age at visit, y | ||||
| 18–25 | 0 (0.0) | 185 (24.1) | 33 (40.7) | 192 (12.4) |
| 26–35 | 6 (20.0) | 356 (46.3) | 40 (49.4) | 730 (47.3) |
| 36–40 | 24 (80.0) | 228 (29.6) | 8 (9.9) | 621 (40.2) |
| Ovarian radiation dose, cGy | ||||
| None | 7 (23.3) | 680 (88.4) | 14 (17.3) | 710 (46.0) |
| <50 | 2 (6.7) | 17 (2.2) | 32 (39.5) | 535 (34.7) |
| 50–99 | 3 (10.0) | 8 (1.0) | 8 (9.9) | 99 (6.4) |
| 100–999 | 8 (26.7) | 40 (5.2) | 20 (24.7) | 158 (10.2) |
| 1000–1999 | 7 (23.3) | 16 (2.1) | 3 (3.7) | 26 (1.7) |
| ≥2000 | 3 (10.0) | 8 (1.0) | 4 (4.9) | 15 (1.0) |
| Alkylating agents (cyclophosphamide equivalent dose), g/m2 | ||||
| 0 | 4 (13.3) | 337 (43.8) | 29 (35.8) | 908 (58.8) |
| ≥0–<4 | 3 (10.0) | 63 (8.2) | 6 (7.4) | 186 (12.1) |
| 4–<8 | 3 (10.0) | 143 (18.6) | 7 (8.6) | 147 (9.5) |
| 8–<10 | 1 (3.3) | 96 (12.5) | 7 (8.6) | 63 (4.1) |
| 10–<12 | 4 (13.3) | 41 (5.3) | 10 (12.3) | 53 (3.4) |
| 12–<20 | 10 (33.3) | 58 (7.5) | 15 (18.5) | 148 (9.6) |
| ≥20 | 5 (16.7) | 31 (4.0) | 7 (8.6) | 38 (2.5) |
CCSS = Childhood Cancer Survivor Study; PM = premature menopause; SJLIFE = St. Jude Lifetime Cohort Study.
After genotyping QC, there were 830 884 genotyped SNPs included in our analysis. While no SNP reached genome-wide statistical significance under the additive model (P < 5.0×10⁻⁸), a locus of 13 SNPs were observed over a 70 kb region on chromosome 4q32.1, all with a P value of less than 10-5 and a minimum P value of 3.3×10⁻⁷ (rs9999820), after adjusting for the clinical covariates (Table 2, Figure 1). Prevalence odds ratios of the risk alleles of the 13 SNPs in the additive model ranged from 4.19 to 7.52. The conditional analysis of the 13 SNPs identified two distinct SNPs with nominal statistical significance (P < .05; rs131149369:G, rs9999820:G) (Supplementary Table 1, available online). Analysis of the imputed genotypes did not identify any additional SNPs reaching genome-wide statistical significance or further refine the genotyped data results (Supplementary Methods, available online).
Results from the single-SNP genome wide association analysis showing genotyped SNPs with P values lower than 10-5 in the discovery cohort (SJLIFE), with the OR representing the increased prevalence of premature menopause for each copy of the RA
| SNP (GRCh37/hg19 position) | RA | Copies of RA | Nearest Gene | RA OR (95% CI) | P* | |||||
|---|---|---|---|---|---|---|---|---|---|---|
| 0 | 1 | 2 | ||||||||
| PM + | PM- | PM + | PM- | PM + | PM- | |||||
| rs9999820 (4:156118325) | G | 1 | 141 | 9 | 390 | 20 | 235 | NPY2R | 7.52 (2.95 to 19.22) | 3.3×10⁻⁷ |
| rs4323056 (4:156057352) | A | 2 | 135 | 7 | 363 | 21 | 253 | NPY2R | 6.87 (2.86 to 16.52) | 3.5×10⁻⁷ |
| rs6810505 (4:156049730) | G | 2 | 146 | 7 | 366 | 21 | 257 | NPY2R | 6.06 (2.58 to 14.22) | 9.5×10⁻⁷ |
| rs12643129 (4:156052085) | A | 2 | 142 | 7 | 358 | 21 | 268 | NPY2R | 6.11 (2.61 to 14.28) | 9.8×10⁻⁷ |
| rs2880418 (4:156069879) | G | 2 | 195 | 11 | 378 | 17 | 187 | NPY2R | 5.66 (2.52 to 12.73) | 1.5×10⁻⁶ |
| rs10793451 (10:44103895) | T | 0 | 145 | 10 | 356 | 20 | 265 | ZNF485 | 7.14 (2.71 to 18.81) | 2.0×10⁻⁶ |
| rs13114936 (4:156062755) | G | 3 | 197 | 9 | 379 | 18 | 196 | NPY2R | 5.21 (2.39 to 11.35) | 2.0×10⁻⁶ |
| rs10058075 (5:39416294) | G | 0 | 42 | 4 | 283 | 26 | 444 | DAB2 | 11.64 (3.18 to 42.63) | 3.7×10⁻⁶ |
| rs7669884 (4:156048818) | C | 2 | 129 | 7 | 354 | 21 | 285 | NPY2R | 5.72 (2.40 to 13.65) | 4.0×10⁻⁶ |
| rs13121931 (4:156070886) | G | 3 | 197 | 10 | 376 | 17 | 196 | NPY2R | 4.81 (2.25 to 10.27) | 5.1×10⁻⁶ |
| rs11735253 (4:156116644) | C | 2 | 215 | 12 | 378 | 16 | 173 | NPY2R | 4.85 (2.25 to 10.46) | 5.7×10⁻⁶ |
| rs3966085 (4:69830542) | G | 0 | 28 | 1 | 219 | 29 | 521 | UGT2A3 | 28.89 (3.10 to 269.69) | 6.1×10⁻⁶ |
| rs12186303 (4:69864983) | A | 0 | 27 | 1 | 208 | 29 | 533 | UGT2A3 | 28.89 (3.09 to 269.83) | 6.4×10⁻⁶ |
| rs10447083 (4:69852666) | C | 0 | 24 | 1 | 203 | 29 | 542 | UGT2A3 | 28.89 (3.00 to 261.92) | 8.1×10⁻⁶ |
| rs4402990 (4:156108933) | C | 5 | 280 | 9 | 356 | 16 | 132 | NPY2R | 4.19 (2.10 to 8.37) | 8.2×10⁻⁶ |
| rs4456917 (4:156108651) | G | 5 | 280 | 9 | 357 | 16 | 132 | NPY2R | 4.19 (2.10 to 8.37) | 8.3×10⁻⁶ |
| rs11099988 (4:156109178) | A | 5 | 280 | 9 | 356 | 16 | 133 | NPY2R | 4.19 (2.10 to 8.37) | 8.3×10⁻⁶ |
| rs4428241 (4:156108671) | A | 5 | 279 | 9 | 355 | 16 | 133 | NPY2R | 4.19 (2.10 to 8.37) | 8.3×10⁻⁶ |
| rs6759058 (2:46000486) | A | 5 | 345 | 15 | 351 | 10 | 73 | PRKCE | 4.30 (2.14 to 8.64) | 9.1×10⁻⁶ |
| rs3803922 (19:35619019) | G | 6 | 308 | 15 | 349 | 9 | 90 | LGI4 | 5.27 (2.35 to 11.81) | 9.7×10⁻⁶ |
Two-sided likelihood ratio test P values. CI = confidence interval; OR = odds ratio; PM = premature menopause; RA = risk allele; SJLIFE = St. Jude Lifetime Cohort Study; SNP = single nucleotide polymorphism.
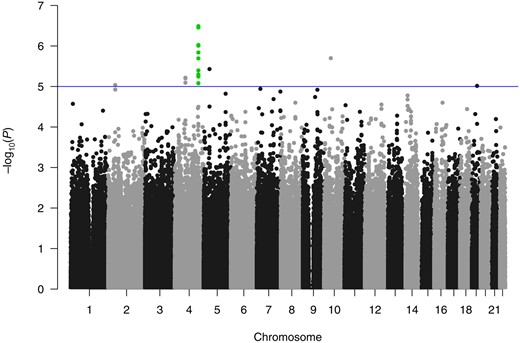
Manhattan plot from a single–single nucleotide polymorphism genome-wide association analysis, which identified 13 SNPs in close proximity on chromosome 4, all with P values of less than 10-5, with a minimum P value of 3.3 × 10⁻⁷.
The LD structure of the chromosome 4 region surrounding the 13 SNPs from 156.00 to 156.13 megabase pairs (from the 5’ end) indicate that the 13 SNPs did not form a single LD block (Figure 2). The 13 SNPs appear to be divided into four LD blocks (European populations: mean within-block r2 = .96, mean between-block r2 = .50) that are not necessarily adjacent to each other and lay in a region with a complex LD structure (Figure 2) (14).
![Linkage disequilibrium (LD) matrix (r2 for individuals with European ancestry from zero [white] to one [black]), highlighting four LD blocks that contain the 13 single nucleotide polymorphisms on chromosome 4q32.1 with P values of less than 10-5, with a mean between-LD block r2 of .50 and a mean within-LD block r2 of .96 (25).](https://oup.silverchair-cdn.com/oup/backfile/Content_public/Journal/jnci/110/8/10.1093_jnci_djx281/1/m_djx281f2.jpeg?Expires=1749785474&Signature=lsm-QTaZqOKgaQ9xwdesCGMjDIOPkw0yu0axbdCxGKrHmZ30yizsTyV4X~Bf~DY4M~hcsOUjmVdrEtgbolt-YnBA9S71VhQwta0e0U6Rz0U7VZ-TPSmNnziC8hz-8mIT31R-0nqEo6qCa7sUrIn51CQJgCqomwuf5dJ3BYYauPrIO64-YsmtkNnRh21O7B5KsgN8Uy7cJVoyMOZHxhJQbI9bs5aRXiFC1ja2Gd5xTzTJVeBA8UqqUsQrW1umw2QZe3zieYZdhYM02gvDNBhej1ZcvwCV2xykdHXWCi8l86Q1belhpNNEQgvcQwCJgTg0QMNLYBcYVJutM2-fWwyMzA__&Key-Pair-Id=APKAIE5G5CRDK6RD3PGA)
Linkage disequilibrium (LD) matrix (r2 for individuals with European ancestry from zero [white] to one [black]), highlighting four LD blocks that contain the 13 single nucleotide polymorphisms on chromosome 4q32.1 with P values of less than 10-5, with a mean between-LD block r2 of .50 and a mean within-LD block r2 of .96 (25).
The LD structure at the chromosome 4 locus and the results of the conditional analysis motivated us to explore if the four LD blocks form a haplotype that better captures the observed signal. A tag SNP was chosen for each of the four LD blocks based on two factors. First, we prioritized SNPs on both the Affymetrix and Illumina platforms to facilitate replication. Second, we prioritized SNPs with the fewest missing values in the genotyped data set. Based on model likelihood with phased data (Supplementary Methods, available online), a haplotype was formed using a SNP from each LD block (tag SNPs, rs4323056:A(freq:0.59), rs13114936:G(freq:0.51), rs4402990:C(freq:0.41), rs9999820:G(freq:0.57)) with an adjusted odds ratio of 1.70 (95% confidence interval [CI] = 0.48 to 6.44) for one copy of the haplotype and 23.00 for two copies (95% CI = 6.55 to 98.06), with 16 of 30 cases being homozygous carriers (two copies). This is consistent with a recessive-risk pattern for the haplotype. Frequency of the haplotype is 0.36 in individuals with European ancestry and 0.39 in individuals with African ancestry, corresponding to expected homozygosities of 0.13 and 0.15, respectively (14). Stratification by ancestry yielded results consistent with the combined analysis (Supplementary Methods, available online). Sixty percent of survivors exposed to ovarian RT and homozygous for the haplotype had PM and had the highest PM prevalence (OR = 25.89, 95% CI = 6.18 to 138.31, exact P = 8.2×10⁻⁶) (Table 3; Supplementary Methods, available online).
Association of premature menopause prevalence with homozygosity for the risk haplotype, with the counts (No.) of cases and controls, counts (N+) of those who are homozygous for the risk haplotype, and odds ratios, by treatment group in both the discovery and replication cohorts after adjusting for treatment exposures
| Treatment | SJLIFE (clinically diagnosed PM) | CCSS (self-reported PM) | ||||||
|---|---|---|---|---|---|---|---|---|
| No. of cases (No.+) | No. of controls (No.+) | OR (95% CI) | P* | No. of cases (No.+) | No. of controls (No.+) | OR (95% CI) | P† | |
| Ovarian RT = 0, CED < 8 g/m2 | 2 (1) | 486 (66) | 6.06 (0.28 to 57.62) | .06 | 20 (2) | 993 (165) | 0.52 (0.12 to 2.22) | .38 |
| Ovarian RT = 0, CED ≥ 8 g/m2 | 5 (3) | 194 (26) | 13.27 (2.11 to 85.50) | 9.0×10⁻³ | 26 (2) | 253 (29) | 0.68 (0.15 to 3.00) | .61 |
| Ovarian RT > 0 | 23 (12) | 89 (8) | 25.89 (6.18 to 138.31) | 8.2×10⁻⁶ | 35 (10) | 297 (34) | 3.97 (1.67 to 9.41) | .002 |
Two-sided P value obtained through the Fisher exact test (see the “Methods”). CCSS = Childhood Cancer Survivor Study; CED = cyclophosphamide equivalent dose; CI = confidence interval; OR = odds ratio; PM = premature menopause; RT = radiotherapy; SJLIFE = St. Jude Lifetime Cohort Study.
Two-sided P value obtained through the Wald test.
In survivors exposed to ovarian RT, homozygosity for the haplotype had a sensitivity of 0.52 (95% CI = 0.31 to 0.73) and specificity of 0.91 (95% CI = 0.83 to 0.96) for clinically assessed PM as performed in SJLIFE. Among survivors exposed to ovarian RT, inclusion of homozygosity for the haplotype in the clinical model had a statistically significant increase in the performance of predicting clinically diagnosed PM in the SJLIFE discovery cohort (area under the ROC curve = 0.83 vs 0.90, P = .002). There was only one survivor who met Edinburgh Criteria for oocyte cryopreservation based on the clinical model: this survivor has had PM. In contrast, 15 survivors met Edinburgh Criteria based on the clinical model plus homozygosity for the haplotype: nine had PM, and the remaining six were all younger than age 40 years (five were age 30 years or younger) (Supplementary Table 2, available online).
Replication in CCSS
The haplotype’s association with PM was replicated in an independent cohort of CCSS survivors using the identical model as SJLIFE. The CCSS included 81 PM cases among 1624 female survivors. Of the four tag SNPs in the haplotype, three SNPs are on both the Affymetrix and Illumina platforms. The SNP specific to the Affymetrix platform (rs4402990) was replaced by a SNP in high LD (rs4425326:T; r2 > .975) to define an Illumina platform haplotype (CCSS haplotype). We replicated the SJLIFE finding in CCSS participants exposed to ovarian RT using the CCSS haplotype, where homozygosity for the haplotype had a statistically significant increase in the prevalence of PM (OR = 3.97, 95% CI = 1.67 to 9.41, P = .002) (Table 3; Supplementary Methods, available online).
Bioinformatics
The expanded GS on chromosome 4q32.1 included 137 unique SNPs spanning an intergenic region approximately 6–83 kb from the 5’ end of the protein-coding Neuropeptide Receptor 2 gene (NPY2R) gene, which is most highly expressed in brain tissues (Supplementary Figure 3, available online) (26). Five SNPs in the expanded GS (rs12641982:G, rs9999820:G, rs4467508, rs7671213:C, rs9990781:G) were statistically significantly associated with increased NPY2R expression in the hippocampus (effect size range = 0.42–0.44, P range = 3.0×10⁻⁶–7.7×10⁻⁶), including the top SNP from our single-SNP analysis (rs9999820:G) (Table 2) with an effect size of 0.44 and P value of 3.1×10⁻⁶ (26). In addition, we also observed that the SNPs in the expanded GS were statistically significantly enriched for Polycomb-repressed chromatin states in six human cell types, including H9-derived cultured neurons (P = 7.2×10⁻⁹) and ovarian cells (P = 5.6×10⁻⁸) (Table 4). Visualization of the expanded GS in brain and ovarian cell types revealed that the region of interest overlaps a distinctive repressive-state pattern that is strongest in the region surrounding NPY2R (Figure 3).
Polycomb-repressed chromatin state enrichment analysis for SNPs in the expanded genetic signal relative to the reference set of SNPs consisting of all the other SNPs from the original single-SNP analysis with PM-association P < .05 (“comparison SNP set”) (statistically significant enrichments only, among 127 human cell types with OR > 1 and P < .05)
| Epigenome identifier | Epigenomes | Expanded GS SNPs (n = 137)* | Comparison SNPs (n = 33 074)† | OR (95% CI) | P‡ |
|---|---|---|---|---|---|
| E061 | Foreskin melanocyte | 109 | 7652 | 12.93 (8.46 to 20.37) | 6.6×10-44 |
| E094 | Gastric | 10 | 215 | 12.03 (5.56 to 23.28) | 3.6×10⁻⁸ |
| E097 | Ovary | 33 | 2855 | 3.36 (2.19 to 5.02) | 5.6×10⁻⁸ |
| E010 | H9 derived neuron cultured cells | 55 | 6172 | 2.92 (2.04 to 4.17) | 7.2×10⁻⁹ |
| E119 | HMEC mammary epithelial | 29 | 3939 | 1.99 (1.27 to 3.02) | 2.1×10⁻³ |
| E095 | Left ventricle | 39 | 5640 | 1.94 (1.30 to 2.84) | 8.8×10⁻⁴ |
Frequency of SNP overlap with ChromHMM Polycomb repressed state among 137 SNPs in the expanded GP in a given epigenome. CI = confidence interval; GS = genetic signal; OR = odds ratio; PM = premature menopause; SNP = single nucleotide polymorphism.
Frequency of SNP overlap with ChromHMM Polycomb repressed state among 33 074 nominally statistically significant GWAS SNPs (P < .05) in a given epigenome.
Two-sided Fisher exact test.
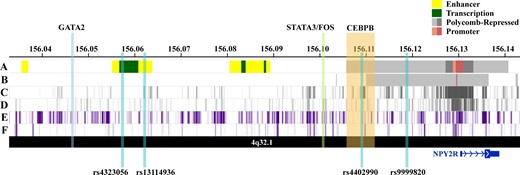
Visualization of regulatory annotations for the expanded chromosome 4q32.1 genetic signal associated with premature menopause in neuron and ovary cell types, along with haplotype single nucleotide polymorphisms and bound transcription factors' genomic locations. A) Chromatin state annotations (ChromHMM) in H9- derived neuron cells. Colored genomic regions reflect chromHMM annotations for chromain states (enhancer, transcribed, Polycomb-repressed, and promoter) (23). B) ChromHMM annotations in ovary cells. C) ENCODE histone modifications associated with Polycomb-repressed regions (H3K27me3) for H9-derived neurons (23). D) H3K27me3 marks for placenta amnion cells (ovary cell data unavailable) (23). E) ENCODE histone modifications associated with repressed regions (H3K9me3) for H9-derived neurons (23). F) H3K9me3 marks for ovary cells (23).
To further assess whether the NPY2R repressive state observed in relevant tissues from healthy donors in GTEx may facilitate PM, we examined transcription factor (TF) and evolutionary conservation annotations for SNPs in the expanded GS (Table 5). The LD blocks tagged by rs4323056 and rs4402990 included SNPs in genomic regions with bound TFs, specifically CEBPB, GATA2, FOS, and STAT3 (Table 5). SNPs in these LD blocks also showed evidence of alterations in related TF binding site motifs. In particular, the LD block tagged by rs4402990 includes an evolutionarily conserved genomic region containing SNPs that show evidence of CEBPB binding or association with altered CEBPB motifs. CCAAT/enhancer-binding protein-beta (CEBPB) is a critical transcription factor for the LH surge-regulated pathway that is crucial for successful ovulation in mammals (27).
Bioinformatics data summary for 137 SNPs, representing the expanded genetic signal across four linkage disequilibrium blocks
| Tag SNP for each of 4 LD blocks | Tag SNP distance from 5’ of NPY2R, kb | Enhancer peaks in relevant cell types (unique epigenome IDs)* No. of SNPs in peaks | DNAse peaks in relevant cell types (unique epigenome IDs)† No. of SNPs in peaks | Conservation score‡ (SNP overlap) Distance from 5’ of NPY2R | Bound TF§ (SNP overlap) Distance from 5’ of NPY2R | Altered motifs‖ |
|---|---|---|---|---|---|---|
| rs4323056 | 72 | E010 (H9 neuron cells) | E081 (fetal brain male)Total brain: 1 SNP | No overlap with conserved regions | GATA2(rs1456447, rs1456446)∼84 kb | GATA, Pou1f1, STAT |
| E007 (H1 neuronal progenitors) | ||||||
| E009 (H9 neuronal progenitors) | ||||||
| E067 (brain angular gyrus) | ||||||
| E068 (brain anterior caudate) | ||||||
| E069 (brain cingulate gyrus) | ||||||
| E071 (Brain hippocampus) | ||||||
| E073 (Brain prefrontal cortex) | ||||||
| Total brain: 11 SNPs | ||||||
| rs13114936 | 67 | E010 (H9 neuron cells) | No overlap with DNAse peaks | No overlap with conserved regions | No overlap with regions with bound TFs | CEBPB, Pou1f1 |
| E009 (H9 neuronal progenitors) | ||||||
| E054 (ganglion neurospheres) | ||||||
| E067 (brain angular gyrus) | ||||||
| E071 (brain hippocampus) | ||||||
| Total brain: 7 SNPs | ||||||
| rs4402990 | 21 | E125 (NH-A astrocyte)Total brain: 5 SNPs | E082 (fetal brain female)Total brain: 1 SNP | 251-355(rs7683262, rs67320132, rs13115665)∼21–28 kb | STAT3 (rs2342665, rs6833823)∼29 kb | CEBPB, GATA, Pou1f1, STAT |
| E023 (mesenchymal adipocyte)Total GI/fat: 11 SNPs | E092 (fetal stomach)E094 (gastric)Total GI/fat: 2 SNPs | FOS (rs6833823)∼29 kb | ||||
| CEBPB (rs13119934, rs13119342, rs10857284, rs10776530)∼18–24 kb | ||||||
| rs9999820 | 11 | No overlap with enhancer peaks | No overlap with DNAse peaks | 336(rs2342658, rs13115436)∼13 kb | No overlap with regions with bound TFs | No motif overlap |
SNPs in the LD block overlap histone modification mark peaks (H3K4me1, H3K27ac) from ENCODE ChIP-seq experiments (gappedPeak algorithm) in the listed cell types. LD = linkage disequilibrium; SNP = single nucleotide polymorphism; TF = transcription factor.
SNPs in the LD block overlap ENCODE DNAse I hypersensitivity peaks (gappedPeak algorithm) in the listed cell types.
SNPs in the LD block with normalized PhastCons conservation scores greater than 200 are listed, using data from the ENCODE 46-way vertebrate species alignment (PhastCons HMM method).
SNPs in the LD block with evidence of bound TFs are listed, using data from ENCODE TF ChIP-seq experiments (161 TFs across 91 cells types).
SNP in the LD block are associated with the listed altered TF binding site motifs (PWM algorithm).
Discussion
To our knowledge, this is the first study to assess genetic risk factors for treatment-associated PM on a genome-wide scale among childhood cancer survivors. We identified a common haplotype in a 70 kb region in chromosome 4 that is associated with markedly increased prevalence of clinically diagnosed PM among survivors exposed to ovarian RT. This association was replicated in a second independent cohort. Bioinformatics evidence suggests that the haplotype’s contribution to PM susceptibility among childhood cancer survivors exposed to ovarian RT is biologically plausible. Our bioinformatics analyses indicate that the haplotype may normally contribute to regulatory repression of NPY2R, affecting TF recruitment/binding for this gene. Specifically, the genetic signal is located upstream of NPY2R, a gene that has a pro-adipogenic effect (28) and regulates gonadotropin-releasing hormone pulses, LH, and ovulation (29).
Previous studies have reported statistically significant associations between childhood cancer treatment and premature menopause, including RT (RT > 10 Gray vs no RT, OR = 109.59, 95% CI = 28.15 to 426.70) and alkylating agents (upper tertile alkylating agent score vs no CED (OR = 5.78, 95% CI = 2.90 to 11.55) (6). The large effect size of the high-risk haplotype after adjusting for these treatment exposures, together with the relatively high frequency, suggests that the homozygous risk haplotype in female survivors exposed to ovarian RT may identify those at the highest PM risk. Among SJLIFE female survivors exposed to ovarian RT with the homozygous risk haplotype, 60.0% developed PM to date: the remaining 40.0% were on average 10.0 years younger at follow-up (median age 29.0 vs 39.0 years) and are still at high risk for PM (odds of PM increases 12.9-fold over 10 years according to our model). This highlights the need for focusing on prediction of the magnitude of PM risk as well as the timing of PM. To illustrate the potential clinical impact of our findings, we assessed who would meet Edinburgh Criteria for consideration of fertility-preserving procedures and observed that adding the haplotype information greatly increased the identification of high-risk survivors with PM. The addition of the haplotype, if validated further, could allow substantially more survivors who are at high PM risk meeting the criteria for considering oocyte cryopreservation.
A genome-wide association study (GWAS) of 70 000 women in 2015 is the largest most recent genome-wide evaluation of genetic factors associated with age at natural menopause in the general population: it identified 44 loci associated with age at natural menopause (28). The region of chromosome 4 the current study identified does not overlap with any of these 44 loci, suggesting that the association we report may be specific to PM risk following childhood cancer treatment. Neuropeptide Y (“NPY”) has been shown to have pro-adipogenic effects in mice that are mediated in part by NPY2R (29), which may vary radiation sensitivity by affecting body composition. NPY-NPY2R activity may also modify gonadotropin-releasing hormone secretion in mice and hence influence gonadal function (30). Our bioinformatics analyses suggest that the SNPs in the expanded GS of chromosome 4q32.1 may contribute to context-specific NPY2R transcription in PM-relevant cell types through Polycomb repression. It is therefore possible that the genomic changes associated with the candidate haplotype region that facilitate loss of NPY2R repression may contribute to PM risk in survivors, particularly among those exposed to ovarian RT, by affecting follicular maturation processes and rendering individuals more susceptible to the adverse effects of gonadotoxic treatments. This hypothesis is supported by observations of Chemaitilly et al. that survivors with higher body mass index experienced premature ovarian insufficiency at substantially lower than expected rates (10).
The use of clinically ascertained data from the SJLIFE cohort represents a major strength of our study and greatly increases the diagnostic resolution of PM by allowing the distinction between primary ovarian and hypothalamic/pituitary causes (10). However, this study has several important limitations, including a small number of cases that might have inflated the odds ratio estimates of the discovery analysis and approximately half of the eligible discovery cohort being unavailable for analysis. Furthermore, among participants at risk for PM who were excluded from analyses due to missing data (n = 91), were more likely to have been exposed to ovarian radiation (51.6% vs 14.0%), and were less likely to be lymphoma survivors (10.5% vs 17.9%) than participants included in analyses (n = 799), these differences might have contributed bias to our results. While the number of PM cases was relatively small in SJLIFE, the lower bound of the confidence interval was an odds ratio of 6.18, which is an appreciable effect size and of clinical significance. The limited sample size might also reduce our power in the conditional sequential analysis, where only two SNPs reached nominal statistical significance. Larger data sets with clinically assessed PM would allow for independent validation of the prediction performance of the models and further investigation in different ancestry groups. Another limitation is that the replication analysis used PM based on self-reported data, which likely resulted in the attenuated association between the haplotype and PM compared with the association observed in SJLIFE.
Our genome-wide association study found evidence for an association between a locus on chromosome 4q32.1 and PM prevalence among a subgroup of female survivors exposed to ovarian RT. The cluster of 13 identified SNPs represents a high-risk haplotype that captures the majority of the SJLIFE PM cases. These findings, which will require additional validation in a clinically assessed population and functional studies, suggest that incorporating genetic screening into cancer survivorship prediction models for PM would enhance performance of prediction and refine treatment-based risk profiling. The risk haplotype may provide a screening method to identify childhood cancer patients at greatest need of fertility preservation procedures, providing a means to address the familial and psychosocial burden that may result from premature menopause in this group. Elucidation of the functional role of the NPY2R haplotype in the hypothalamic-pituitary hormone axis may provide insight into its impact in female survivors’ fertility.
Funding
This work was supported by the US National Cancer Institute (U01CA195547, U24CA55727, R01CA216354, and the National Cancer Institute Intramural Research Program) and the American Lebanese Syrian Associated Charities.
Notes
Authors: Russell J. Brooke, Cindy Im, Carmen L. Wilson, Matthew J. Krasin, Qi Liu, Zhenghong Li, Yadav Sapkota, WonJong Moon, Lindsay M. Morton, Gang Wu, Zhaoming Wang, Wenan Chen, Rebecca M. Howell, Gregory T. Armstrong, Smita Bhatia, Sogol Mostoufi-Moab, Kristy Seidel, Stephen J. Chanock, Jinghui Zhang, Daniel M. Green, Charles A. Sklar, Melissa M. Hudson, Leslie L. Robison, Wassim Chemaitilly, Yutaka Yasui
Affiliations of authors: St. Jude Children's Research Hospital, Memphis, TN (RJB, CLW, MJK, ZL, YS, WJM, GW, ZW, WChen, GTA, JZ, DMG, MMH, LLR, WChem, YY); University of Alberta, Edmonton, AB, Canada (CI, QL); National Cancer Institute, National Institutes of Health, Bethesda, MD (LMM, SJC); The University of Texas MD Anderson Cancer Center, Houston, TX (RMH); University of Alabama at Birmingham, Birmingham, AL (SB); The Perelman School of Medicine at the University of Pennsylvania, Philadelphia, PA (SMM); Fred Hutchinson Cancer Research Center, Seattle, WA (KS); Memorial Sloan-Kettering Cancer Center, New York, NY (CAS).
The funding bodies played no role in the design of the study, the collection of data, the analysis of data, the interpretation of data, the writing of the manuscript, or the decision to submit the manuscript.
RJB, CI, MMH, LLR, WChem, and YY designed the study. RJB, CLW, MJK, ZL, YS, WJM, LMM, RMH, SB, SMM, KS, and WChem prepared the data. RJB, CI, QL, YS, and YY analyzed the data and prepared the report. RJB, CI, CLW, MJK, QL, ZH, YS, WJM, LMM, GW, ZW, WChen, RMH, GTA, SB, SMM, KS, SJC, JZ, DMG, CAS, MMH, LLR, WChem, and YY discussed and revised the report. RJB, MMH, LLR, WChem, and YY supervised the study.
The authors have no conflicts of interest to declare.
References
Author notes
See the full list of authors and affiliations in the Notes section.

