


Abstract
Many carnivore populations have experienced substantial declines and are at increased risk of extinction, mainly due to negative interactions with humans and biological traits that make them susceptible to habitat loss and fragmentation, often driven by agricultural expansion. Carnivore community richness is likely influenced by many direct and indirect factors, though it is unclear how carnivore communities are structured in prairie landscapes that are considered one of the most imperiled ecosystems worldwide. Our goal was to identify landscape-scale effects driving carnivore community richness in a contemporary agro-prairie ecosystem. We used 3 years of presence data (2018–2020) from camera-trap sites (n = 381) distributed across western Kansas, United States and developed a structural equation model (SEM) to test a priori hypotheses explaining carnivore richness. Measures of water availability, native prairie, and agriculture—as well as sampling effort (i.e., days cameras were active)—were all positively associated with carnivore richness. Additionally, our index of rabbit abundances at sites had a direct positive effect on our measure of carnivore richness. Our SEM explained 42% of the variance in carnivore richness (χ2 = 8.76, d.f. = 21, P = 0.99) in this human-dominated landscape. Our results suggest that carnivore communities in agro-prairie landscapes are structured through multiple direct and indirect landscape-scale pathways. Contemporary agro-prairie mosaics may act as filters for the agricultural tolerance of carnivores, with species more vulnerable to native prairie loss becoming locally extirpated.
Muchas poblaciones de carnívoros han disminuido sustancialmente y corren un mayor riesgo de extinción, principalmente debido a las interacciones negativas con humanos y sus propias características biológicas que las hacen susceptibles a la pérdida y fragmentación del hábitat. La pérdida y fragmentación del hábitat se debe en gran medida a la expansión agrícola en muchas regiones, representando una amenaza significativa para la persistencia de carnívoros. La riqueza de la comunidad carnívora está influenciada probablemente por muchos factores directos e indirectos, aunque no está claro cómo se estructuran las comunidades carnívoras dentro de los paisajes de pastizales, ecosistemas considerados de los más amenazados en el mundo. Nuestro objetivo es identificar efectos a escala del paisaje que impulsan la riqueza de la comunidad carnívora dentro de un ecosistema agro-pastizal contemporáneo. Utilizamos datos de presencia de tres años (2018–2020) en estaciones de cámaras trampa (n = 381) distribuidos a través del oeste de Kansas, EE. UU. y desarrollamos un modelo de ecuación estructural (SEM) para probar una hipótesis a priori que explique la riqueza de carnívoros. La disponibilidad de agua, el pastizal nativo y la agricultura, tanto como el esfuerzo de muestreo (es decir, los días en que las cámaras estuvieron activas), se asociaron positivamente con la riqueza de carnívoros. Además, nuestro índice de abundancia de lagomorfos en nuestro sitio agro-pastizal contemporáneo tuvo un efecto positivo directo con la riqueza de carnívoros. Nuestro SEM explicó el 42% de la variación en la riqueza de carnívoros (χ2 = 8.76, d.f. = 21, P = 0.99) en este paisaje dominado por humanos. Nuestros resultados sugieren que las comunidades de carnívoros en paisajes agro-pastizal están estructuradas a través de múltiples vías directas e indirectas a escala de paisaje. Los mosaicos agro-pastizales contemporáneos podrían actuar como filtros para la tolerancia agrícola de los carnívoros, con especies más vulnerables a la pérdida de pastizales nativas extirpadas localmente.
Biodiversity worldwide has declined, with most losses attributed to human-modified landscape modifications including resource extraction, habitat loss and degradation, invasive species, and overharvest (Collen et al. 2009; Butchart et al. 2010). Vertebrates are particularly vulnerable, with 16–33% of species considered globally threatened (Schipper et al. 2008; Hoffmann et al. 2010). Mammalian carnivores have experienced substantial population declines and are at increased risk of extinction due to negative interactions with humans (e.g., overkill, persecution, loss of prey base) and biological traits (e.g., large body sizes, large home ranges, low densities, slow life histories) that make them vulnerable with habitat loss and fragmentation (Cardillo et al. 2004; Ripple et al. 2014; Di Minin et al. 2016a, 2016b).
Land cover heterogeneity can structure species diversity across a wide range of taxa (Stein et al. 2014) including within carnivore communities (Davies et al. 2021). However, local prey availability is likely the main driver of carnivore diversity (Rich et al. 2017). Specialist carnivore species, including Guigna (Oncifelis guigna) and Swift Fox (Vulpes velox), are more obligately associated with native land cover and are sensitive to agricultural systems (Acosta-Jamett and Simonetti 2004; Ferreira et al. 2018)—while generalist carnivores, including coyotes (Canis latrans) are often able to use agricultural landscapes even if only small native habitat patches remain (Andrén 1994). However, if apex carnivores are locally extirpated due to land-use changes, populations of smaller carnivores may expand and occur in human-modified systems at greater densities (Crooks and Soulé 1999; Ritchie and Johnson 2009). Due to the sensitivity of carnivores to habitat loss and fragmentation, native carnivore species richness may indicate overall ecosystem health (Noss et al. 1996; Ordeñana et al. 2010).
Colonization of the North American Great Plains by European Americans resulted in large-scale prairie conversion to row-crop agriculture and permanent grazing lands for cattle (Bos taurus) and sheep (Ovis aries; Hart and Hart 1997; Hartnett et al. 1997; Licht 1997; Brockway et al. 2002). Much of the Great Plains now supports a contemporary suite of carnivore species within a human-dominated landscape. Carnivores such as gray wolves (Canis lupus), grizzly bears (Ursus arctos horribilis), and mountain lions (Puma concolor) were locally extirpated from most of the region during the 19th century (Choate 1987). Removal of these large carnivores left a void at upper trophic levels, likely benefitting medium-sized sympatric carnivores (e.g., coyotes; Levi and Wilmers 2012), while restricting small carnivores due to intraguild competition with coyotes (Mac Nally 1983; Palomares and Caro 1999; Fedriani et al. 2000; Linnell and Strand 2000). However, it remains unclear how landscape-scale factors, including configuration and composition of contemporary land-use types, structure carnivore richness in agro-prairie landscapes.
Carnivore community richness is influenced by many factors including prey availability (Li et al. 2021), landscape composition (Wait et al. 2018) and configuration (Moore et al. 2022), land cover heterogeneity (Pita et al. 2009), water availability (Schuette et al. 2013), and suitable denning substrates (Kaufman et al. 2005). Most studies, however, have related carnivore richness patterns to land cover heterogeneity (Manlick et al. 2020; Davies et al. 2021) and human encroachment (e.g., urbanization, agriculture conversion; Ordeñana et al. 2010; Ferreira et al. 2018; Wait et al. 2018). We are unaware of studies assessing how carnivore richness varies across shortgrass prairie regions though these areas cover a large portion of the Great Plains. Carnivore species representative of shortgrass prairie ecosystems include Coyote, Red Fox (Vulpes vulpes), Swift Fox, Bobcat (Lynx rufus), Striped Skunk (Mephitis mephitis), Long-tailed Weasel (Mustela frenata), Black-footed Ferret (Mustela nigripes), Least Weasel (Mustela nivalis), American Badger (Taxidea taxus), and Raccoon (Procyon lotor; Kansas Mammal Atlas 2022).
Using 3 years of presence data from camera-trap sites distributed across western Kansas, United States, our goal was to identify landscape-scale factors driving carnivore community richness in an agro-prairie ecosystem. Due to uncertainty of pathways by which landscape change may influence carnivore richness, we chose to test a priori hypotheses (Fig. 1) for fit within a structural equation model (SEM), with previous carnivore research informing our selection of model covariates. Based on previous studies, lagomorphs including black-tailed jackrabbits (Lepus californicus) and eastern cottontail rabbits (Sylvilagus floridanus) are the primary prey species for carnivores in the region (Brillhart and Kaufman 1995; Kamler and Gipson 2000) and therefore, we predicted that greater lagomorph abundances at sites would positively influence carnivore richness. We predicted that land cover composition (i.e., proportions of agriculture and shortgrass prairie land use) and configuration of land cover types surrounding sites (i.e., land cover edge and diversity) would have both positive (e.g., native prairies) and negative (e.g., row-crop agriculture) influences on carnivore richness (Table 1).
Variables used within latent and structural equation model coefficients and regressions of carnivore richness. Each variable, and its associated scale, is in reference to sampled camera-trap sites (2018 = 375, 2019 = 361, 2020 = 360) within our study area in western Kansas, United States (KS; 7,160,077 ha). A priori predictions of variable influence (positive or negative) on carnivore richness are also included. CRP = Conservation Reserve Program.
| Variable | Source | Range | Description | Predicted influence |
|---|---|---|---|---|
| Row-crop Proportion | CropScape (2018) | 0.00–0.90 | Proportion of row-crop land cover within 2 km | Negative |
| Row-crop Total Edge | CropScape (2018) | 0–110,490 | Total distance (m) of row-crop edges within 2 km | Negative |
| CRP Proportion | CropScape (2018) | 0.00–0.62 | Proportion of CRP land cover within 2 km | Positive |
| CRP Total Edge | CropScape (2018) | 0–51,810 | Total distance (m) of CRP edges within 2 km | Positive |
| Stream Density | U.S. Census Bureau (2018) | 0.00–152.26 | Density of streams within 2 km | Positive |
| Distance to Streams | U.S. Census Bureau (2018) | 2–15,808 | Distance to the nearest stream (m) | Negative |
| Native Prairie | PRAIRIEMAP (2003) | 0.00–0.98 | Proportion of native prairie land cover within 2 km | Positive |
| Loamy Tableland Soil | Web Soil Survey (2018) | 0.00–1.00 | Proportion of loamy tableland soil within 2 km | Positive |
| Land cover Heterogeneity | CropScape (2018); PRAIRIEMAP (2003) | 0.91–2.19 | Shannon diversity index within 2 km | Positive |
| Days Camera Active | Direct sampling 2018–2020 | 27–84 | Total days camera was active | Positive |
| Lagomorph | Direct sampling 2018–2020 | 0–371 | Summed independent observations of black-tailed jackrabbits (Lepus californicus) and eastern cottontail rabbits (Sylvilagus floridanus) at sites. | Positive |
| Chao2 Estimate | Direct sampling 2018–2020 Site encounter histories | 0–11 | Method for evaluating species richness, accounting for rare species (Colwell and Coddington 1994) |
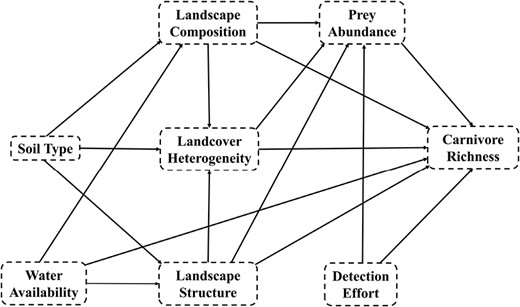
Conceptual flow of the structural equation metamodel for hypothesized effects of soil type, water availability, landscape composition, landscape structure, land cover diversity, prey abundance, and detection effort on carnivore richness in agro-prairie landscapes.
Materials and Methods
Study area.
Our study area included the 31 westernmost counties of Kansas, United States (7.16 million ha; Fig. 2) and was dominated by row-crop agriculture: 62% winter wheat (Triticum aestivum), 1.27 million ha; fallow/idle, 1.05 million ha; corn (Zea mays), 1.05 million ha; sorghum (Sorghum spp.), 612,569 ha; and additional crop types totaling 429,580 ha. These agricultural landscapes are intermixed with Conservation Reserve Program (CRP) land cover (7%) and remnant native prairies (28%). Native prairies were characterized by Side-oats Grama (Bouteloua curtipendula), Buffalo Grass (Bouteloua dactyloides), Big Bluestem (Andropogon gerardii), Little Bluestem (Schizachyrium scoparium), Witchgrass (Panicum capillare), Tumblegrass (Schedonnardus paniculatus), Indiangrass (Sorghastrum nutans), Blue Grama (Bouteloua gracilis), and Sand Dropseed (Sporobolus cryptandrus), among other grass and forb species. Oil wells (n = 20,093) and wind turbines (n = 1,429) were also distributed throughout the region. The study area received 31–107 cm of precipitation annually (increasing West to East), with temperatures ranging from −9° to 49°C (PRISM Climate Group, Oregon State 2021).
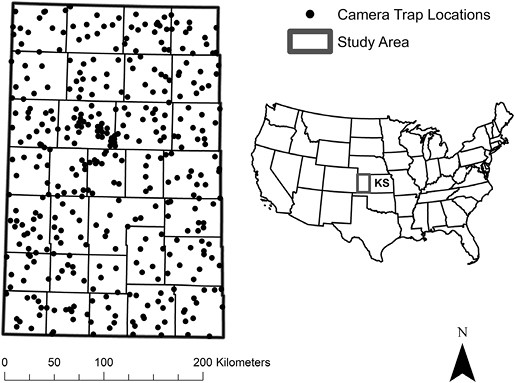
Study area in western Kansas, United States (KS; 71,600 km2) sampled by camera-trap sites (2018 = 375, 2019 = 361, 2020 = 360) for carnivore community richness and lagomorph: Black-tailed Jackrabbit (Lepus californicus) and Eastern Cottontail (Sylvilagus floridanus) abundances over 3 years (2018–2020). Surrounding states included Nebraska (NE), Missouri (MO), Oklahoma (OK), and Colorado (CO).
Data collection.
We randomly selected a large number of site locations (n = 381), using a random-point generator in a geographic information system (ArcMap v. 10.8), to improve estimate precision and to compensate for expected low occupancy rates of secretive carnivores such as bobcat (Long et al. 2011) and swift fox (Kays et al. 2020; Werdel et al. 2022). Each site consisted of a single motion-sensing game camera (Bushnell Trophy Cam; Bushnell Corporation, Overland, Kansas) attached to a metal T-post (40 cm high) and oriented north/south to avoid solar interference. Sites were established nearest the location of randomly generated points unless likelihood of camera destruction by cattle, vehicles, or farm equipment was high. If destruction risk was high, sites were established at the nearest fence line or field edge (mean = 6.76 m; range = 0.00–79.02 m). If we could not obtain landowner permission to establish a site, we moved our site location to the nearest location where access was granted. We placed a wooden stake 3 m in front of cameras, smeared with the olfactory attractant skunk essence and petroleum jelly (F&T Fur Harvester’s Trading Post, Alpena, Michigan) to encourage carnivores to pass in front of the camera’s field of view (Stratman and Apker 2014). We also removed grass and shrub vegetation in front of the camera trap with a handheld weed cutter to reduce visual obstruction within the extent of the field of view. We left each camera trap in place for 28 days, but replaced olfactory attractant, batteries, and digital memory cards at ~14 days.
We sampled each site for 3 years (2018–2020). Landowner access was dynamic throughout the study due to property sales and increased hunting leases, so access was limited to 375 sites in 2018 (5 May to 2 November), 361 sites in 2019 (20 May to 2 October), and 360 sites in 2020 (22 April to 28 September 2020), for a total of 381 sites. To account for variability in seasonality (e.g., climate, plant phenology), life histories (e.g., denning, dispersal), and timing of agricultural practices, we sampled sites in three groups based on latitude (≈125 sites within each of: ≥39°N; <39°N >38°N; ≤38°N). We sampled ~40 sites per month within each group (~120 sites per month). We altered sampling months for all sites, so they were not sampled during the same month each year ( difference in sampling per site = 82 days). Site-specific photographs were archived within a Microsoft Access database (Colorado Parks and Wildlife Photo Warehouse 4.0, Colorado Parks and Wildlife, Fort Collins, Colorado). We tagged photographs for presence of carnivore species during each 28-day sampling period each year. Species-specific presence data and spatial positions of sampling sites used for this analysis are freely available (Palomo-Munoz et al. 2023).
We used a Chao2 estimator to quantify species richness at each site (Chao 1987; Chao and Chiu 2016). The Chao2 estimator is a nonparametric method for evaluating species richness, which incorporates occurrence frequencies of both common (i.e., multiple incidences) and rare species (i.e., single incidences) at sampling sites (Colwell and Coddington 1994). A certain proportion of observed species within an encounter history will be unique to a single sampling occasion, and Chao2 estimates the number of additional species likely to be present, but not observed, providing a more accurate estimate of species richness when communities include rare, or harder to detect, species (Colwell and Coddington 1994; Gotelli and Chao 2013). We estimated Chao2 using the “fossil” package (v. 0.4.0; Vavrek 2011) in R (R Development Core Team 2022). For each site (n = 381), we derived a single Chao2 estimate from all carnivore observations across all three sampling years.
Environmental covariates.
We merged spatial data from 2018 CRP enrollments (Farm Service Agency 2018), CropScape (CropScape 2018), and PRAIRIEMAP (PRAIRIEMAP 2003) to create a custom land cover raster (30 × 30 m) of our study area. We classified land cover from this raster into three classes: (1) CRP, (2) row-crop agriculture that reclassified all crop types, including fallow into a single value (CropScape 2018), and (3) native prairie that reclassified short (<60 cm), mixed (60–90 cm), and tallgrass prairie (>90 cm) into a single value (PRAIRIEMAP 2003). Loamy soil types provide important denning substrates for both prairie-obligate carnivores (Jackson and Choate 2000) and their prey (Desmond et al. 2000; Kretzer and Cully 2001); high loamy soil fertility (Ecosystem Dynamics Interpretive Tool 2021) may also increase prey demographic factors (e.g., eastern cottontail rabbit litter size; Hill 1972). To investigate soil effects on carnivore richness, we converted soil distribution polygons to raster format to characterize the spatial distribution of loamy tableland soil within our study area (30 × 30 m; Web Soil Survey 2018). We created 2-km radius circular buffers at a scale equivalent to previous studies in Kansas (Wait et al. 2018) and home-range size of the coyote, a regional apex carnivore (Kamler et al. 2005) surrounding each camera trap to extract land cover class proportions, land cover diversity, and edge (m) using the “landscapemetrics” package (Hesselbarth et al. 2019) in R (R Development Core Team 2022). We considered multiple alternative scales (1, 5, and 10 km), although each derived land cover variable was correlated among all scales. We extracted metrics from stream shapefile data (TIGER; U.S. Census Bureau 2018) using the “Euclidean Distance” and “Line Density” tools in ArcMap (v. 10.8) to create distance to streams and stream density (within 2 km) covariates. Black-tailed jackrabbits and eastern cottontail rabbits are important prey (Brillhart and Kaufman 1995; Kamler and Gipson 2000) that may influence carnivore richness. We quantified a relative index of prey abundance at each site using independent detections of eastern cottontail rabbit and black-tailed jackrabbit across our 3-year sampling effort. Photographs of lagomorphs were considered independent detections if >30 min (O’Brien et al. 2003; Burton et al. 2015) had passed before the successive photograph of the same species; we identified total independent observations of all lagomorphs at each site. To account for site-level sampling effort given that cameras were not consistently active throughout each 28-day sampling period, each year (3-year = 71 days, range = 27–84 days) we included a variable describing camera-trap sampling effort as total number of days that a camera was active.
Structural equation model.
We investigated how landscape composition and structure, water availability, and prey availability affected carnivore species richness using an SEM (Grace et al. 2010). Due to hypothesized landscape and biological complexity within our system, SEM allows us to test multiple pathways that may directly or indirectly affect carnivore community richness (Grace et al. 2010, 2012). SEM provides a framework in which multiple cause–effect hypotheses may be tested, allowing covariates to explain direct (i.e., explanatory variable [X] → response variable [Y]) and indirect effects (i.e., X → Y1 → Y2) within a network of interconnected variables that influence system processes (Grace et al. 2012). We included both observed (measured) and latent (hypothesized and unmeasured) variables to describe variation in carnivore richness (Grace et al. 2010). We followed the Grace and Irvine (2020) outline of explanatory modeling process within SEM, and constructed our hypothesized conceptual diagram (Fig. 1) from which we tested multiple causal pathways.
Within our SEM, we included the observed variable of loamy tableland soil to represent effects of soil characteristics on carnivore richness. We hypothesized that proportions of row-crop agriculture and total row-crop edge surrounding camera-trap sites would negatively affect proportions of native prairie surrounding sites, but have a positive effect on overall carnivore richness due to increased prey abundances (Spanel and Geluso 2018). We expected proportions of CRP land cover and total CRP edge surrounding camera-trap sites to have a positive effect on carnivore richness by providing secondary habitat for more generalist carnivore species of the region (Kamler et al. 2005). Due to the semiarid climate of the region, we expected water availability (e.g., stream density and proximity to streams) to positively influence carnivore richness. We also expected prey abundance (e.g., lagomorph observations) to be a positive driver of carnivore richness (Li et al. 2021). Because days that cameras were active increases opportunity to observe both prey and carnivore species, we expected this to have a positive effect on both lagomorph abundance and carnivore richness. We also expected land cover heterogeneity to have a positive effect on carnivore richness as informed by previous research (Manlick et al. 2020; Davies et al. 2021). Our latent variables included “Agriculture,” “CRP,” and “Water.” “Agriculture” was represented by the indicator variables “Row-crop Proportion” and “Row-crop Total Edge,” “CRP” was represented by the indicator variables “CRP Proportion” and “CRP Total Edge,” and “Water” was represented by the indicator variables “Stream Density” and “Distance to Streams.”
We specified direct pathways to carnivore richness from “Native Prairie,” “Agriculture,” “Land cover Heterogeneity,” “CRP,” and “Water” surrounding sites (1 km), as well as “Lagomorph” abundances and “Days Cameras were Active.” We also included multiple indirect pathways that were mediated through appropriate effects (Fig. 3). Covariance terms were added to the SEM to improve model fit and included “Row-crop Total Edge” covariance with “Land cover Heterogeneity,” “CRP Proportion,” “Loamy Tableland Soil,” “Native Prairie,” “Stream Density,” “CRP Total Edge” covariance with “Land cover Heterogeneity,” “Loamy Tableland Soil,” “Days Camera Active,” “Stream Density,” “Distance to Streams,” “Row-crop Proportion” covariance with “Row-crop Total Edge,” “Days Camera Active,” “Stream Density,” “CRP Proportion,” “Loamy Tableland Soil,” “Stream Density” covariance with Loamy Tableland Soil and Days Camera Active, and “Distance to Streams” covariance with “Richness.”
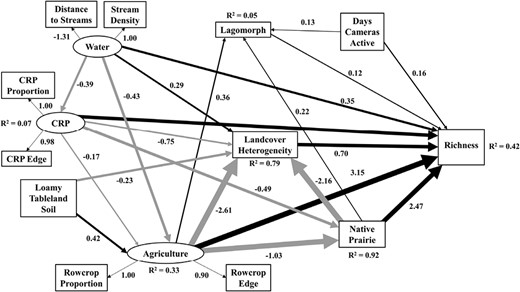
Structural equation model describing effects of loamy tableland soils, Conservation Reserve Program, water, agriculture, native prairie proportion, lagomorph total observations, land cover diversity, and days cameras were active on carnivore richness in western Kansas, United States. The model includes latent (ovals) and observed (rectangles) variables. Solid lines represent significant pathways at P < 0.05 (thicker lines and smaller P-values represent stronger effects), with gray lines representing negative relationships, and black representing positive relationships. Standardized coefficients are shown for significant pathways. R2 values represent the proportion of variance explained (for response variable; range = 0–1) by the combination of explanatory variables.
We fitted our SEM using the “lavaan” package (v. 0.6.9; Rosseel 2012) in R (R Development Core Team 2022). We scaled all observed variables with a standardized mean of zero before inclusion in the SEM to ensure all variances and regressions were similar in magnitude of influence. Following Kline’s (2018) recommendations, we assessed model fit with a chi-square global fit statistic (χ2) to determine significant difference (P > 0.05) between the baseline and hypothesized models.
A public repository of data and code used in these analyses is available at https://github.com/tywerdel/CarnivoreSEM.
Results
We collected 5,217,641 photos (2018 = 1,734,588; 2019 = 1,942,072; 2020 = 1,540,981) and documented seven species of native carnivores and two species of lagomorphs over 27,954 trap-days (2018 = 10,351; 2019 = 9,478; 2020 = 8,125). Pooled species-specific naïve site occupancy of carnivores varied (American Badger = 0.66, bobcat = 0.10, Coyote = 0.91, Long-tailed Weasel = 0.01, Raccoon = 0.61, Striped Skunk = 0.67, and Swift Fox = 0.14). Additionally, pooled naïve site occupancy (Black-tailed Jackrabbit = 0.45, Eastern Cottontail rabbit = 0.38) and number of independent observations (Black-tailed Jackrabbit = 1263, Eastern Cottontail rabbit = 1085) of lagomorphs varied (Table 2). Mean Chao2 estimates of carnivore richness at sites was 3.48 (range = 0–11) and variation in estimates was distributed throughout the study area (Fig. 4).
Naïve occupancy (number of sites occupied divided by total sites) results derived from camera-trap sites (2018 = 375, 2019 = 361, 2020 = 360) established to detect carnivore and lagomorph species in western Kansas, United States.
| Species | Naïve occupancy |
|---|---|
| Carnivora | |
| American Badger (Taxidea taxus) | 0.66 |
| Bobcat (Lynx rufus) | 0.10 |
| Coyote (Canis latrans) | 0.91 |
| Long-tailed Weasel (Mustela frenata) | 0.01 |
| Raccoon (Procyon lotor) | 0.61 |
| Striped Skunk (Mephitis mephitis) | 0.67 |
| Swift Fox (Vulpes velox) | 0.14 |
| Lagomorpha | |
| Black-tailed Jackrabbit (Lepus californicus) | 0.45 |
| Eastern Cottontail rabbit (Sylvilagus floridanus) | 0.38 |
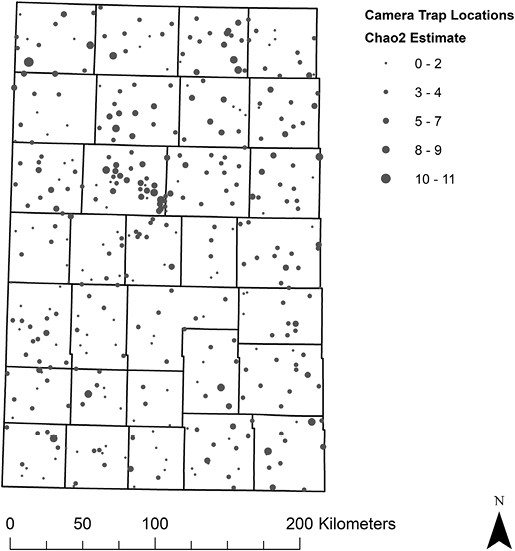
Distribution of Chao2 estimates throughout our study area in western Kansas, United States (KS; 71,600 km2) where we sampled camera-trap sites (2018 = 375, 2019 = 361, 2020 = 360) for carnivore community richness over 3 years (2018–2020). The Chao2 method is used for evaluating species richness, while accounting for rare species (Colwell and Coddington 1994).
Our SEM model explained 42% of the variance in carnivore expected richness (χ2 = 8.76, d.f. = 21, P = 0.99). Sampling effort (days camera active) had a direct positive effect on our measure of carnivore richness at sites, as well as our index of lagomorph abundances (Table 3; Fig. 3). The latent variable representing the amount of agriculture surrounding sites positively influenced carnivore richness (β = 3.15 ± 2.09; Table 3; Fig. 3), and also affected carnivore richness through multiple indirect pathways (Table 3; Fig. 3) as land cover diversity was lower at sites surrounded by more agriculture and native prairie proportion. The proportion of native prairie surrounding sites positively affected carnivore richness (β = 2.47 ± 1.68; Table 3; Fig. 3), though had a nonsignificant positive influence on our index of lagomorph abundances. Carnivore richness was positively influenced by the distribution and distance to water (β = 0.35 ± 0.30; Table 3; Fig. 3) indirectly through the amount of agriculture and land cover heterogeneity surrounding sites. Surprisingly, our index of lagomorph abundance (Fig. 4) had minimal influence on carnivore richness (β = 0.12 ± 0.10; Table 3; Fig. 3). The proportion of CRP land cover (β = 0.87 ± 0.67) and land cover diversity (β = 0.70 ± 0.56) surrounding sites both had significant positive direct effects on carnivore richness. The proportion of CRP land cover surrounding sites had significant negative influences on land cover diversity and proportion of prairie land cover. Loamy tableland soil affected carnivore richness through multiple indirect pathways, but had a direct positive relationship with agriculture and direct negative relationships with land cover heterogeneity and the proportion of remaining native prairie surrounding sites.
Standardized coefficients (std. coef.), 95% confidence intervals (CI), and P-values (P) for latent variables and structural equation model (SEM) regressions of carnivore richness in western Kansas, United States. Within an SEM, unobserved hypothetical constructs (latent variables) are summarized by one or more observed indicator variables. Indicator variables were derived from a 2-km buffer surrounding each site sampled using camera traps over 3 years (2018 = 375, 2019 = 361, 2020 = 360) in western Kansas, United States (7,160,077 ha). Source material for indicator variables can be found in Table 1. CRP = Conservation Reserve Program.
| Latent variable | Indicator | Std. coef. | ± 95% CI | P |
|---|---|---|---|---|
| Agriculture | ||||
| Row-crop Proportion | 1.00 | |||
| Row-crop Total Edge | 0.89 | 0.09 | <0.01 | |
| CRP | ||||
| CRP Proportion | 1.00 | |||
| CRP Total Edge | 0.98 | 0.12 | <0.01 | |
| Water | ||||
| Stream Density | 1.00 | |||
| Distance to Streams | −1.31 | 0.32 | <0.01 | |
| Response | Explanatory | Std. coef. | ± 95% CI | P |
| CRP | ||||
| Water | −0.39 | 0.18 | <0.01 | |
| Native prairie | ||||
| CRP | −0.49 | 0.05 | <0.01 | |
| Agriculture | −1.03 | 0.07 | <0.01 | |
| Land cover diversity | ||||
| Native Prairie | −2.16 | 0.54 | <0.01 | |
| CRP | −0.75 | 0.30 | <0.01 | |
| Agriculture | −2.61 | 0.62 | <0.01 | |
| Loamy Tableland Soil | −0.23 | 0.10 | <0.01 | |
| Water | 0.29 | 0.14 | <0.01 | |
| Agriculture | ||||
| Loamy Tableland Soil | 0.42 | 0.08 | <0.01 | |
| CRP | −0.17 | 0.10 | <0.01 | |
| Water | −0.43 | 0.15 | <0.01 | |
| Lagomorph | ||||
| Agriculture | 0.36 | 0.23 | <0.01 | |
| Days Camera Active | 0.13 | 0.10 | 0.01 | |
| Native Prairie | 0.22 | 0.20 | 0.03 | |
| Richness | ||||
| Agriculture | 3.15 | 2.09 | <0.01 | |
| Native Prairie | 2.47 | 1.68 | <0.01 | |
| Days Camera Active | 0.16 | 0.09 | <0.01 | |
| Water | 0.35 | 0.30 | 0.02 | |
| Lagomorph | 0.12 | 0.10 | 0.01 | |
| CRP | 0.87 | 0.67 | 0.01 | |
| Land cover Heterogeneity | 0.70 | 0.56 | 0.01 | |
Discussion
Our results suggest that carnivore communities in agro-prairie landscapes are structured through multiple landscape-scale pathways. As expected, greater proportions of native prairie, water availability, and prey abundance all positively influenced carnivore richness. Surprisingly, the amount of row-crop agriculture occurring on the landscape had a positive influence on carnivore richness. Distinct natural histories and habitat associations of carnivore species occurring in our system made it unlikely that a single factor could explain landscape complexities likely structuring carnivore communities. Our study, however, underscores the importance of both indirect and direct landscape-scale effects on carnivore communities in a rapidly changing landscape.
Our study area was historically comprised of native short and mixed-grass prairies (Küchler 1972), and native carnivore species have coevolved and adapted in this semiarid landscape. Thus, remaining native prairie likely represents good-quality habitat for specialist, prairie-adapted carnivores (e.g., swift fox; Ferreira et al. 2018; Werdel et al. 2022), and had a direct positive influence on overall carnivore richness. However, much like contemporary ecosystems worldwide, remnant native prairies are now included within a matrix dominated primarily by agricultural landscapes (Perfecto and Vandermeer 2008). Due to juxtaposition of native prairie patches within this human-modified matrix, patch-use dynamics, landscape heterogeneity, and other ecological processes have also likely been altered (Kupfer et al. 2006; Driscoll et al. 2013). We hypothesized that land cover heterogeneity would be important for carnivore richness due to spatial partitioning of coexisting species (Davies et al. 2021), but had only a weak positive effect on carnivore richness, likely due to the contemporary human-modified mosaic. These pressures are evident within our model as both CRP and agriculture have negative influences on native prairie, which in turn, indirectly affected carnivore richness. Synanthropic species were common in our carnivore community (e.g., Raccoon, Striped Skunk, Coyote) and most were likely insensitive or positively associated with these human-modified landscapes. Though overall carnivore richness may have been greater at sites surrounded by non-native land cover, these results may be complicated by greater occupancy of synanthropic species at these sites—increased occupancy by synanthropic species may offset the expected low occupancy of prairie-adapted species.
Despite agriculture having a positive influence on carnivore richness, it is important to curb enthusiasm for promoting prairie conversion to agricultural production—native habitats still provide the greatest quality in most instances and benefit biodiversity (e.g., pollinator, vegetation, rodent, and bird communities) outside of local carnivore communities. Additionally, agricultural expansion in prairie landscapes has resulted in some of the largest declines in species richness since Euro-American colonization of the Great Plains (Laliberte and Ripple 2004). It is clear that human disturbances of native landscapes can have rippling effects across mammal communities (e.g., Manlick and Pauli 2020; Tucker et al. 2021) and our results should not be used to promote such changes. Conversion of remaining prairie to agricultural production will likely result in greater abundances of synanthropic carnivores which could increase human–carnivore conflicts or interspecific competition (Manlick and Pauli 2020). Greater carnivore richness at sites with larger amounts of agriculture may also be partially explained by greater prey abundance in rodents, including Prairie Vole (Microtus ochrogaster), Western Harvest Mouse (Reithrodontomys megalotis), and Western Deermouse (Peromyscus sonoriensis) densities on agricultural peripheries (e.g., edges and road ditches; Spanel and Geluso 2018) as these areas are likely exploited by generalist carnivore species (Andrén 1994). Unfortunately, we could not estimate abundances of these smaller prey items with our data. Within our system, fertile loamy tableland soil types are primarily associated with agriculture, and the effects of both fertile soil (Hill 1972) and increased foraging along agricultural edges for small mammals (Bilenca et al. 2007) likely account for the positive influence of agriculture on lagomorph abundances. As expected, increased prey abundance drives carnivore occurrence (Rich et al. 2017), and an increase in our index of lagomorph abundance at sites also had a positive, though weak, influence on carnivore richness.
In semiarid environments, water availability likely affects the distribution of all flora and fauna including mammal communities (Schuette et al. 2013; Wait et al. 2020). Our model demonstrates that water availability near sites enhances carnivore richness, but also is associated with greater amounts of land cover heterogeneity surrounding sites. Water availability is an important factor affecting carnivore richness (Schuette et al. 2013), with carnivores dependent on water sources, as well as greater prey abundances in water-associated riparian areas (Matos et al. 2009). Semipermanent prairie water sources (e.g., creeks, ponds, and wetlands) are sensitive to future climate changes (Johnson and Poiani 2016) and their losses may result in sensitive species extirpation. Agricultural practices in the region also provide supplemental water resources (e.g., irrigation, cattle operations) that are likely used by carnivores. These water sources may partially explain positive associations between carnivore richness and agricultural production in our study area. These artificial water sources are not represented in spatial layers used for our analyses and could not be evaluated in our model. Future research should assess the importance of these water sources to carnivore communities in agro-prairie landscapes.
Our results provide the first evidence of how modified, contrasting landscapes affect a carnivore guild in a rapidly changing shortgrass prairie ecosystem. Contemporary agro-prairie mosaics may act as filters for the tolerance of carnivores to agriculture, with species more vulnerable to native prairie loss becoming locally extirpated (Gascon et al. 1999; Acosta-Jamett and Simonetti 2004; Henle et al. 2004; Ferreira et al. 2018). Our research has important management implications for the conservation of remaining carnivore species. For instance, our results illustrate that carnivore richness can increase in areas characterized by larger amounts of prairie land cover. Programs designed to conserve remaining prairie landscapes—or to offer financial incentives to halt agricultural production and restore native prairie land cover—may provide direct positive benefits to local carnivore communities. Historic landscape changes driven by agricultural production and human conflict have resulted in losses of larger carnivore species (e.g., wolves, brown bears) from prairie landscapes. Remaining carnivore communities are disproportionally occupied by species more adapted to human-dominated landscapes, although some prairie-obligate species remain. It is likely that landscape-scale conservation efforts focused on these species will benefit carnivore communities although human conflict in these areas will likely remain pervasive. As our results demonstrate, carnivore communities are structured by complicated relationships with landscape-scale drivers and single solutions to maintain carnivore diversity may not be realistic. Maximal carnivore richness may not be the ultimate objective for managers, as it only identifies a component within the larger ecological community, and management and conservation should consider holistic approaches to management actions that benefit a wide array of species (i.e., native land cover may provide greater quality habitats and overall biodiversity). Future conservation efforts will require collaborative work between social scientists, agricultural producers, ecologists, and others to formulate plans to maintain or increase carnivore diversity in rapidly changing landscapes.
Acknowledgments
Our work occurred on landscapes historically home to Native nations including the Kaw, Osage, and Pawnee, among others. Financial support was provided by the United States Fish and Wildlife Service through the Kansas Department of Wildlife and Parks (U.S. Federal Aid in Wildlife Restoration Fund—W-99R-1) and Kansas State University. We thank Kansas Department of Wildlife and Parks, The Nature Conservancy, and private landowners who provided support and property access. Without the cooperation of private landowners, this project would not have been possible. We thank W. Boomhower, T. Folk, M. Larreur, A. Lee, G. Long, C. Ties, K. Wait, and C. Werdel for their assistance with securing landowner permissions and data collection. We thank J. Gehrt, N. Parker, E. Teige, and B. Verheijen for comments on earlier drafts of the manuscript. We also thank Kansas Cooperative Fish and Wildlife Research Unit (United States Geological Survey) and D. Haukos for providing support. We thank R. Lopez and A. Lopez for English to Spanish translation of the abstract.
Conflict of Interest
The authors declare that they have no conflict of interest.
Author Contributions
TJW, AAA, AMR, and MSP conceived and designed the study; TJW and CWP conducted field data collection; TJW conducted data analyses; TJW wrote earlier versions of the manuscript and all authors (TJW, AAA, AMR, CWP, and MSP) contributed to the final manuscript.
Data Availability
A public repository of data and code used in these analyses is available at https://github.com/tywerdel/CarnivoreSEM.
Literature Cited
Author notes
Ty J. Werdel Present address: Department of Rangeland, Wildlife and Fisheries Management, Texas A&M University, College Station, Texas 77843, USA
Colleen W. Piper Present address: College of Forestry and Conservation, University of Montana, Missoula, Montana 59812, USA
