


Abstract
The efficacy of conventional treatments for pancreatic cancer remains unsatisfactory, and immunotherapy is an emerging option for adjuvant treatment of this highly deadly disorder. The tumor-associated antigen (TAA) MUC1 is expressed in a variety of human cancers and is overexpressed in more than 90% of pancreatic cancer, which makes it an attractive target for cancer immunotherapy. As a self-protein, MUC1 shows a low immunogenicity because of immune tolerance, and the most effective approach to breaking immune tolerance is alteration of the antigen structure. In this study, the altered MUC11068-1076Y1 epitope (YLQRDISEM) by modification of amino acid residues in sequences presented a higher immunogenicity and elicited more CTLs relative to the wild-type (WT) MUC11068-1076 epitope (ELQRDISEM). In addition, the altered MUC11068-1076Y1 epitope was found to cross-recognize pancreatic cancer cells expressing WT MUC1 peptides in an HLA-A0201-restricted manner and trigger stronger immune responses against pancreatic cancer via the perforin/granzyme apoptosis pathway. As a potential HLA-A0201-restricted CTL epitope, the altered MUC11068-1076Y1 epitope is considered as a promising target for immunotherapy of pancreatic cancer. Alteration of epitope residues may be feasible to solve the problem of the low immunogenicity of TAA and break immune tolerance to induce immune responses against human cancers.
INTRODUCTION
Pancreatic cancer is a highly malignant tumor in the digestive system with a poor prognosis.1 Globally, there were 495,773 new cases diagnosed with pancreatic cancer in 2020, and this malignancy became the seventh leading cause of cancer-related mortality.2 More importantly, epidemiologic data have shown that the incidence and mortality of pancreatic cancer have substantially increased worldwide, and the incidence is increasing in young invididuals.3 It was estimated that pancreatic cancer would be the second leading cause of cancer-associated mortality in the world in 2030.4 The 5-year overall survival (OS) rate of pancreatic cancer is the lowest among all cancers.5 Only 15–20% of all patients with pancreatic cancer have a chance of surgical treatment upon definitive diagnosis because of the specific anatomy and highly aggressive biologic behaviors,1 and the 5-year survival rate remains less than 25% among patients receiving early definitive diagnosis and standard therapy.6 As an emerging cancer treatment, immunotherapy has shown a satisfactory efficacy in several malignancies,7,8 which has potential to become a novel potent treatment for pancreatic cancer.9
Currently, there are 2 main delivery strategies of immunotherapy, removal of inhibition of tumor microenvironments on immune cells and activation of host immune responses.10 Immune checkpoint inhibitors targeting programmed death-1 (PD-1) and programmed death-ligand 1 (PD-L1) and chimeric antigens receptor-T (CAR-T) cells have shown potential in treatment of multiple solid tumors11,12; unfortunately, monotherapy with anti-PD-1 or anti-CTLA-4 antibody is ineffective for the treatment of pancreatic cancer.13,14 Since there are a large number of tight matrix components in pancreatic cancer tissues, CAR-T cells are difficulty to infiltrate into tumors to induce immune responses against pancreatic cancer.15 Due to strong specificity, high safety and low cost, CTL immunotherapy has provided an important advance in clinical trials.16 At the same time, high-density CD8+ T cells infiltration is related to the survival rate of pancreatic cancer, which has become a hot topic of research in adoptive cellular immunotherapy, and the key lies in the selection of tumor antigen including tumor-associated antigen (TAA). TAA refers to the molecules expressed in various tumor cells or normal cells, but it varies a lot depending on the cells proliferation. It is overexpressed in abnormally proliferating tumor cells, while only in trace amounts in normal cells. Some TAAs such as embryonic protein, glycoprotein antigen, and squamous cell antigen can be used as biomarkers for tumor diagnosis. Meanwhile, TAAs could be used as the targets of immunotherapy to cancer. Based on the predefined criteria of therapeutic function, immunogenicity, role of the antigen in oncogenicity, specificity, expression level and percent of antigen-positive cells, stem cell expression, number of patients with antigen-positive cancers, number of antigenic epitopes, and cellular location of antigen expression, 75 representative cancer vaccine target antigens were selected by the National Cancer Institute to test their translational values, and MUC1, a mucin family protein, was considered as a good candidate for immunotherapy.17 MUC1, the first identified member of the mucin protein family, is a highly glycosylated transmembrane protein that is expressed in epithelial cells of multiple tissues and organs, which has a polar distribution and provides a protective barrier.18 In cancer cells, MUC1 is characterized by high expression, low-level glycosylation, and loss of polar distribution.19 As a cancer driver gene, MUC1 increases cancer invasion, metastasis, and drug resistance through mediating cancer cell proliferation,20,21 epithelial–mesenchymal transition (EMT),22 and epigenetic alterations,23,24 and promotes immune escape through its interactions with immune cells in tumor environments.25 More importantly, MUC1 is overexpressed in 90% of pancreatic cancer patients, and overexpression of MUC1 was reported to predict a poor prognosis in patients with pancreatic cancer.26 MUC1 is therefore accepted as a promising target for immunotherapy of pancreatic cancer.27
Because of thymic negative selection, the high-affinity self- antigen-specific TCR spectrum to TAA is eliminated during the period of T-cell development, resulting in immune tolerance,28 and the number of TAA-specific T cells in peripheral blood directly determines host responses to self-proteins, thereby affecting host responses against cancers.29 The strategy to bypass central immune tolerance is therefore a high difficulty in the research of TAA applications. Currently, the most effective strategy to break immune tolerance is alteration of the molecular structure of tolerant antigens, in which residual replacement may be a feasible approach.30 Previous studies have shown that the altered epitope has an increased binding-affinity and reduced dissociation rate to MHC molecules, and induces stronger epitope-specific CTLs responses relative to wild-type (WT) epitopes.31,32 The P1Y variants, generated by introducing a tyrosine to the first position (P1Y) in the sequences of the low-affinity human leukocyte antigen (HLA)-A2.1-binding peptides, exhibited a much higher binding affinity to HLA-A2.1 than WT peptides, and their generating CTLs were found to cross-recognize naturally processed epitopes and retain their antigenicity.33 In addition, amino acid substitutions at positions 1 (with tyrosine), 3 (with phenylalanine), and 9 (with valine) in the sequence of the cancer antigen POTE protein resulted in a higher binding affinity to HLA-A2, and induced CTL responses cross-reactive with WT antigens.34
In our previous study, we screened the low-affinity epitopes using online tool SYFPEITHI in MUC1 without glycosylation sites and altered the residues of MHC binding epitopes, excluded the modified epitopes with the same sequence as the normally expressed proteins in the human body by BLAST alignment, and then characterized altered MUC1 peptides MUC11081-1089L2, MUC11156-1164L2, and MUC11068-1076Y1 as potential HLA-A0201-restricted CTL epitopes against gastric cancer cells, and MUC11068-1076Y1-specific CTLs were found to elicit the strongest cytotoxicity to gastric cancer cells.35 In this study, we tested the in vitro and in vivo activity of MUC11068-1076Y1-specific CTLs against pancreatic cancer cells and explored its applicability in refractory pancreatic cancer.
METHODS
Cell lines and culture
Human pancreatic cancer cell lines PANC-1 and BxPC-3 purchased from the Cell Bank of Chinese Academy of Sciences (Shanghai, China). A2-BxPC-3 cells (BxPC-3 cells stably expressing HLA-A0201) and transporter associated with antigen processing (TAP)-deficient lymphoblastoma T2 cells were maintained in our laboratory. All cell lines were incubated in RPMI 1640 medium or DMEM supplemented with 10% FBS (PAN-Seratech GmbH, Aidenbach, Germany) and 1% penicillin/streptomycin (MP Biomedicals, Santa Ana, CA, USA).
Animals
NOD/SCID mice at ages of 4–5 weeks were purchased from Guangdong Yaokang Biotechnology Co., Ltd. (Foshan, China). All mice were housed in SPF-grade facilities at Center for Laboratory Animals of Fujian Medical University (Fuzhou, China), and were given free access to food and water.
Effect of MUC1 gene expression on pancreatic cancer progression
MUC1 gene expression was compared in pancreatic cancer specimens using the Gene Expression Profiling Interactive Analysis (GEPIA) server (http://gepia.cancer-pku.cn/index.html), and the correlation between MUC1 gene expression and prognosis was examined in patients with pancreatic cancer using the online database Kaplan–Meier Plotter (https://kmplot.com/analysis/), while the effect of MUC1 gene expression on immune infiltration was evaluated in patients with pancreatic cancer using the TIMER sever (http://timer.comp-genomics.org).
Prediction and synthesis of MUC1 peptides
Our previous study showed that alteration of the MUC1 WT epitope with the position 1 (P1) residue of MUC11068-1076 replaced by Y (tyrosine) induced more efficient antitumor effects against gastric cancer than the WT epitope.35 The binding affinity, immunogenicity, and hydrophobicity of the MUC1 WT epitope (ELQRDISEM) and altered MUC1 epitope (YLQRDISEM) were predicted using online tools SYFPEITHI (http://www.syfpeithi.de/), IEDB (http://www.iedb.org/), and NetMHCpan4.1 (http://www.cbs.dtu.dk/services/NetMHCpan/). All peptides were synthesized by GenScript (Piscataway, NJ, USA), with a purity of >98% as revealed by HPLC. The binding affinity and stability of epitopes were measured using TAP-deficient T2 cells. All epitopes are described in Table S1.
Measurement of peptide affinities and stabilities
To measure the binding affinity of MUC1 peptides to the HLA-A0201 molecule, T2 cells were seeded onto a 24-well plate (Corning, Inc., Corning, NY, USA) at a density of 1 × 10⁶ cells/well. Cells were incubated in serum-free RPMI 1640 medium (Invitrogen, Carlsbad, CA, USA) containing 50 μg/ml epitope and 3 μg/ml beta-2-microglobulin (β2M; Merck, Kenilworth, NJ, USA) at 37°C containing 5% CO2 for 18 h. A peptide-free well was used as control. Then, cells were harvested, washed in PBS, and incubated with mouse anti-human HLA-A2 monoclonal antibody conjugated to FITC (BD Biosciences, San Jose, CA, USA) for 30 min. The fluorescence intensity of HLA-A0201 molecules was detected on T2 cell surface with a FACS Canto II flow cytometer system (BD Biosciences). The fluorescence index (FI) was calculated using the following formula: fluorescence intensity = [mean fluorescence index (MFI) of the epitope group − MFI of the control group]/MFI of the control group. An FI of >1.5 was considered a high binding affinity, and an FI of 1.0 and greater but 1.5 and lower considered a moderate affinity, while an FI of <1.0 was considered a low affinity.36
To measure the binding stability, epitope-loaded T2 cells were incubated in serum-free RPMI 1640 medium containing 50 μg/ml epitope and 3 μg/ml β2M at 37°C containing 5% CO2 for 18 h. A peptide-free well was used as control. Then, cells were harvested, washed in PBS, and treated with 5 μg/ml brefeldin A (Abcam, Cambridge, MA, USA) in fresh RPMI 1640 medium for 1 h. Cells were then washed in PBS, and incubated at 37°C for 0, 4, 8, and 12 h. Following washing in PBS, cells were incubated with FITC-conjugated mouse anti-human HLA-A2 monoclonal antibody for 30 min and subjected to flow cytometric analysis. The stability of peptide binding to the HLA-A2 molecule was expressed as DC50, which was defined as the time required for 50% dissociation of the peptide–MHC (pMHC) complex stabilized at the time of 0 h, and a DC50 of >2 h was considered as a good stability.33
Induction of MUC1 epitope-specific CTLs
Peripheral blood samples were collected from healthy HLA-A0201+ volunteer donors, and PBMCs were isolated using the Ficoll density gradient centrifugation method.37 PBMCs were seeded onto 6-well plates (Thermo Fisher Scientific) and incubated in serum-free KMB-581 medium (Corning, Inc.) for 2 h. After 2 h of incubation at 37°C, nonadherent cells (PBLs) were gently removed and cryopreserved at −80°C until further use. Then, adherent cells were incubated with 100 ng/ml recombinant human GM-CSF (MiltenyiBiotec GmbH, BergischGladbach, Germany) and 50 ng/ml recombinant human IL-4 to generate dendritic cells (DCs). Once monocyte-derived DCs were activated by GM-CSF and IL-4, the DCs were sensitized with 10 μg/ml MUC1 epitope, which were induced for maturation with 10 ng/ml recombinant humanIL-6 (MiltenyiBiotecGmbH), 10 ng/ml recombinant human IL-1β (MiltenyiBiotecGmbH), 1 μg/ml recombinant human CD40L (MiltenyiBiotecGmbH), and 10 ng/ml recombinant human TNF-α (MitenyiBiotecGmbH) after 24 h. A well without peptide served as the blank control. After 24 h, PBLs from the same donor were thawed in advanced and then were cocultured with matured epitope-sensitized DCs at a ratio of 10:1 in KMB-581 medium supplemented with 200 IU/ml recombinant human IL-2 (MiltenyiBiotecGmbH) and 10 ng/ml recombinant human IL-7 (MiltenyiBiotecGmbH). The culture medium was changed every 3 days with half being removed and replaced with KMB-581 medium containing IL-2 and IL-7. PBLs were restimulated with freshly peptide-pulsed DCs every 7 days. Following twice stimulations and 14-day incubation, MUC1 epitope-specific T cells were generated and harvested for further functional experiments.
Detection of cell surface markers expression
To measure the expression of T-cell surface markers, pancreatic cancer cell lines at a density of 1 × 10⁶ cells/well were stained with FITC-conjugated mouse anti-human HLA-A2 monoclonal antibody or PE-conjugated anti-MUC1 antibody in darkness. The HLA-A2 and MUC1 expression was detected on pancreatic cell surface with a FACS Canto II flow cytometer system.
MUC1 epitope-specific T cells were washed in PBS, and incubated with antibodies specific to CD25, CD69, CD28, 4-1BB (CD137), CTLA-4, and PD-1 in darkness. Then, the expression of CD25, CD69, CD28, 4-1BB (CD137), CTLA-4, and PD-1 was detected on CD8+ T cell surface with a FACS Canto II flow cytometer system before and after the alteration of the MUC1 epitope. All flow cytometric analyses were performed using the software FlowJo version 7.6 (FlowJo, LLC, Ashland, OR, USA).
ELISA
The IFN-γ secretion was measured in the culture supernatant 3 days after the second stimulation with MUC1 epitope-loaded DCs (10 days after the coculture) using a commercial ELISA kit (Invitrogen; Thermo Fisher, MD, USA) to examine the effects of MUC1 epitope alteration on T cell activation. In addition, MUC1 epitope-specific CTLs (effector cells) were cocultured with PANC-1 cells (target cells) at an effector (E) to target (T) ratio of 10:1 for 24 h. Then, the IFN-γ, TNF-α (Invitrogen), perforin, and granzyme B (Mabtech AB; Mabtech, Stockholm, Sweden) secretions were measured in the culture supernatant using ELISA.
ELISpot assay
MUC1 epitope-specific CTLs (effector cells) were cocultured with PANC-1 cells (target cells) at an E/T ratio of 5:1 in recombinant anti-human IFN-γ antibody-precoated 96-well plates at 37°C for 24 h. Then, the number of IFN-γ spot-forming cells was measured in the effector/target cells coculture using the ELISpot assay kit (Dakewe Biotech Co., Ltd., Shenzhen, China) according to the manufacturer's instructions.
Lactate dehydrogenase-release assay
The PANC-1 and A2-BxPC-3 target cells were cocultured with MUC1 epitope-specific CTLs (effector cells) at E/T ratios of 20:1, 10:1, and 5:1 in 96-well plates at 37°C for 6 h, while BxPC-3 target cells served as controls. The lactate dehydrogenase (LDH) activity was measured in the coculture supernatant using the CytoTox 96® Non-Radioactive Cytotoxicity Assay (Promega, Madison, WI, USA). The proportion of cytotoxic cells was estimated using the following formula: proportion of cytotoxic cells (%) = (experimental LDH release − target spontaneous release − effector spontaneous release)/(target maximum release − target spontaneous release) × 100%.
Xenograft tumor growth assay
A2-BxPC-3 cells (200 μl) were subcutaneously injected into both sides of the NOD–SCID mouse back at a density of 2 × 10⁶ cells in each site. If the tumor size grew to 0.5‒4 mm3, mice were randomly assigned to the PBS, Control, MUC11068-1076, and MUC11068-1076Y1 groups, of 3 animals in each group. Then, PBS (200 μl) or MUC1 epitope-specific CTLs at a density of 4 × 10⁶ cells per site (200 μl) was injected into peri-tumor regions, and the tumor growth was recorded. If the tumor volume grew to approximately 1000 mm3 in the PBS group, mice were euthanatized by intraperitoneal injection with 2% pentobarbital at a dose of 100 mg/kg. The xenograft tumors were resected, measured and weighed. Paraffin-embedded section of tumor tissues was prepared for IHC and stained with anti-CD8-α antibody. The tumor volume was calculated using the formula: tumor volume (mm3) = a × b2/2, where a indicates the tumor length and b is the tumor width.
Ethical consideration
This study was approved by the Ethics Review Committee of Fujian Cancer Hospital (approval no.: K2020-026-01) and the Ethics Review Committee of Fujian Medical University (approval no.: FJMU IACUC 2021-0469). All experimental procedures relating to humans and animals were performed in accordance with the Declaration of Helsinki, Biosecurity Law of the People's Republic of China and other international and national laws, regulations and guidelines relating to human and animal studies.
Statistic analysis
All measurement data were expressed as mean ± s.d., and all categorical data were described as proportions. Differences of means among groups were tested for statistical significance with ANOVA, and comparisons of proportions were done with chi-square test. The correlation between MUC1 gene expression and prognosis was examined in patients with pancreatic cancer using the Cox proportional hazards regression and by plotting Kaplan–Meier survival plots, while the relationship between MUC1 gene expression and infiltration level of immune cells was detected using the Spearman correlation analysis. All statistical analyses were performed using the software GraphPad Prism 5 (GraphPad Software, La Jolla, CA, USA), and a p value of <0.05 was considered statistically significant.
RESULTS
MUC1 overexpression predicts a poor prognosis in pancreatic cancer
We utilized The Cancer Genome Atlas (TCGA) database to compare MUC1 expression in pancreatic cancer and normal tissues via the GEPIA database, and identified higher MUC1 expression in pancreatic cancer tissues than in normal tissues (p < 0.05) (Figure 1A). Kaplan–Meier survival analysis revealed a higher 5-year OS rate in pancreatic cancer patients with low MUC1 expression than in those with MUC1 overexpression [hazard ratio (HR) = 2.48] (Figure 1B). In addition, MUC1 expression was found to negatively correlate with the infiltration level of immune cells in pancreatic cancer (Rho = −0.28) when the given gene expression was negatively correlated with tumor purity, which was a major confounding factor in this analysis38 (Figure 1C). Therefore, MUC1 is a potential immunotherapy target for pancreatic cancer.
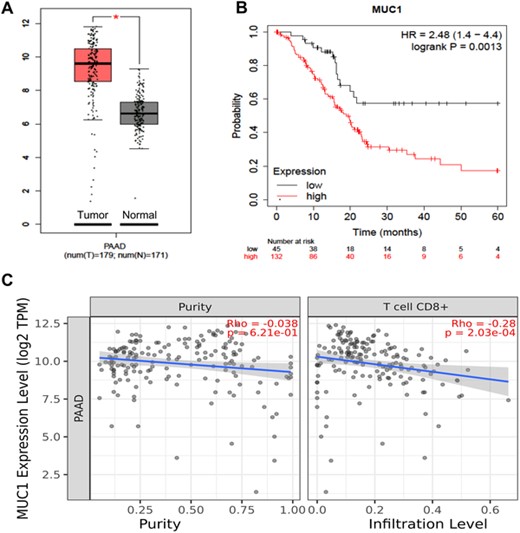
Expression of tumor-associated antigen (TAA) MUC1 in pancreatic cancer tissues and its association with prognosis in patients with pancreatic cancer. (A) Comparison of MUC1 expression in pancreatic cancer (red) and normal tissues (gray) via the GEPIA database; (B) association of MUC1 expression with prognosis in pancreatic cancer patients using the Kaplan–Meier Plotter database; (C) association of MUC1 expression with tumor purity (left) and with the infiltration level of CD8+ T cells (right) in pancreatic cancer using the TIMER database. *p < 0.05, **p < 0.01, ***p < 0.001.
Altered MUC1 epitope promotes T-cell activation and proliferation
Then, we predicted the affinity of binding to MHC I molecules, immunogenicity and hydrophobicity of the MUC1 WT epitope and altered MUC1 epitope (Table S1). T2-cell binding assay verified that the altered MUC1 epitope MUC11068-1076Y1 (YLQRDISEM) presented a higher binding affinity and stability than the MUC1 WT epitope MUC11068-1076 (ELQRDISEM) (Figure S1), which was in agreement with the prediction. To examine the effects of MUC1 epitopes on T-cell activation and proliferation, ELISA was performed to measure the IFN-γ level in the coculture supernatant of DCs loaded with MUC1 epitopes and T cells, and the IFN-γ level was significantly higher in altered MUC1 epitope-specific CTLs than in MUC1 WT epitope-specific CTLs (p < 0.001) (Figure 2A).
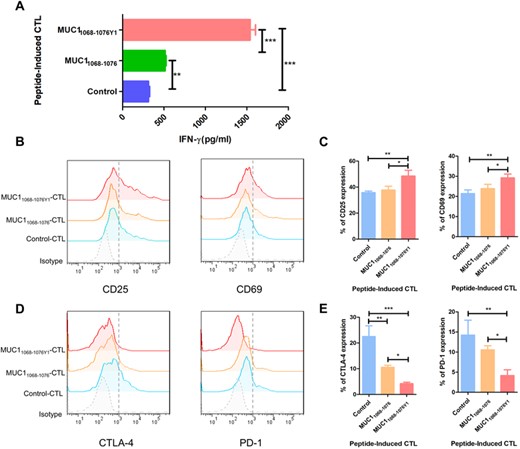
Effect of MUC1 epitopes on T-cell activation and proliferation. Dendritic cells loaded with various MUC1 epitopes are cocultured with PBLs at a ratio of 1:10 in the presence of IL-2 and IL-7, and then PBLs are restimulated with freshly peptide-pulsed DCs every 7 days. Following twice stimulations and 14-day incubation to generate MUC1 epitope-specific CTLs. (A) ELISA measures IFN-γ concentration in the supernatant 3 days after the second coculture; (B)–(E) expression of T-cell activation markers and exhaustion markers in MUC1 epitope-specific CTLs stained with specific antibodies against FITC-CD25, PE-CD69, PE-CTLA-4, and APC-PD-1; (B) representative flow cytometric plot of CD25 and CD69 expression in CTLs; (C) statistical comparison of CD25 and CD69 expression in CTLs. The horizontal coordinate indicates CTLs groups, and the vertical coordinate indicates the expression of activation markers; (D) representative flow cytometric plot of CTLA-4 and PD-1 expression in CTLs; (E) statistical comparison of CTLA-4 and PD-1 expression in CTLs. The horizontal coordinate indicates CTLs groups, and the vertical coordinate indicates the expression of exhaustion markers. B and D are representative of 3 independent experiments. In A, C, and E, data are expressed as mean ± s.d. from 3 independent experiments. *p < 0.05, **p < 0.01, ***p < 0.001.
Next, we detected the expression of activation markers CD69 and CD25 and T-cell exhaustion markers PD-1 and CTLA-4 in MUC1 epitope-specific CTLs. Higher CD69 and CD25 expression was detected in MUC11068-1076Y1-specific CTLs than in MUC11068-1076-specific CTLs (p < 0.05) (Figures 2B and C), and lower CTLA-4 and PD-1 expression was seen in MUC11068-1076Y1-specific CTLs than in MUC11068-1076-specific CTLs (p < 0.05) (Figures 2D and E). Our data demonstrate that high-affinity epitopes generated by modifying low-affinity epitopes with amino acid residues have a higher immunogenicity and induce the activation and proliferation of more MUC1 epitope-specific T cells to elicit stronger immune responses.
In vitro cytotoxicity of MUC1 epitope-specific CTLs to pancreatic cancer cells
Flow cytometry detected HLA-A2+ and high MUC1 expression in PANC-1 cells, HLA-A2− and high MUC1 expression in BxPC-3 cells, and HLA-A2+ in A2-BxPC-3 cells expressing HLA-A0201 gene (Figures 3A and B). Therefore, we selected PANC-1 and A2-BxPC-3 cells as target cells and HLA-A2-negative BxPC-3 cells as controls. HLA-A2 expression was positive in healthy donors, which met the requirements of HLA typing in our study (Figure 3C).
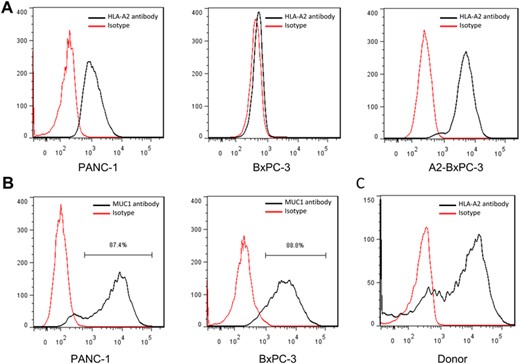
MUC1 and HLA-A2 molecule expression in pancreatic cancer cell lines. (A) HLA-A2 molecule expression in pancreatic cancer cell lines; (B) MUC1 expression in pancreatic cancer cell lines; (C) HLA-A2 molecule expression in PBMCs from health volunteers. A and B are representative of 3 independent experiments.
To test the cytotoxicity of MUC1 epitope-specific CTLs against pancreatic cancer cell lines expressing endogenous MUC1 gene, MUC1 epitope-specific CD8+ T cells (effector cells) were cocultured with PANC-1, BxPC-3, and A2-BxPC-3 cells (target cells) at E/T ratios of 20:1, 10:1, and 5:1, and the LDH secretion was measured in the coculture supernatant. The altered MUC1 epitope-specific CTLs showed a strong cytotoxicity against HLA-A2+ pancreatic cancer cell lines with high MUC1 expression at E/T ratios of 20:1 and 10:1, while MUC1 epitopes-specific CTLs showed a comparable cytotoxicity against BxPC-3 cells at E/T ratios of 20:1, 10:1, and 5:1 (Figure 4A). Our findings demonstrate that the cytotoxicity of MUC1 epitope-specific CTLs against target cells is dependent on HLA-A0201 expression, and altered MUC1 epitope-specific CTLs may cross-recognize the low-affinity MUC1 WT epitope.
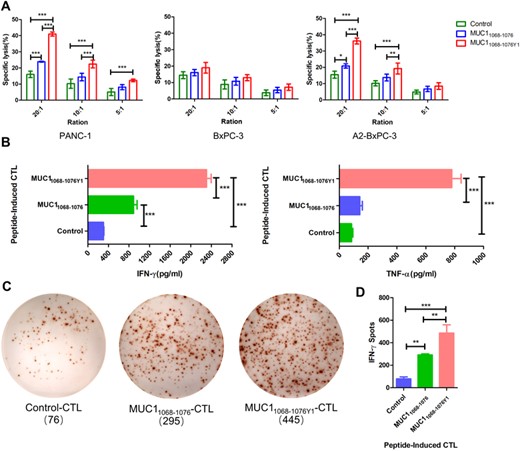
Cytotoxicity of MUC1 epitope-specific CTLs against pancreatic cancer cell lines. (A) MUC1 epitope-specific CTLs (effector cells) are cocultured with PANC-1, BxPC-3, and A2-BxPC-3 cells (target cells) at effector/target (E/T) ratios of 20:1, 10:1, and 5:1, and the lactate dehydrogenase (LDH) release is measured in the coculture supernatant; (B) MUC1 epitope-specific CTLs (effector cells) are cocultured with PANC-1 cells (target cells) at an E/T ratio of 10:1, and the IFN-γ and TNF-α levels are measured in the coculture supernatant using ELISA; (C) and (D) MUC1 epitope-specific CTLs (effector cells) are cocultured with PANC-1 cells (target cells) at an E/T ratio of 5:1, and the number of IFN-γ spot-forming cells is measured in the coculture supernatant using the ELISpot assay; (C) representative plots of IFN-γ spot-forming cells; (D) statistical comparison of the number of IFN-γ spot-forming cells among groups. C is representative of 3 independent experiments. In A, B, and D, data are expressed as mean ± s.d. from 3 independent experiments. *p < 0.05, **p < 0.01, ***p < 0.001.
Next, MUC1 WT epitope- and altered MUC1 epitope-specific CTLs were cocultured with the target PANC-1 cells at an E/T ratio of 10:1, and IFN-γ and TNF-α levels were measured in the coculture supernatant. ELISA detected higher IFN-γ and TNF-α levels in the supernatant of the MUC11068-1076Y1-specific CTLs and PANC-1 cells coculture than in the supernatant of the MUC11068-1076-specific CTLs and PANC-1 cells coculture (Figure 4B). In addition, ELISpot assay showed a higher number of IFN-γ spot-forming cells in the coculture of MUC11068-1076Y1-specific CTLs and PANC-1 cells than in the coculture of MUC11068-1076-specific CTLs and PANC-1 cells (Figures 4C and D). Collectively, our data demonstrate that the altered MUC1 epitope-specific CTLs recognize pancreatic cancer cells expressing MUC1 WT epitope in a HLA-A0201-restricted manner, and elicit a stronger cytotoxicity against pancreatic cancer cell lines than the MUC1 WT epitope.
MUC1 epitopes-specific CD8+ T cells present diverse functions
To further compare the functions of CTLs elicited by MUC1 WT epitopes and altered MUC1 epitopes, the secretion of cytokines was detected in the coculture supernatant of PANC-1 cells and MUC1 epitopes-specific CTLs. ELISA measured higher perforin and granzyme B levels in the coculture supernatant of PANC-1 cells and altered MUC1 epitope-specific CTLs than in that of PANC-1 cells and MUC1 WT epitope-specific CTLs, which induced PANC-1 cell cytolysis (Figure 5A), and flow cytometry detected higher CD28 and 4-1BB expression in the altered MUC1 epitope-specific CTLs than in that of MUC1 WT epitope-specific CTLs (Figures 5B and C). These data demonstrate that costimulatory molecules CD28 and 4-1BB promote altered MUC1 epitope-specific CTLs immune responses and interact with perforin and granzyme B to induce immune responses against pancreatic cancer.
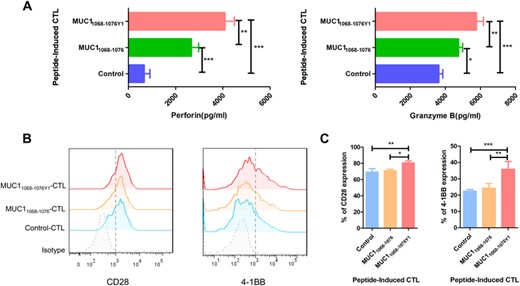
MUC1 epitope-specific CTLs exhibit diverse functions. (A) MUC1 epitope-specific CTLs (effector cells) are cocultured with PANC-1 cells (target cells) at an E/T ratio of 10:1, and the perforin/granzyme B secretion are measured in the coculture supernatant using ELISA; (B) and (C) activated CTLs are stained with specific antibodies against PE-CD28 and PE-4-1BB, and the expression of costimulatory molecules is detected in CTLs; (B) representative flow cytometric plots of CD28 and 4-1BB expression in CTLs; (C) statistical comparison of CD28 and 4-1BB expression in CTLs. The horizontal coordinate indicates CTLs groups, and the vertical coordinate indicates the expression of costimulatory molecules. B is representative of 3 independent experiments. In A and C, data are expressed as mean ± s.d. from 3 independent experiments. *p < 0.05, **p < 0.01, ***p < 0.001.
MUC1 epitope-specific CTLs suppress pancreatic cancer cell growth in vivo
Our in vitro assay showed that the altered MUC1 epitope had a stronger immunogenicity and induced a stronger cytotoxicity against pancreatic cancer cell lines. Then, we modeled subcutaneous xenograft tumors in NOD/SCID mice to examine the in vivo activity of CTLs elicited by MUC1 WT epitope and altered MUC1 epitope against pancreatic cancer cell lines. Peri-tumor injection of CTLs was given, and the long and short diameters of the tumor were measured once every 4 days (Figures 6A and B). If the tumor volume grew to approximately 1000 mm3 in the PBS group, mice were euthanatized and the tumor specimens were rapidly resected. The gross xenograft tumors appeared hard in texture, and the section appeared grayish white. Lower xenograft tumor volumes and weights were seen in the MUC11068-1076Y1 group than in the MUC11068-1076 group (Figures 6C and D), and the growth of xenograft tumors was remarkably suppressed in the MUC11068-1076Y1 group relative to the PBS, Control, and MUC11068-1076 groups. Histologic examination showed that infiltration of CD8+ T cells in the transplanted tumor tissues was significantly increased after peri-tumor injection of MUC11068-1076Y1-CTLs compared with that of Control-CTLs and MUC11068-1076-CTLs (Figure 6E). These data demonstrate that MUC11068-1076Y1-specific CTLs present higher inhibition on pancreatic cancer cell growth in vivo relative to MUC11068-1076, which is consistent with the in vitro assay.
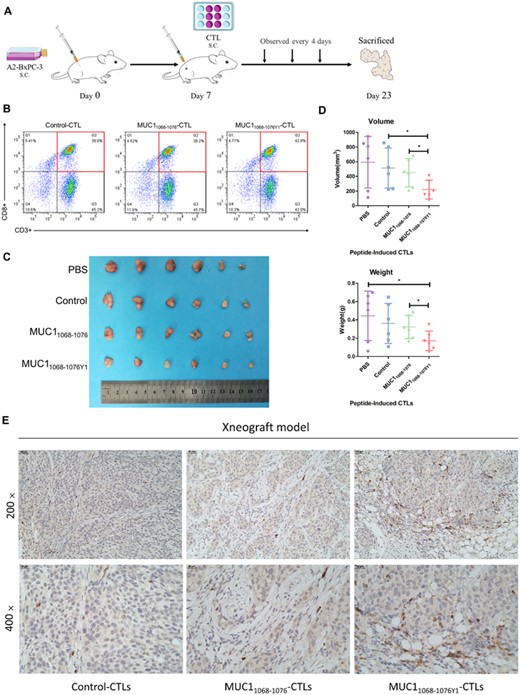
MUC1 epitope-specific CTLs suppress pancreatic cancer cell growth in vivo. The xenograft tumor model is established in NOD/SCID mice at ages of 4–5 weeks. If the tumor size grows to 0.5‒4 mm3, CTLs are injected into peri-tumor regions at an E/T ratio of 2:1, and the tumor growth is recorded once every 4 days. If the tumor volume grows to approximately 1000 mm3 in the PBS group, mice are euthanatized. The xenograft tumors are resected, measured, and weighed. The tumor volume is calculated using the formula: tumor volume (mm3) = a × b2/2, where a indicates the tumor length and b is the tumor width. (A) The protocol for assessment of the CTLs treatment regimens in a xenograft tumor model; (B) MUC1 epitope-specific T cells were analyzed by flow cytometry (FACS) in terms of the purity of those CTLs; (C) comparison of xenograft tumor sizes among groups; (D) statistical comparison of volumes and wet weights of xenograft tumors. The horizontal coordinate indicates CTLs groups, and the vertical coordinate indicates the volumes and wet weights of xenograft tumors. (E) Representative immunohistochemical staining of CD8 in subcutaneously transplanted tumor tissues. Scale bars, 40 μm (top) and 20 μm (bottom). The figure shows the data of a representative experiment. The tumor volume and weight are expressed as mean ± s.d. from mice in each group (n = 3). *p < 0.05, **p < 0.01, ***p < 0.001.
DISCUSSION
As an “immunologically cold” tumor, pancreatic cancer is characterized by low immune score and infiltration of few immune cells, and its mortality and extremely poor prognosis are strongly associated with the immune microenvironments and immunogenicity.39 MUC1 overexpression is strongly correlated with pancreatic cancer development and progression, and MUC1 may affect immune cell infiltration through its interaction with immune cells in tumor microenvironments, thereby promoting tumor immune escape.40 As an immunotherapy target, MUC1 may reduce the immune injury of T cells to normal tissues and effectively avoid the side effects of immunotherapy because of its low-abundance expression in normal tissues.19 MUC1 is therefore accepted as a promising target for cancer immunotherapy.41 Previous clinical studies have shown that MUC1 peptide are effective to induce the production of more specific antibodies against MUC1, with a few CD8+ T cell responses seen.42,43
More and more passive T-cell mediated immunotherapy based on peptide-epitope have shown effective in vitro assays; however, it has not worked well in clinical trials.44 To date, there have been no MUC1 epitope approved for phase III clinical trials. There are still multiple problems that remain to be solved in cancer immunology, such as the selection of high-immunogenicity targets,45 and alteration of the immunosuppressive state in tumor microenvironments. T-cell activation is a critical procedure in targeting and reinstating immune system of patients to against tumors; however, the CTL epitope that binds to the MHC molecules, but not the entire tumor antigen molecule, triggers CTLs responses against cancers.46 Therefore, the selection of epitopes is critical to immunotherapy.46 Tumor antigen is classified into TAA and tumor-specific antigen. Neoantigen, a type of tumor-specific antigen, is the product of gene mutations in tumor cells, and is therefore not affected by immune tolerance, which is accepted as the tumor antigen with the highest immunogenicity.47 Nevertheless, the complex procedures and long duration of neoantigen screening and diverse algorithms lead to difficulty in prediction of tumor neoantigens, and tumor heterogeneity may affect the efficacy of immunotherapy and promote tumor immune escape.48 In addition, the extremely small number of generalized tumor neoantigens limit the clinical applications of tumor neoantigens. Since a low tumor mutational burden is observed in pancreatic cancer, and a large number of TAAs are expressed in pancreatic cancer,49 it is hypothesized that pancreatic cancer patients given a short-term therapy may achieve more benefits from TAA. Currently, most in vitro assays and clinical trials focus on the dominant epitopes of TAA and ignore TAA as a self-protein, clonal deletion may occur among specific T cells targeting the dominant epitopes of self-proteins, namely thymic negative selection of T-cell development.28 Although low-affinity epitopes may bypass central immune tolerance but fail to induce adequate immune responses because of the low immunogenicity, modification of epitope residues is a feasible strategy to solve these problems.34
Recently, most clinical trials of cancer immunotherapies such as therapeutic vaccines and adoptive T-cell therapy have been benefited from efficient identification and targeting of epitope, which concentrated on nonapeptide, since epitopes containing 9 amino acids have a high immunogenicity.50 The central CTL epitope of the nonapeptide closely binds to TCR, which plays an important role in peptide-specific T-cell responses, and amino acid substitution of the second and ninth positions in the nonapeptide, which are generally anchor residues, may increase the epitope binding to HLA-I molecules.51–53 However, there is a higher possibility for development of cross-reactions in specific T cells elicited by WT and altered antigens with terminal amino acid changes.54 The common modification is amino acid residue replacement at positions 2 with leucine or methionine and 9 with valine in the epitope sequence, resulting in a high affinity of epitope binding to HLA-A2 molecules. In addition, amino acid substitution at position 1 in the anchor residue with tyrosine was reported to increase the interaction between epitope peptides and HLA molecules via the hydrophobic effects of the lateral benzene rings and the hydrogen-bonding interaction of the phenolic hydroxyl groups.
In our previous study, we altered MUC1 epitopes with amino acid residue substitutions, and the altered MUC1 epitope was found to cross-recognize MUC1 WT epitope and induce a strong in vitro cytotoxicity against gastric cancer cell lines; in addition, the altered MUC1 peptides were all superior to the dominant MUC1950-958 epitope, in which MUC11068-1076Y1-specific CTLs were found to elicit the strongest cytotoxicity against gastric cancer cells.35 In this study, we tested the feasibility of the altered MUC1 epitope for immunotherapy of pancreatic cancer, and the MUC11068-1076Y1 epitope, which exhibited the highest cytotoxicity against gastric cancer cells, was selected for in vitro and in vivo assays. Our data showed that the MUC11068-1076Y1 epitope presented a remarkably increased binding affinity and stability, and increased T-cell activation and proliferation, indicating that the epitope immunogenicity is closely correlated with both the binding affinity and the stability of binding to MHC molecules to form the pMHC complex.55 A great increase in the binding of the MUC11068-1076Y1 epitope to HLA-A2 molecules would remarkably improve the immunogenicity of the epitope. We found that the CTLs elicited by both the MUC1 WT epitope and the altered MUC1 epitope recognized and induced immune responses against pancreatic cancer cells, and altered MUC1 epitope-specific CTLs showed a stronger cytotoxicity against pancreatic cancer cells than MUC1 WT epitope, and induced higher TNF-α, IFN-γ, perforin, and granzyme B levels than MUC1 WT epitope. In addition, xenograft tumor growth assay revealed a higher cytotoxicity of MUC11068-1076Y1-specific CTLs against the target A2-BxPC-3 cells relative to MUC11068-1076, and higher inhibition of MUC11068-1076Y1-specific CTLs present on pancreatic cancer cell growth in vivo than MUC11068-1076. Collectively, these data demonstrate that the altered MUC1 epitope is also feasible for pancreatic cancer immunotherapy, which has a higher immunogenicity and does not affect the cross-recognition between altered MUC1 epitope-specific CTLs and MUC1 WT epitope.
Cellular immunity plays the most important role in host immune response against cancers,56 and CTL response has shown a critical role in host immune response against cancers.57 As the earliest surface marker following T cell activation, CD69, which functions as a signal-transmitting receptor, acts during the proliferation and survival of activated T cells.58 CD25, the α-chain of the IL-2 receptor, is accepted as the most prominent cellular activation marker, which plays an important role in responses to IL-2 and leads to lymphocyte activation and IL-2 production.59 As costimulatory molecules, CD28 and 4-1BB provide the second signal to T cell activation during the period of T-cell activation and proliferation. CD28 protects T cells from incompetent induction and effectively enhances T cell activation through up-regulating IL-2 expression.60,61 4-1BB increases the proliferation and survival rate of T cells and promotes the secretion of IL-2 and IFN-γ.62 As an activation inducer of antigen-specific T cells, 4-1BB+ T cells are accepted as a real population of tumor-specific activated T cells, which suppress tumor growth.63 Inhibitor receptors PD-1 and CTLA-4 are common exhaustion markers used for detection of CTL functions, and CTLA-4 promotes antigen-specific T cell apoptosis via negative regulation of T cell activation,64 while PD-1, which is commonly used to restrict CTL functions during the late stage of tumor immunity, causes effector T cell exhaustion in tumor microenvironments.65,66 During the effector phase, 60–70% of CTL responses against target cells are dependent on the perforin/granzyme apoptosis pathway, and perforin not only causes target cell oncosis, but also provides a channel to allow the entry of granzyme into target cells to hydrolyze DNA, thereby inducing target cell apoptosis.67 In addition, CTLs continue to activate following recognition of tumor-specific cell surface antigens and secrete cytotoxic effectors IFN-γ and TNF-α to elicit immune responses against tumors through inducing tumor cell apoptosis.68 TNF-α may bind to TNF receptor I on the surface of tumor cells to mediate the apoptosis of target cells, while IFN-γ may enhance the sensitivity of CTL responses through inducing the expression of MHC molecules in target cells and mediate the infiltration of antigen-specific CTLs into tumors.68 In this study, the expression of activation markers CD25 and CD69 and costimulatory molecules CD28 and 4-1BB was detected on the surface of MUC1 epitope-specific CTLs, and flow cytometry showed higher expression of activation markers CD25 and CD69 and costimulatory molecules CD28 and 4-1BB in altered MUC1 epitope-specific CTLs than in MUC1 WT epitope-specific CTLs. Previous studies have shown that up-regulation of IL-2 secretion promotes the activation and proliferation of tumor-responsive T cells, extends the cell survival period and increases IFN-γ secretion,69 which is in agreement with our data showing elevated IFN-γ levels in the coculture supernatant of DCs loaded with different epitopes and PBLs. Moreover, the MUC11068-1076Y1-specific CTLs produced higher levels of perforin, granzyme B, IFN-γ and TNF-α, and the cytotoxins and cytotoxic effector molecules jointly induced a stronger cytotoxicity against pancreatic cancer cells.
In summary, we identify MUC11068-1076Y1 (YLQRDISEM), a novel HLA-A0201-restricted CTL epitope, as a potential target for pancreatic cancer immunotherapy, and the altered MUC1 peptide-specific CTLs show a stronger cytotoxicity against MUC1+/HLA-A0201+ pancreatic cancer PANC-1 and A2-BxPC-3 cell lines than the MUC1 WT peptide. Our data demonstrate that TAA has a broad-spectrum anticancer action, and alteration of epitope residues, which may serve as a reliable approach to solving the problem of low immunogenicity of TAA, may break immune tolerance and promote antigen-specific T cell activation and proliferation to elicit stronger immune responses against tumors. In addition to immune tolerance, the degree of immune responses is also affected by the binding affinity and stability of antigen peptides, which is a critical factor that determines the immunogenicity of antigen epitopes. Although the modified epitopes targeting low-affinity TAAs have improved immunogenicity and antitumor effects, they inevitably have some deficiencies. The first is the consideration of safety, that is, normal tissues expressing WT MUC1 may be attacked by CTLs induced by MUC11068-1076Y1. We reduced this cross-reaction by the difference in expression abundance and deglycosylation sites because abnormal MUC1 glycosylation in cancer tissues tends to expose peptide epitopes, whereas these antigens are expressed at low levels and with low affinity in normal tissues.23,70 Second, the MUC1 epitope screened in this study were only limited to MHC-I type, and the long peptides of MHC-II-restricted epitopes were not discussed. As an important auxiliary component of T cell immunity, CD4+ T cells can also effectively play an antitumor role in recognizing MHC-II molecules.71 Therefore, the selection of future immunotherapeutic targets should pay close attention to developing and optimizing prediction pipelines and developing therapeutic targets containing both MHC-I and MHC-II class restriction epitopes. Due to HLA restriction, CTL epitopes should be personalized and selected according to HLA types and characteristics of tumor patients.
ACKNOWLEDGMENTS
This work was supported by grants from the Joint Funds for the innovation of Science and Technology, Fujian Province of China (2018Y9108); the Science and Technology Project in Fujian Province of China (2021Y0054); and Fujian Provincial Clinical Research Center for Cancer Radiotherapy and Immunotherapy (2020Y2012).
DISCLOSURE
The authors declare no conflict of interest.
AUTHORSHIP
Y. B. Y. and W. S. L. conceived and designed the study. J. W. H., G. X. G., S. X. W., Z. F. Z., S. P. C., C. M. Y., and J. Y. L. performed the experiments. J. W. H., G. X. G., S. X. W., and S. Z. L. analyzed and interpreted data. J. W. H., G. X. G., and S. Z. L. provided the first version of the manuscript. J. W. H., G. X. G., W. S. L., and Y. B. Y. provided critical comments on revision of the manuscript. W. S. L. and Y. B. Y. revised and finalized the manuscript. All authors read and approved the final version of the manuscript. J. H. and G. G. contributed equally to this work.
REFERENCES
Abbreviations
- PD-1
programmed death-1
- PD-L1
programmed death-ligand 1
- CAR-T
chimeric antigens receptor-T
- TAA
tumor-associated antigen
- EMT
epithelial–mesenchymal transition;
- WT
wild-type
- HLA
human leukocyte antigen
- TAP
transporter associated with antigen processing
- NOD/SCID
nonobese diabetic/severe combined immune deficiency
- GEPIA
Gene Expression Profiling Interactive Analysis
- β2M
beta-2-microglobulin
- FI
fluorescence index
- MFI
mean fluorescence index
- pMHC
peptide–MHC
- DC
dendritic cell
- LDH
lactate dehydrogenase
- OS
overall survival
- E/T
effector/target cells
Author notes
Additional supporting information can be found online in the Supporting Information section at the end of this article.
