


Abstract
Several subsets of CD8+ T cells are known to have a suppressive function in different tissues and diseases in mice and humans. Due to the lack of a consensus on the phenotype of regulatory CD8+ T cells and very low frequency in the body, its clinical use as adoptive cellular therapy has not advanced much. In the present work, using DNA methyltransferase inhibitor 5-Aza-2′-deoxycytidine (Aza), we efficiently and stably differentiated naïve CD8+ T cells (CD8+CD25–CD44– cells) into the CD8+Foxp3+ regulatory CD8+ T cells (CD8 Tregs). We also generated OVA peptide257-264-specific CD8+Foxp3+ Tregs. Compared with activated CD8 T cells, Aza plus TGF-β-induced CD8+Foxp3+ Tregs showed significantly increased surface expression of CD39, CD73, CD122, CD62L, and CD103, and secreted TGF-β and suppressed the proliferation of effector CD4+ T cells. Interestingly, CD8+Foxp3+ Tregs exhibited low expression of perforin and granzyme required for cytotoxic function. Analysis of chemokine receptors showed that TGF-β + Aza induced CD8+Foxp3+ Tregs expressed gut-tropic chemokine receptors CCR6 and CCR9, and chemokine receptors CCR7 and CXCR3 required for mobilization into the spleen, lymph nodes, and gut-associated lymphoid tissues. Adoptive transfer of induced CD8+Foxp3+ Tregs restored cholera toxin-induced breakdown of oral tolerance to OVA by regulating OVA-specific IgE and IgG1. Altogether, we showed an efficient method to generate antigen-specific CD8+Foxp3+ Tregs, and the adoptive transfer of these cells induces oral tolerance by suppressing allergic response and maintaining intestinal homeostasis.
INTRODUCTION
CD8+ T cells are very well characterized for their cytotoxic activity, and regulatory functions in infections, cancer, autoimmunity, and alloimmunity.1,2 Regulatory CD8+ T cells (CD8 Tregs) are characterized as CD8+CD122+, CD8+CD25+, CD8+CD28low/–, CD8αα homodimer expressing T cells, Qa-1-restricted CD8+ T cells, and CD8+CD45RClow T cells in mice and humans.1,3 The suppressive function of these CD8+ T cells is reported in both in vitro and in vivo settings. However, there is no consensus on reliable surface markers to distinguish regulatory CD8+ T cells from the effector CD8+ T cells.
Regulatory CD4+ T cells that express Foxp3 are well accepted and characterized as potent suppressor T cells. Foxp3 expression in CD8+ T cells is also reported in mice, humans, and nonhuman primates,4,5 where they show a similar transcriptional profile as CD4+Foxp3+ Tregs6 and share a similar suppression mechanism.4 The frequency of CD8+Foxp3+ Tregs is very low, ranging from 0.07 to 0.4% of CD8+ T cells in the spleen and peripheral lymph nodes,5,7 and are present at 2–3 times higher frequency in the gut-associated lymphoid tissues (Peyer's patch and mesenteric lymph nodes [mLNs]).2,5 In humans, CD8+Foxp3+ T cells are about 0.1–1% of total CD8+ T cells,5 and their frequency distribution changes with different diseases and health status.2 Although the suppressive function of CD8+Foxp3+ Tregs is very well documented in different inflammatory and tolerogenic settings, due to its low-frequency distribution, the clinical use of these suppressive cells as adoptive cellular therapy is very limited. It has been reported that suboptimal stimulation of human PBMCs with staphylococcal enterotoxin C1 induces CD8+Foxp3+ Tregs.8 In vitro stimulation of human CD8+CD25– T cells for 4 days with staphylococcal enterotoxin B induces CD8+Foxp3+ Tregs that suppress the proliferation and cytokine production of both CD4+ and CD8+ T cells.9 Foxp3 expression is critical for Treg cell differentiation and function,10 and ectopic expression of Foxp3 in CD4+ T cells renders a suppressive phenotype and function.11,12 Transcription of Foxp3 is controlled by the CpG methylation status of regulatory elements.13,14 5-Aza-2′-deoxycytidine (Aza) is a DNA methyltransferase (DNMT) inhibitor which has been shown to induce strong expression of Foxp3 in mouse and human CD4+CD25− T cells.13 Depletion of DNMT I in CD4 T cells at a thymic double-positive state lead to the expression of the Foxp3 gene in CD8 T cells.15 Naïve CD8+ T cells, when stimulated with donor dendritic cells (DCs) in the presence of IL-2, TGF-β1, and retinoic acid, lead to the generation of alloantigen-specific CD8+ Foxp3+T cells.16 However, a simple and efficient way for the ex vivo generation of potent CD8+Foxp3+ T cells is not reported.
Oral tolerance is a physiologic mechanism of maintaining gut integrity by preventing immune reactivity towards dietary antigens. Generation of oral tolerance involves several steps from the transport and processing of innocuous antigen by regulatory DCs in mLNs and lamina propria, leading to the generation of CD4+ Tregs.17 Tregs generated in the mLN migrate to lamina propria through their β-7 integrin and CCR9 expression and undergo further expansion under the influence of IL-10. Intestine-generated Tregs may exit the tissue and enter the circulation, where they can inhibit the systemic effector T cells response and further increase the number of Tregs through infectious tolerance. When fed with OVA, cholera toxin (CTx) prevents the generation of oral tolerance and induces allergic inflammation through dominant Th2 differentiation.18 Activated CD4+ T cells release type 2 cytokines IL-4 and IL-13, which cause class switching in B cells to produce IgE, while IL-3 and IL-5 promote proliferation of eosinophils, mast cells, and basophils. Antigen-specific IgE produced by B cells binds to high-affinity IgE receptors (FcεRI) on the surface of mast cells and basophils, and gets cross-linked by allergen leading to activation and release of their inflammatory mediators such as histamine, leukotrienes, and the type 2 cytokines IL-4, IL-5, and IL-13, which perpetuates type 2 inflammation. Regulatory B cells produce IL-10, which suppresses allergen-specific IgE production, and are shown to skew the humoral response from the IgE isotype to the noninflammatory isotypes, IgG4 and IgA.19
In the present study, we developed a method to efficiently generate CD8+Foxp3+ Tregs from naïve CD8+ T cells. We also demonstrated a technique to induce antigen-specific CD8+Foxp3+ Tregs and characterized their phenotypes and functions. Further, we showed that the adoptive transfer of ex vivo differentiated CD8+Foxp3+ Tregs restored oral tolerance to OVA and reduced the IgE and IgG1 levels in the serum.
MATERIALS AND METHODS
Mice
Wild-type C57BL/6, C.Cg-Foxp3tm2Tch/J (Foxp3-GFP transgenic), C57BL/6-Foxp3tm1Flv/J (Foxp3-RFP transgenic), B6.SJL-PtprcaPepcb/BoyJ(CD45.1 congenic), and OT-I TCRα/β transgenic (OT-I) mice were procured from the Jackson Laboratory (Bar Harbor, ME) and maintained at National Centre for Cell Science experimental animal facility. Eight to ten weeks old male mice were used in the experiments. The experimental procedures and usage of animals were approved by the Institutional Animal Ethics Committee (Approval reference ID: NCCS/IAEC/B-167 and NCCS/IAEC/B-258). Details of reagents used, cell staining and flow cytometry, immunohistologic staining, quantitative reverse transcriptase reactions (qRT-PCR), and ELISA are given in the Supplementary Materials and Methods.
In vitro differentiation of mouse Foxp3+ CD8 Tregs
CD8+CD25–CD44– cells (naïve CD8+ T cells) were purified from Foxp3-GFP or Foxp3-RFP transgenic mice spleen using flow cytometry sorting (FACS Aria III; BD Biosciences). Naïve CD8+ T cells (5 × 10⁴ cells/well) were cultured with gamma-irradiated (800 rads) T cell-depleted splenocytes (5 × 10⁴ cells/well) in 0.2 ml of complete RPMI 1640 medium (RPMI medium supplemented with 10% fetal bovine serum, 50 μM β-mercaptoethanol, 2 mM l-glutamine, 20 mM HEPES, 1 mM sodium pyruvate, and penicillin–streptomycin) containing purified anti-mouse CD3ε mAb (clone 145-2C11; 5 μg/ml) and recombinant mouse IL-2 (20 ng/ml) in the U-bottom 96-well plates at 37°C in a 5% CO2 incubator for 5 days. Further, purified recombinant human TGF-β (10 ng/ml) with or without Aza (0.5 μM) was added to the culture to differentiate Foxp3+CD8+ T cells.
In vitro suppression assay
Induced Foxp3-GFP+ CD8 Tregs (2.5 × 10⁴ cells/well) were cultured with CFSE-labeled (5 μΜ) CD4+CD25– naive T cells (5 × 10⁴ cells/well) in the presence of gamma-irradiated (800 rads) T cell-depleted splenocytes (5 × 10⁴ cells/well) in 0.2 ml of complete RPMI 1640 medium containing purified anti-mouse CD3ε mAb (clone 145-2C11; 5 μg/ml) in the U-bottom 96-well plates at 37°C in a 5% CO2 incubator for 4 days. The proliferation of CFSE-labeled CD4 T cells was analyzed by monitoring the dilution of CFSE on CD4+ cells using flow cytometry (FACS Canto II; BD Biosciences).
Oral tolerance study in mice
CD45.1 congenic mice were given an oral gavage of either OVA (25 mg/dose/mouse) or OVA with CTx (5 μg/dose/mouse) on days 0, 1, and 2. On day 7, mice were given a subcutaneous injection of OVA (100 μg) in complete Freund's adjuvant, and mice in OVA plus CTx + CD8 Treg group received the intravenous transfer of induced Foxp3-GFP+CD8+ Tregs (3 × 10⁵ cells/mouse). On day 14, mice were sacrificed. Serum was prepared and stored in a −80°C freezer, and immune cells in the secondary lymphoid tissues were analyzed using flow cytometry.
Human CD8 T cell cultures
The blood was collected from healthy human volunteers after obtaining the informed consent. This was approved by NCCS Institutional Ethics Committee (approval Id: NCCS/IEC/2018-I/2). Details of CD8 T cell cultures are given in Supplementary Materials and Methods.
Statistics
Data were analyzed using GraphPad Prism software version 9 (GraphPad, La Jolla, CA). Three or more independent groups were analyzed by one-way ANOVA or two-way ANOVA, followed by Tukey's post-testing for multiple comparisons. A p value < 0.05 were considered significant. Statistical details are provided in the figure legends.
RESULTS AND DISCUSSION
TGF-β and Aza efficiently induce Foxp3 expression in naive CD8+ T cells
Regulatory T cells (Tregs) maintain peripheral tolerance and prevent the development of autoimmune and inflammatory diseases. CD4+Foxp3+ Tregs are the best characterized regulatory cells essential to regulate the pathogenesis of several diseases. CD8+ Tregs constitute a small and heterogeneous subset of regulatory CD8 T cells, which are less characterized. CpG DNA methylation of Foxp3 promoter and enhancer inhibits the Foxp3 transcription in CD4+ T cells.13,20 DNMT enzyme methylates the cytosine residues in CpG island, and inhibition of CpG methylation during CD4+ T cell differentiation with Aza is reported to induce Foxp3 gene expression and drive the Treg differentiation.13,21,22 Further, it has been reported that Aza and TGF-β induce differentiation of efficient and suppressive CD4+Foxp3+ Treg cells in mice and humans.13 In the present study, we tested if Aza and TGF-β can also induce the Foxp3 expression in naïve CD8+ T cells (CD8+CD25–CD44–Foxp3-GFP–) isolated from the Foxp3-GFP transgenic male mice. Our data showed that treatment with anti-CD3ε mAb and recombinant IL-2 and TGF-β and Aza induced efficient and significant differentiation of naïve CD8 T cells into CD8+CD25+Foxp3-GFP+ T cells (CD8+Tregs) (Figures 1(A)–1(C)).
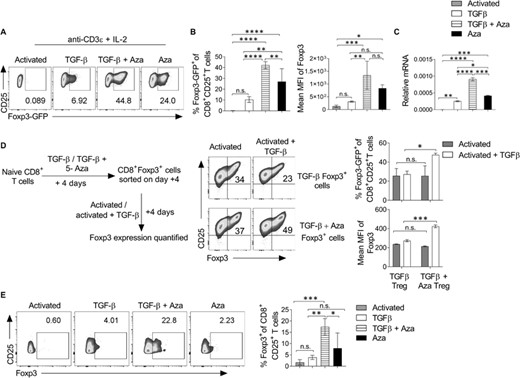
TGF-β and Aza promote the differentiation of Foxp3+CD8+ Tregs. Purified naïve CD8+ T cells from Foxp3-GFP transgenic mice were in vitro differentiated into the Treg lineage with or without Aza for 5 days. (A) On day 5, cells were analyzed using flow cytometry. The representative flow cytometry plots show the percentage of Foxp3-GFP+ cells after gating on CD8+CD25+ T cells. (B) The bar graph shows the mean percentage expression (left) and MFI (right) of Foxp3-GFP on CD8+CD25+ cells. (C) On day 5, CD8+CD25+ cells were purified using flow cytometry sorting, and relative Foxp3 mRNA expression was analyzed using qRT-PCR. (D) Naive CD8+ T cells were differentiated into Treg in the presence or absence of Aza. On day 5, CD8+Foxp3-GFP+ cells were sorted and cultured for another 5 days with or without recombinant TGF-β. Foxp3-GFP and CD25 expression were analyzed after gating on CD8+ cells. (E) Seventy thousand sorted naïve CD8 T cells (CD8+CD25–CD45RA+) from human PBMCs were cultured on 96-well flat-bottom plates coated with anti-CD3ε and soluble anti-CD28 antibody in the presence of TGF-β or TGF-β + Aza for 4 days. The bar graph represents the mean percentage of intracellular Foxp3 expression on CD8+CD25+ cells. Data shown are from 1 of the 3–5 independent experiments. The error bar represents ± sem. (A–C, E) Statistics were calculated using one-way ANOVA with Tukey's correction. (D) Two-way ANOVA with Tukey's correction. *p < 0.05; **p < 0.01; ***p < 0.001; ****p < 0.0001; n.s. not significant
To test if the in vitro differentiated CD8+Tregs have a stable expression of Foxp3, naïve CD8 T cells were isolated from Foxp3-GFP mice and in vitro differentiated into CD8+Foxp3-GFP+ T cells in the presence of IL-2 and anti-CD3ε mAb with or without TGF-β alone or TGF-β + Aza. CD8+Foxp3GFP+ T cells were isolated from culture using flow cytometry sorting (purity > 98%). These GFP+CD8+ cells were cultured in the presence of anti-CD3ε mAb and IL-2 with or without TGF-β for another 5 days (Figure 1(D), left). Results showed that CD8+Foxp3-GFP+ cells differentiated in the presence of TGF-β + Aza maintained a higher percentage and MFI of Foxp3-GFP compared with cells differentiated in the presence of only TGF-β (Figure 1(D), right). Together, these data showed that Aza and TGF-β treatment induces efficient and stable differentiation of CD8+Foxp3+ Tregs. Further, TGF-β + Aza also promoted the differentiation of human CD8+Foxp3+ Tregs (Figure 1(E)). These results suggest that TGF-β + Aza drives a much more stable Foxp3 expression in the naïve CD8+ T cells.
CD8+Foxp3+ Tregs show regulatory phenotype and suppress the proliferation of naïve CD4+ T cells
Regulatory CD8+Foxp3+ T cells use molecular mechanisms similar to CD4+Foxp3+ Treg cells.5,23 Some of these regulatory molecules, such as CD39, CD73, glucocorticoid-induced TNF receptor (GITR), and FasL, are known for their Treg suppressive function.24,25 CD39 and CD73 work to maintain tissue homeostasis by mediating the conversion of extracellular inflammatory ATP molecules to noninflammatory adenosine molecules, which inhibits T cell activation and effector functions.26 Expression of surface FasL on Tregs mediates the apoptosis of Fas-expressing effector T cells. FasL-expressing CD8+CD122+PD1+ Tregs are extraordinarily suppressive and are critical for preventing allograft rejection.27 We characterized the phenotypes of TGF-β + Aza-induced CD8+Foxp3+ Tregs. Our data showed that CD8+ Foxp3+Tregs differentiated in the presence of TGF-β + Aza had increased expression of CD39, CD73, and FasL as compared with activated CD8+ T cells (Figure 2(A)). The expression of these regulatory receptors suggests that, like CD4+ Tregs, CD8+Foxp3+ Tregs can effectively mediate suppression in a contact-dependent mechanism.28 CD4+ Tregs have been shown to constitutively express GITR, blocking of which inhibited their suppressive functions.29 In CD8 T cells, however, GITR is shown to mediate activation and production of IFN-γ and granzyme B. Cooperative costimulatory signals from GITR and CD28 were shown to be essential for the full activation of CD8 T cells.30 We did not find a significant difference in the expression of GITR observed between activated, TGF-β or TGF-β + Aza-induced CD8 Tregs (Figure 2(A)).
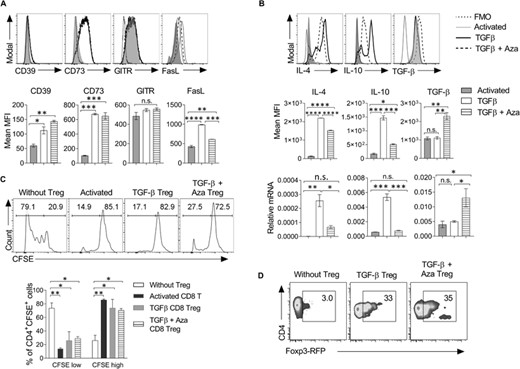
CD8+Foxp3+ Tregs express regulatory markers and suppress the proliferation of CD4+ T cells. (A) CD8+CD25– naive T cells were differentiated into the Treg lineage as mentioned in Figure 1(A). Cells were harvested on day 5 and analyzed for the expression of regulatory receptors. The histogram plots show the expression of molecules on CD8+CD25+ T cells under activated TGF-β or TGF-β + Aza conditions. n = 3 experiments. (B) The histogram plots show the expression of intracellular cytokines and mean MFI shown as bar graphs (n = 3 experiments). CD8+CD25+ cells were purified using flow cytometry and shown as histograms (upper panel) and MFI (middle panel). Cells were harvested, and IL-4, IL-10, and TGF-β mRNA expression was analyzed using qRT-PCR (lower panel). The data shown are representative of 2 independent experiments. The error bar represents ± sd. (C) On day 5, CD8+Foxp3GFP+ T cells were isolated from the activated TGF-β and TGF-β + Aza group using flow sorting. CFSE-labeled naive CD4+CD25–CD44– T cells (5 × 10⁴ cells/well) from Foxp3-RFP transgenic mice were cultured with CD8+Foxp3-GFP+ cells (2.5 × 10⁴ cells/well) from activated, TGF-β or TGF-β + Aza group in the presence of anti-mouse CD3ε antibody. On day 5, the dilution of CFSE dye on CD4 T cells was monitored using flow cytometry. Numbers in the histogram represent the frequency of the cells in the gated region. The mean percentage of CFSE low and CFSE high cells were shown in the bar graph after gating on CD4+CFSE+ cells. Error bar represents ± sem. The histograms shown are representative of 1 of the 3 independent experiments. (D) As mentioned in C, on day 5 of coculture, the expression of Foxp3-RFP was analyzed in CD4+ T cells. The representative flow cytometry plots show the percentage of Foxp3-RFP+ cells after gating on CD4+ cells. The data shown are representative of 2 independent experiments. Statistics were calculated using one-way ANOVA with Tukey's correction. *p < 0.05; **p < 0.01; ***p < 0.001; n.s. not significant. FMO = Fluorescent minus one staining control
TGF-β is an immunosuppressive cytokine that suppresses T cell proliferation and IL-2 production. TGF-β secreting CD8+LAP+ Tregs have been recognized to regulate antigen-specific immune response by inhibiting IFN-γ production and promoting CD4+ Treg expansion.31 In addition to CD4+ Tregs, the suppressor CD8+ T cells inhibit T cell proliferation by secreting IL-10 and TGF-β. TGF-β is also shown to down-regulate the expression of granzyme B, perforin, FasL, and IFN-γ in cytotoxic CD8+ T cells.32 In the intestine, TGF-β a rich milieu induces differentiation of peripheral Treg. Our data showed that TGF-β + Aza Tregs have a significantly high TGF-β protein expression than TGF-β-induced Tregs or activated CD8 T cells. Importantly, TGF-β Tregs also showed similar expression of CD39, CD73, FasL, and TGF-β, which indicates that the expression of these genes is directly or indirectly regulated by TGF-β signaling. Conclusively, the addition of Aza enhances the frequency and regulatory properties of TGF-β-induced CD8 Tregs. Foxp3 (Tregs) and GATA3 (Th2) are counterregulatory to each other's development.33 Further, our data showed that TGF-β-induced Tregs had enhanced IL-4 and IL-10 mRNA and protein expression as compared with activated or TGF-β + Aza-induced Tregs (Figure 2(B)), whereas TGF-β + Aza-induced Tregs showed a higher expression of TGF-β protein compared with activated CD8 T cells or TGF-β-induced CD8 Tregs (Figure 2(B)). Foxp3 (Tregs) and GATA3 (Th2) are counterregulatory to each other's development.33 TGF-β Tregs showed significantly higher expression of Th2 cytokines IL-4 and IL-10. Treg type 1 cells (Tr1) Foxp3– CD4+ T cells are recognized to secrete IL-10 and mediate immunosuppression in a contact-independent manner.34 Our study showed that a low level of Foxp3 induced in TGF-β-induced CD8 Tregs is probably not sufficient to inhibit their production of IL-4 and IL-10. Accordingly, high Foxp3 expressing TGF-β + Aza Tregs showed reduced IL-4 and IL-10 levels compared with TGF-β Tregs but not activated CD8 T cells (Figure 2(B)).
Furthermore, we investigated the suppressive function of TGF-β or TGF-β + Aza-induced CD8+Foxp3+ Tregs using an in vitro suppression assay. Our results showed that both TGF-β or TGF-β + Aza-induced CD8+Foxp3+ Tregs equally suppressed the proliferation of naïve CD4+ T cells (Figure 2(C)). Interestingly, activated CD8 T cells showed similar activity and suppressed the proliferation of effector CD4 T cells (Figure 2(C)), which is in accordance with previous reports.23 There can be 2 explanations for it: First, activated CD8 T cells, TGF-β CD8 Treg, and TGF-β + Aza CD8 Tregs use independent mechanisms; second, the in vitro suppressive function of CD8 Tregs is not dependent on Foxp3 expression. In addition, suppressive CD8 T cells can indirectly regulate CD4+ T cell activation and proliferation by down-regulating the costimulatory functions of APCs.35 In the same setting, we also checked the importance of CD8+Foxp3+ Treg on driving the expression of Foxp3 in naive CD4+ T cells under coculture conditions. Our data showed that TGF-β or TGF-β + Aza CD8+Foxp3+ Tregs induced the expression of Foxp3 in the cocultured CD4+ T cells (Figure 2(D)). Together, these data suggested that TGF-β or TGF-β + Aza-induced CD8+Foxp3+ Tregs express various regulatory molecules and display suppressive function.
CD8+Foxp3+ Tregs down-regulate activation/effector molecules and up-regulate molecules require for homing to secondary lymphoid organs and gut
CD8 T cells are bonafide cytotoxic cells that show enhanced effector functions in response to immune response against intracellular pathogens and tumors. Down-regulation of CD28 on CD8+ T cells is associated with reduced proliferation, reduced interaction with APCs, suppressed expression of costimulatory molecules, enhanced expression of regulatory receptors, and the suppression of effector T cell response.36 The CD8+CD122+ CD8+ Tregs have been shown to produce IL-10 and suppress CD4+ and CD8+ T cells2. CD8+ Tregs can be categorized as thymus-derived CD28low and peripherally induced CD28– cells2. We next compared the effector phenotype of in vitro differentiated CD8 Tregs with the activated CD8 T cells. Our data showed that TGF-β + Aza Tregs maintained comparable expression of CD28, whereas TGF-β Tregs showed a slight reduction (Figure 3(A)). CD8+CD122+ cells are also characterized as the CD8+ Treg subset, which maintains immune homeostasis.37 Mouse CD8+CD122+ suppressive cells were shown to have CD44highCD62Lhigh central memory phenotype.38 Our results showed that MFI for CD122 on TGF-β + Aza Tregs was higher than activated or TGF-β cultured CD8 T cells (Figure 3(A)). As compared with activated CD8+ T cells (CD44highCD62Llow), TGF-β and TGF-β + Aza-induced CD8+Foxp3+ Tregs showed CD44lowCD62Lhigh phenotype, pointing towards their anergic/resting state (Figure 3(A)).
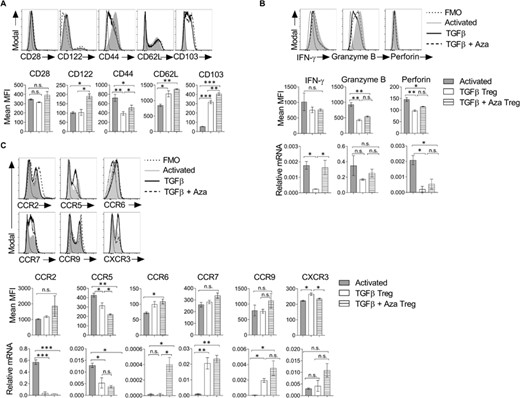
CD8+Foxp3+ Tregs show effector molecules and chemokine receptors. CD8+CD25– naive T cells (5×10⁴ cells/well) from Foxp3-GFP transgenic mice were differentiated into the Treg lineage in the presence of TGF-β with or without Aza. (A) Cells were harvested on day 5 and analyzed for the expression of activation receptors. The histogram plots show the expression of molecules on CD8+CD25+ T cells under activated, TGF-β or TGF-β + Aza conditions (upper panel). The bar graph is the mean MFI (lower panel). n = 3 experiments. (B) The histogram plots show the expression of intracellular effector molecules (upper panel) and mean MFI shown as a bar graph (middle panel). n = 3 experiments. CD8+CD25+ cells from the above cultures were isolated using flow sorting, and mRNA expression of IFN-γ, granzyme B, and perforin were analyzed using qRT-PCR. The data represent 1 of the 2 independent experiments (lower panel). (C) The histogram plots show the expression of chemokine receptors (upper panel), and the mean MFI is shown as a bar graph (middle panel). n = 3 experiments. mRNA expression was analyzed on flow-sorted CD8+CD25+ cells using qRT-PCR (lower panel). The data shown are representative of 2 independent experiments. The error bar for mean MFI represents ± sem. The error bar for relative mRNA represents ± sd. Statistics were calculated using one-way ANOVA with Tukey's correction. *p < 0.05; **p < 0.01; ***p < 0.001; n.s. not significant. FMO = Fluorescent minus one staining control
CD103 is an integrin alpha E molecule that directs the migration of cells towards its ligand E-cadherin expressed on epithelial cells.39 Our analysis showed that TGF-β + Aza-induced CD8+Foxp3+ Tregs have significantly higher expression of CD103 as compared with activated or TGF-β cultured CD8 T cells (Figure 3(A)).
IFN-γ, granzyme B, and perforin are among the critical molecules required for cytotoxic and effector function of CD8+ T cells. IFN-γ secreted by CD4+ Tregs is also needed for suppressing alloreactive response and prolonging the survival of skin allografts.40 Similarly, LAP+CD8 Tregs have been shown to secrete IFN-γ and suppress the progression of EAE.40 Our data showed that CD8 Tregs maintained IFN-γ protein expression similar to activated CD8 T cells (Figure 3(B)). However, TGF-β-induced Tregs showed reduced IFN−γ mRNA levels than activated or TGFβ + Aza Treg (Figure 3(B)). IFN-γ and TGF-β produced by CD8+LAP+ Tregs are shown to promote the generation of tolerogenic APC, which helped circumvent EAE.31 IFN-γ is also shown to induce apoptosis, inhibit T cell proliferation, and induce the conversion of naïve CD4+ T cells to Tregs.41 Furthermore, TGF-β and TGF-β + Aza-induced CD8+Foxp3+ Tregs showed reduced granzyme B and perforin levels compared with the activated CD8+ T cells (Figure 3(B)), suggesting that suppression is independent of the cytolytic ability of CD8+ T cells.16
Migration of Treg cells into the secondary lymphoid organs and at the site of inflammation is key for its effective suppressive functions in the body. Several adhesion molecules and chemokine receptors play an important role in the migration of T cells. CCR6 and CCR9 are gut tropic chemokine receptors.42 CCR2 and CCR5 enable the migration of cells to inflamed tissues and migration from tissue to the draining lymph nodes.43 CXCR3 expressing Tregs are known to infiltrate the site of inflammation and control excessive Th1 response.44 We analyzed the expression of various chemokine receptors on induced Tregs. Our data showed that TGF-β + Aza-induced CD8+Foxp3+Tregs had higher CCR6, CCR7, and CCR9 mRNA expression but lower CCR2 and CCR5 mRNA expression than activated CD8 T cells (Figure 3(C)). The surface expression of most of these chemokine receptors showed a trend similar to mRNA expression levels (Figure 3(C)). It has been reported that CCR7 is required for the recirculation of Tregs through LN and gut and to control the priming phase of an ongoing immune response.45 Altogether, these data showed that TGF-β + Aza-induced CD8+Foxp3+ Tregs have reduced effector and cytolytic molecules but possess the expression of molecules necessary for their efficient mobilization into the secondary lymphoid organs and gut.
TGF-β + Aza drives the differentiation of antigen-specific CD8+Foxp3+ Tregs
Antigen-specific immunosuppression by Treg cells plays an important role in inducing tolerance to self- or alloantigens. It gives an added advantage to the Tregs for the adoptive cellular therapy of various diseases such as allergy, autoimmunity, and alloimmunity. To understand the effect of TGF-β and Aza on the differentiation of antigen-specific Tregs, we generated OT-I/Foxp3-GFP double transgenic mice by breeding OT-I TCR transgenic mice with Foxp3-GFP transgenic mice. T cell receptors of these mice are specific to OVA peptide (OVA257-264) and transgenic for Foxp3-GFP. OT-I/Foxp3-GFP mice were given a subcutaneous injection with OVA257-264 peptide (50 μg) emulsified in complete Freund's adjuvants. After 7 days, draining lymph node cells were harvested and cultured in the presence of OVA peptide (2 μg/ml) and IL-2(20 ng/ml) with or without TGF-β + Aza for 7 days. Differentiation of Foxp3+CD8+ Tregs was monitored by flow cytometry. Our data showed that TGF-β + Aza induced a higher frequency of OVA257–264-specific CD8+Foxp3+ Tregs (Figure 4(A)). Furthermore, these Tregs were CD28lowCD122low and had a higher expression of CD103 (Figure 4(B)). The antigen-specific CD8+ Tregs also showed higher IFN-γ and TGF-β expression than Tregs differentiated in TGF-β alone or activated CD8+ T cells (Figure 4(B)). Together, we showed that TGF-β + Aza could efficiently induce antigen-specific CD8+Foxp3+ Tregs, which showed a similar phenotype to polyclonal CD8+Foxp3+ Tregs.
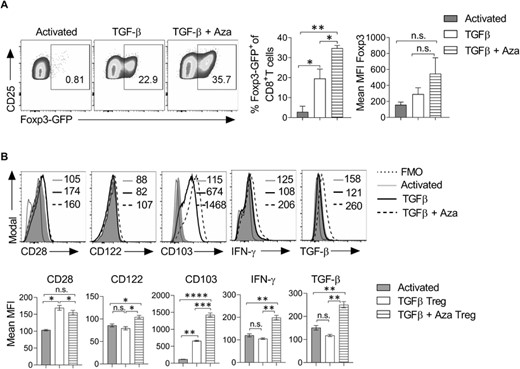
TGF-β + Aza induces the differentiation of OVA antigen-specific CD8+Foxp3+ Tregs. OT-I–Foxp3-GFP double transgenic mice were given a subcutaneous injection of OVA257–264 peptide (50 μg) emulsified in complete Freund's adjuvant (CFA). On day 7, draining lymph nodes were harvested, and the single-cell suspension was prepared. Total lymph node cells cultured with OVA257–264 peptide (2 μg/ml) and IL-2 (20 ng/ml). TGF-β (10 ng/ml), and Aza (0.5 μM) were added to the culture for differentiation into Tregs. (A) On day 7, cells were analyzed for the expression of Foxp3-GFP. The representative flow cytometry plots show the percentage of CD25+Foxp3-GFP+ cells after gating on CD8+ cells. Error bar represents ± sem. (B) The expression of CD28, CD122, CD103, IFN-γ, and TGF-β was analyzed in the differentiated cells. Data shown are gated on CD8+ CD25+ cells. The numbers in the histograms represent MFI. The data shown are representative of 2 independent experiments. The error bar for mean MFI represents ± sem. Statistics were calculated using one-way ANOVA with Tukey's correction. *p < 0.05; **p < 0.01; ***p < 0.001; n.s. not significant. FMO = fluorescent minus one staining control
CD8+Foxp3+ Tregs restored OVA-specific oral tolerance
To test the suppressive function of in vitro induced CD8+Foxp3+ Tregs, we used a mouse model of OVA-specific tolerance in the gut.46 In this model, to break the oral tolerance to OVA, CD45.1 congenic mice were orally fed with OVA + CTx for 3 consecutive days. Control mice were given either PBS or OVA alone. On day 7, all mice groups were immunized with OVA subcutaneously. In addition, the OVA + CTx group also received the adoptive transfer of TGF-β + Aza-induced CD8+Foxp3GFP+ Tregs (Figure 5(A)). On day 14, mice were sacrificed, and the OVA-specific antibody response in serum was monitored (Figure 5A). Our data showed that treatment with CD8+Foxp3+Treg in OVA + CTx treated mice had reduced OVA-specific IgE and IgG1 levels (Figure 5B). However, OVA-specific IgA, IgG2b, and IgM did not significantly differ between OVA + CTx and OVA/CTx + CD8+Foxp3+ Treg groups (Figure 5(B)). Furthermore, immunohistochemical staining of tissue section derived from Peyer's patch, small intestine, and colon of OVA/CTx + CD8+Foxp3+ Treg mice showed reduced IgE+ cells and with little or no change in IgA+ cells as compared with OVA + CTx mice (Figure 5(C)). We also observed a reduced number of FcεRI-expressing mast cells in the OVA/CTx + CD8+Foxp3+ Treg group compared with OVA + CTx mice (Figure S1(A)). IFN-γ inhibits IgE and IgG1 isotype switching.47 We speculated that IFN-γ regulates the decrease in serum IgE and IgG1 upon adoptive transfer of CD8+Foxp3+ Tregs. However, we did not find any significant difference in total IFN-γ level in the control and CD8+Foxp3+ Treg groups (Figure S1(B)). Furthermore, the OVA/CTx + CD8+Foxp3+ Treg group showed increased numbers of total Foxp3+ and CD8+ cells in Peyer's patch, small intestine, and colon tissue compared with the OVA + CTx group (Figure S2). Altogether, these data suggested that the adoptive transfer of in-vitro differentiated CD8+Foxp3+ Tregs restores OVA-specific tolerance by regulating IgE and IgG1 levels and enhancing the differentiation of regulatory Foxp3+ T cells.
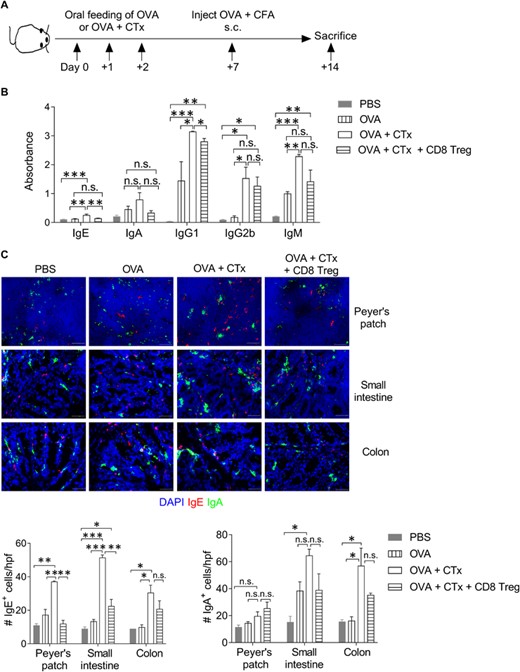
CD8+Foxp3+ Tregs restored OVA-specific oral tolerance. (A) Schematic presentation of the experimental strategy. CD45.1 congenic mice were orally fed with 3 consecutive doses of OVA (25 mg/dose) with or without CTx (5 μg/dose). On day 7, mice were immunized with OVA (100 μg) in complete Freund's adjuvant (CFA) subcutaneously. TGF-β + Aza-induced CD8+Foxp3gfp+ Tregs (3 × 10⁵ cells/mouse) were adoptively transferred in OVA + CTx treated group. On day 14, mice were sacrificed, and blood, Peyer's patch, intestine, and colon were harvested and used for analysis. (B) OVA-specific immunoglobulins in the serum were measured using ELISA. Absorbance values of IgE, IgA, IgG1, IgG2b, and IgM are plotted. n = 3–4 mice/group. (C) On day 14, Payer's patch, small intestine, and colon were collected, snap-frozen in OCT, and 7-μm thick tissue sections were stained for IgE (red), IgA (green), and nuclear stain DAPI (blue). Original magnification 400×. Representative images are shown. n = 3-4 mice per group. The bar graph shows the average count of IgE+ cells/hpf (left) and IgA+ cells/hpf (right). Error bar represents ± sem. Statistics were calculated using one-way ANOVA with Tukey's correction. *p < 0.05; **p < 0.01; ***p < 0.001; n.s. not significant
In vivo treatment with a small number of CD8+ Tregs has been shown to regulate the severity of EAE, allergic diarrhea and prolong allograft survival.4,16 Our data also showed that treatment with 1 dose of TGF-β + Aza-induced CD8+Foxp3+ Tregs regulated CTx-induced antigen-specific IgE and IgG1 response and helped restore the oral tolerance. We speculate that CD8 Tregs contribute to restoring the tolerance and controlling the gut-allergic reaction by enhancing the differentiation of CD4 Tregs in a contact-dependent manner involving molecules such as CD39, CD73, FasL and contact-independent manner by producing TGF-β. CD8 Tregs directly or indirectly regulate the Th2 response leading to reduced IgE level and suppressed mast cell frequency and activation. In conclusion, treatment of CD8 Tregs enhances tolerance generation indicating their therapeutic importance in adoptive cellular therapy to regain homeostasis and control the gut-immune responses.
FUNDING
S. G. received a Senior Research Fellowship (SRF) from the Indian Council of Medical Research (ICMR); HTM received SRF from the Department of Science and Technology (DST); and S. A. S. received SRF from the Council of Scientific and Industrial Research, Government of India. G. L. received grants from the Department of Biotechnology (Grants numbers, BT/PR15533/MED/30/1616/2015; BT/PR14156/BRB/10/1515/2016) and Swarna Jayanti Fellowship (DST/SJF/LSA-01/2017-18) from DST, Ministry of Science and Technology, Government of India.
AUTHORSHIP
S. G., H. T. M., S. A. S., and S. S. carried out experiments. S. G. and H. T. M. analyzed the data. S. G., H. T. M., and G. L. interpreted the results and wrote the manuscript. G. L. conceptualized and designed the experiments and arranged the funding. All authors read and approved the final manuscript. S. G. and H. T. M. contributed equally to this work.
DISCLOSURE
The authors declare no competing interests.
REFERENCES
Abbreviation
- Aza
5-Aza-2′-deoxycytidine
- CTx
Cholera toxin
- DCs
dendritic cells
- GITR
glucocorticoid-induced TNF receptor
- LAP
latency-associated peptide
- mLN
mesenteric lymph nodes
- Tregs
regulatory T cells
Author notes
Additional supporting information can be found online in the Supporting Information section at the end of this article.
