


Abstract
Chronic myeloid leukemia (CML) is characterized by constitutive BCR–ABL kinase activity, an aggressive proliferation of immature cells, and reduced differentiation. Targeting tyrosine kinase activity of BCR–ABL with imatinib is an effective therapy for the newly diagnosed CML patients; however, 20%–30% of the patients initially treated with imatinib eventually experience treatment failure. Therefore, early identification of these patients is of high clinical relevance. In the present study, we by undertaking a direct comparison of inducible NOS (iNOS) status in neutrophils from healthy volunteers, newly diagnosed, imatinib responder, and resistant CML patients as well as by conducting in vitro studies in K562 cells demonstrated that inhibition of BCR–ABL by imatinib or siRNA significantly enhanced NO generation and iNOS expression. Indeed, patients exhibiting treatment failure or imatinib resistance were less likely to induce NO generation/iNOS expression. Our findings further demonstrated that imatinib mediated antiproliferative and proapoptotic effect in BCR–ABL+ cells associated with enhanced iNOS expression, and it was significantly prevented in the presence of L-NAME, 1400W, or iNOS siRNA. Overexpression of iNOS in K562 cells expectedly enhanced imatinib sensitivity on cytostasis and apoptosis, even at lower concentration (0.1 μM) of imatinib. Mechanistically, imatinib or BCR–ABL siRNA following deglutathionylation of NF-κB, enhanced its binding to iNOS promoter and induced iNOS transcription. Deglutathionylation of procaspase-3 however associated with increased caspase-3 activity and cell apoptosis. Taken together, results obtained suggest that monitoring NO/iNOS level could be useful to identify patients likely to be responsive or resistant to imatinib and can be used to personalized alternative therapy.

INTRODUCTION
NO displays pleiotropic properties and is critically involved in numerous physiologic and pathologic processes. It exerts differential effects within the multistage of cancers. Aberrant expression of inducible NOS (iNOS) observed in tumor cells as well as in tumor-infiltrating cells generates mutagenic concentrations of NO in the tumor microenvironment and acts as an endogenous regulator of cell proliferation and survival.1–3 Increasing evidence highlight the pro- and antitumorigenic effect of iNOS-derived NO depending on its concentration, redox environment, NO flux, and the cell type.4 Several lines of in vivo cancer models, including colon, breast, and stomach cancer, indicated that iNOS deficiency inhibited tumorigenesis.5 In contrast, others observed that deletion of iNOS in the ApcMin/+ colon cancer mouse model promotes intestinal tumorigenesis, thereby substantiating the role for iNOS in host defense mechanisms.6 Previous study from this laboratory has demonstrated that NO donor DETA-NONOate at lower concentration associated with enhanced HL-60 cell proliferation by Cdk2 nitrosylation, whereas higher concentration dependent loss of mitochondrial membrane potential linked with enhanced cell apoptosis.7
Chronic myeloid leukemia (CML), caused by reciprocal t(9;22)(q34;q11) chromosomal translocation and formation of BCR–ABL fusion protein, shows sustained neutrophilia and enhanced number of neutrophil precursor cells in the blood and bone marrow (BM) as a consequence of altered cytoskeleton function, cell proliferation, differentiation, and prolonged cell survival.8,9 Imatinib, a BCR–ABL kinase inhibitor and the front line therapy for CML, counteracts BCR–ABL kinase and produces a high response in patients during the chronic phase.10 However, this strategy is less effective in cases of primary resistance and increases the risk of disease progression in the accelerated or blast crisis phase. Moreover, 20%–30% of patients initially treated with imatinib will eventually experience treatment failure and develop secondary resistance.11 Previous reports have shown that treatment of BCR–ABL+ cells with NO donors altered the expression of genes involved in the iron metabolism, inhibited cell proliferation, and enhanced apoptosis.12,13 Others substantiated that a high level of NO derived from NO donors not only reduced cell proliferation and survival of sensitive tumor cells but also sensitized resistant tumor cells both in vivo and in vitro.14–16 Indeed, our group has recently demonstrated that NADPH oxidase 2 (NOX2) and mitochondrial ROS (mtROS) mediated enhanced NF-κB S-glutathionylation attenuated NO generation and iNOS expression in neutrophils (PMNs) from CML patients17; however, association of intracellular NO/iNOS in BCR–ABL+ cell proliferation, survival, and its role on imatinib response is still less understood.
In the present study, we set out to investigate the effect of imatinib on the status of NO/iNOS in BCR–ABL+ cells, whereas iNOS inhibitor (L-NAME, 1400W) and gene knockdown strategy were used to examine the physiologic significance of iNOS in these cells. Using PMNs of CML patients and K562 cells, we demonstrated that inhibition of BCR–ABL by imatinib or siRNA significantly augmented NO generation and iNOS expression in BCR–ABL+ cells. Further, we provide evidence that expression of iNOS potentially affects CML cell proliferation and survival, as inhibition of iNOS reduced antiproliferative and proapoptotic effect of imatinib. Indeed, overexpression of iNOS in BCR–ABL+ cells pronounced the cytostatic and proapoptotic effects of imatinib. Mechanistically, we provide evidence that imatinib or BCR–ABL siRNA, by attenuating the S-glutathionylation of NF-κB (p50 and p65 subunits), enhanced its binding to iNOS promoter and pronounced iNOS transcription, whereas iNOS/NO mediated procaspase-3 de-glutathionylation and activation associated with BCR–ABL+ cells apoptosis.
MATERIALS AND METHODS
Reagents and antibodies
2X maxima SYBR green PCR master mix was purchased from Roche Applied Science (Lewes, UK). pCMV6-iNOS (Myc-DDK tagged) vector was procured from OriGene (Rockville, MD, USA). Imatinib (mesylate) was obtained from Cayman chemical (Ann Arbor, MI, USA). Control/Scramble siRNA, iNOS siRNA, and antibodies against iNOS, procaspase-3, NF-κB p50, and NF-κB p65 subunits were purchased from Santa Cruz Biotechnology (Santa Cruz, CA, USA). BCR–ABL siRNA was from Dharmacon (Lafayette, CO, USA). Caspase-3 antibody was procured from Cell Signalling Technology (Danvers, MA, USA) and anti-GSH antibody was obtained from Abcam (Cambridge, MA, USA). Immunoprecipitation starter pack was procured from GE Healthcare (Piscataway, NJ, USA). All primers used in the present study were from Integrated DNA Technology (Coralville, Iowa, United States). MitoSOX red was obtained from Molecular Probes (Eugene, OR, USA). All other chemicals used in the study were purchased from Sigma–Aldrich Co. (St. Louis, MO, USA).
Neutrophils isolation from healthy volunteers and CML patients
Blood samples were obtained from CML patients (18–70 years) from King George Medical University (KGMU), Lucknow, India after getting written consent from the patients or their guardians. The samples from patients with newly diagnosed CML before the start of any treatment (drug naive n = 83), imatinib nonresponders/resistant (patients showing relapse after an initial response to imatinib therapy n = 25), and imatinib responders (3 months to 4 years imatinib treatment n = 74) were collected in sodium citrate (0.129 M, pH 6.5, 9:1v/v). Chromosome analysis of cells revealed 100% translocation 9:22 (Ph+) in all the patients at the time of diagnosis. Phases of disease as well as imatinib nonresponders and responders were defined based on National Comprehensive Cancer Network guidelines.18 Imatinib-resistance mutation analysis was done using nested RT-PCR to detect the BCR–ABL fusion transcript and ABL kinase domain region. Kinase domain mutations were evaluated using the fluorescent nucleotide sequencing technique and mutation analysis were based on recent European Leukemia Net guidelines.19 Clinical characteristics of the CML patients have been described and enlisted in Table 1. Buffy coat from healthy blood donors was obtained from Blood Center, KGMU, Lucknow, India. The donors were free from any major disease and any prior medication for last 72 h. PMNs were isolated as described previously17,20 and neutrophil purity was ascertained by Flow cytometer (FACS Calibur; Becton Dickinson, Franklin Lakes, NJ, USA) using CD15 antibody and was more than 95%. Viability of the isolated PMNs was ∼98%, as assessed by Trypan blue exclusion test. The study protocol was approved by the ethical committees of KGMU and CSIR-Central Drug Research Institute, Lucknow, India and was conducted in accordance with the Declaration of Helsinki.
Characteristics of the chronic phase-chronic myeloid leukemia patients
| Category | |||
|---|---|---|---|
| Drug naive | Imatinib responder | Imatinib resistant | |
| Characteristic | mean ± sem | mean ± sem | mean ± sem |
| Number of patients | 83 | 74 | 25 |
| Age at diagnosis (year), mean (range) | 38.19 | 41.48 | 36.09 |
| (18–69) | (23–65) | (22–70) | |
| Gender | 53M/30F | 51M/23F | 17M/8F |
| Leukocytes (mm3), mean (range) | 111,160 ± 8,192 | 9,302 ± 976.8 | 61,307 ± 13,648 |
| (35,500–296,000) | (3,050–13,880) | (3,220–218,000) | |
| Platelets (million/mm3), mean (range) | 2.58 ± 0.24 | 2.39 ± 0.345 | 3.513 ± 0.5186 |
| (0.590–5.530) | (0.530–3.40) | (0.890–8.620) | |
| Hb (g/dL), mean (range) | 10.49 ± 0.27 | 11.39 ± 0.256 | 9.66 ± 0.36 |
| (6.3–14.6) | (6.9–15.8) | (5.2–11.6) | |
| Duration of imatinib therapy | Treatment naive | 3 months–4 years | 1 year–4.5 years |
|
|
|
|
Clinical features of drug naive, imatinib responders (with optimal response), and imatinib resistant CML patients. CML, chronic myeloid leukemia; KD, kinase domain.
Mutations E255B, E355A, M244V, H396R, and M351T.
BM collection from human subjects and isolation of neutrophils progenitors
BM samples from control and drug naive CML patients after obtaining written consent from the patient or guardian were collected in sodium citrate (0.129 M, pH 6.5, 9:1v/v) by aspiration from the posterior superior iliac spine. KGMU Institutional Ethics Committee approved the consent procedure and the procedure involved in BM collection. Control patients included in the study were free from any inflammatory disease, showed normal hematopoiesis, and also exhibited normal myeloid origin cells, as was clear from their myeloid to erythroid ratio (M:E ratio), which was usually within or less than 10:3 for normal hematopoiesis. BM aspirates in a case of CML at diagnosis typically show hypercellular marrow with marked myeloid hyperplasia and M:E ratio more than 10:1.21 Neutrophil precursors (myeloblast/promyelocytes, myelocytes/metamyelocytes, and band cells/segmented neutrophils represented as bands 3, 2, and 1, respectively) from CML and control patients BM were isolated according to the method described by Singh et al.17 The purity of bands 3, 2, and 1 was assessed by CD11b, CD15, and CD16, and also by Giemsa staining.17 Similar method was used to collect bands 3, 2, and 1 from imatinib-resistant CML patient's peripheral blood. The study protocol was approved by the ethical committees of CSIR-Central Drug Research Institute and KGMU, Lucknow and was conducted in accordance with the Declaration of Helsinki.
Cell culture, treatment, and transfection
Human CML cell line K562 and embryonic kidney cell line HEK293T were from ATCC (Manassas, VA, USA). K562 cells cultured in RPMI-1640 were supplemented with 10% heat-inactivated FBS, 100 IU/ml penicillin, and 100 μg/ml streptomycin at 37°C and maintained at 5% CO2 in the incubator. HEK293T were also maintained in a CO2 incubator at 37°C in DMEM containing NaHCO3, 2 mM glutamine, 10% heat-inactivated FBS, 100 IU/ml penicillin, and 100 μg/ml streptomycin. To correlate the in vitro effect with the observation in humans, the treatment dose of imatinib was selected on the basis of its plasma concentration in imatinib-treated CML patients. The plasma concentration of imatinib in patients treated with starting dose of 400 mg/day is approximately 1,200 ng/ml (2 μM), whereas at 600 and 800 mg/day (400 mg/kg administered twice daily) doses, the concentrations achieved are approximately 1,935 (3.3 μM) and 2,690 ng/ml (4.6 μM), respectively.22 Accordingly, imatinib was used at 2 μM concentration and the duration of the treatment was kept 48 h as described elsewhere.23,24 In another set of experiments, K562 cells pretreated with vehicle, 1400W (100 μM), or L-NAME (1 mM) for 4 h were further treated with imatinib (2 μM) for 48 h. Likewise, PMNs isolated from drug naive CML patients were cultured in RPMI-1640 containing 10% FBS at 37°C and treated with vehicle or imatinib (2 μM) for 4 h.
Transfection of K562 cells with control, iNOS, or BCR–ABL (b3a2, 5′-GCAGAGUUCAAAAGCCCUUdTdT-3′ and 5′-AAGGGCUUUUGAACUCUGCdTdT-3′) siRNA were performed using Nucleofector™ solution V (Lonza, Basel, Switzerland) as described previously.17,25 HEK293T cells were transfected with MSCV-p210-IRES-GFP (BCR–ABL) or MSCV-IRES-GFP (empty vector used as control) retrovirus vector using LTX-plus liposomal transfection reagent (Invitrogen, Carlsbad, CA, USA) as per the manufacturer's protocol.
Stable overexpression of iNOS in K562 cells (K562iNOS)
To create stable cell lines, K562 cells were transfected with 2 μg pCMV6-iNOS or pCMV6 empty vector using Nucleofector™ solution V (Lonza) and the Nucleofector program T-016. Stably transfected neomycin resistance positive clones were selected 48 h after transfection by addition of 250 μg/ml G418 (Sigma). The concentration of G418 was increased at every 48 h up to 550 μg/ml for the cell selection over 3 weeks.26,27
Cell cycle and apoptosis
Cell cycle analysis was performed by flow cytometry as described earlier.7 Briefly, K562 cells (5 × 10⁵) were centrifuged at 150 g for 5 min and pellets were resuspended in hypotonic propidium iodide solution (50 μg/ml PI with 0.03% NP-40 in 0.1% sodium citrate). DNA content in these cells was measured after 15 min using flow cytometer (FACS Calibur; Becton Dickinson, Franklin Lakes, NJ, USA) and was analyzed by Cell Quest program, whereas cell cycle analysis was carried out by using Modfit software (Verity Software, Topsham, ME, USA).
Analysis of K562 cells apoptosis was assessed using Annexin V-FITC/Propidium iodide Kit (BD Biosciences, San Jose, CA, USA). Stained cells were acquired by flow cytometer (FACS Calibur; Becton Dickinson, Franklin Lakes, NJ, USA) and analyzed by using Cell Quest software (Becton Dickinson, Franklin Lakes, NJ, USA).28
Assessment of NO and ROS generation
NO generation in PMNs, K562, or HEK293T cells was monitored by using NO reactive dye 4, 5-diaminofluorescein diacetate (DAF-2DA). Cells (1 × 10⁵) were loaded with DAF-2DA (10 μM) for 15 min at 37°C and the fluorescence of 10,000 cells was acquired on FACS Calibur (Becton Dickinson, Franklin Lakes, NJ, USA) and subsequently analyzed using Cell Quest programme (Becton Dickinson, Franklin Lakes, NJ, USA).17 NO production was also determined by measuring intracellular nitrite content, the metabolic end product of NO formation using modified Griess reagent (0.1% aqueous N-(l-naphthyl)-ethylenediamine dihydrochloride, 1% sulfanilamide, and 2.5% phosphoric acid) and cadmium pellets after reducing nitrate to nitrite as described earlier.17
Intracellular superoxide radicals and mtROS generation were analyzed by flow cytometry using redox-sensitive probes dihydroethidium (10 μM) or mitoSOX red (MSR, 3 μM), respectively.17,29 Results represent fold change in the mean fluorescence intensity with respect to control group.
Mitochondrial membrane potential
Mitochondrial membrane potential was measured using JC-1 (5,5′,6,6′-tetrachloro-1,1′,3,3′-tetra-ethyl-benzimidazocarbo-cyaniniodide), a cationic dye, which accumulate in mitochondria in a membrane potential-dependent manner. Fluorescence of 10,000 cells was acquired by FACS Calibur (Becton Dickinson, Franklin Lakes, NJ, USA) and subsequently analyzed using Cell Quest programme (Becton Dickinson, Franklin Lakes, NJ, USA).28
Determination of intracellular glutathione
PMNs were stained with monobromobimane (mBrB; 40 μM) for 10 min at room temperature and run on a FACS Aria (Becton Dickinson, Franklin Lakes, NJ, USA) with excitation at 353–361 nm and emission at 450 nm.7 An increase in the fluorescence correlated with glutathione (GSH) content. A replicate sample was depleted of GSH by treatment with 100 μM N-ethylmaleimide (NEM) to assess nonspecific binding of the mBrB probe.
Real-time PCR
Quantification of iNOS, BCR–ABL, and glutaredoxins (Grx1 and Grx2) transcript was done by real-time PCR (Light Cycler 480II system; Roche Applied Science) with 2X Maxima SYBR Green RT-PCR Master Mix (Roche Applied Science) using primers; forward 5′-TGT GCT CTT TGC CTG TAT GC-3′, reverse 5′-TTG CCA AAC GTA CTG GTC AC-3′ for iNOS; forward 5′- CAT TCC GCT GAC CAT CAA TAA G-3′, reverse 5′- GAT GCT ACT GGC CGC TGA AG-3′ for BCR–ABL; forward 5′-AGC CAC CAA CCA CAC TAA CG-3′, reverse 5′- CTG CCA CTC ACC TGT GGT TAC-3′ for Grx1; Forward 5′-CAT GTC TGC CAC CAT CCT CA-3′, Reverse 5′-CCC CGC CTC TGG ATT CTT TT-3′ for Grx2 and forward 5′-AAC TGG AAC GGT GAA GGT G-3′, reverse 5′-CTG TGT GGA CTT GGG AGA GG-3′ for β-actin. Relative fold difference between the groups was calculated by using the comparative cycle threshold (2−ΔΔCt) method. β-Actin was used as internal standard to calculate the relative expression.17,20
Coimmunoprecipitation and Western blotting
K562, HEK293T cells, or PMNs were lysed in ice-cold radio immunoprecipitation assay buffer [PBS containing 1 mM EDTA, 1 mM sodium orthovanadate (Na3VO4), 1 mM sodium fluoride, 1 μg/ml aprotinin, 100 μg/ml PMSF, 20 μg/ml pepstatin, 5 mM DFP (diisopropylfluorophosphate), 1% Triton X-100, and 0.1% SDS] for 30 min at 4°C and cell lysate (protein content 750 μg) was immunoprecipitated with 1 μg of iNOS antibody as described previously.17,20 Samples were run on 8% SDS-PAGE and were subsequently immunoblotted with anti-iNOS antibody. β-Actin in the aliquot of same lysate used for immunoprecipitation was used as loading control and densitometric analysis of the respective bands was performed using image J software (National Institute of Health, USA).
To detect protein S-glutathionylation, K562, HEK293T cells, or PMNs were lysed in the cell lysis buffer [50 mM Tris–HCl, 150 mM NaCl, 1 mM EDTA, 1 mM EGTA pH 7.4, 2 mM Na3VO4, 1 mM DFP, and 1% NP-40] containing 20 mM NEM to alkylate reduced thiols and to prevent further disulfide bond formation or cysteine modification. The samples containing equal amounts of proteins (500 μg) were immunoprecipitated with 1 μg of p50, p65, or procaspase-3 antibody as described previously.17,30 The immune-precipitates were separated on 10% acrylamide gels, transferred to PVDF membranes, and probed with anti-GSH (separated under non-reducing condition), p50, p65, or procaspase-3 antibody. The blots were visualized by enhanced chemiluminescence detection reagents. S-glutathionylation was measured following normalization with respective protein expression, and the densitometric analysis was performed using image J software (National Institute of Health, USA).
Chromatin immunoprecipitation
Chromatin immunoprecipitation (ChIP) assays were performed as described earlier.17 Briefly, PMNs, K562, or HEK293T cells were incubated for 10 min with formaldehyde to a final concentration of 1% followed by lysis in a cell lysis buffer (5 mM Pipes, pH 8.0; 85 mM KCl; 0.5% Nonidet P-40, 0.5 mM PMSF, and protease inhibitors). The isolated nuclei were lysed in the lysis buffer (50 mM Tris–Cl pH 8.0, 10 mM EDTA, 1% SDS, 0.5 mM PMSF, and protease inhibitors), sonicated, and precleared with protein-G-Sepharose beads. Half of the supernatant was immunoprecipitated overnight at 4°C using 2 μg anti-p65, anti-p50, or IgG isotype antibody followed by incubation with Sepharose G beads for 2 h, whereas the remaining supernatant was used as input control without antibody incubation. DNA was purified by QIAquick column purification (Qiagen, Hilden, Germany) and measured by real-time PCR using human iNOS/NF-κB forward 5′-GAG GGC TTT CCC AGA ACC AAG-3′ and reverse 5′-GCT GGG CTA CTG ACC CAG CAG TTC CAG -3′ primer. The amount of ChIP DNA was normalized with respective input DNA.17
Caspase-3 activity
Cells were lysed in lysis buffer (150 mM HEPES, pH 7.4, 450 mM NaCl, 150 mM KCl, 1.2 mM EGTA, 1.5% Nonidet P-40, 0.3% CHAPS, 30% sucrose, 30 mM DTT, 3 mM PMSF). Protein (100 μg) was mixed with caspase-3 substrate acetyl-Asp-Glu-Val-Asp-7-amino-4 methylcoumarin (150 μM) to assess changes in the caspase-3 enzyme activity. Fluorescence of cleaved 7-amino-4 methylcoumarin (Sigma–Aldrich) was measured using 380 nm (excitation) and 460 nm (emission) wavelengths on a fluorimeter (Omega; BMG Labtech, Ortenberg, Germany).7,28
Caspase activation in cell-free system
PMNs isolated from healthy volunteers were lysed in caspase activation buffer (25 mM HEPES, pH 7.4, 5 mM MgCl2, and 1 mM EGTA).31 To induce protein S-glutathionylation, equal amount of protein (100 μg) was preincubated with different concentrations of GSSG (0–1 mM) for 90 min at room temperature. Caspase activation in GSSG pretreated samples were performed by adding cytochrome c (10 μM) and dATP (1 mM) followed by incubation at 37°C for 60 min.
Statistical analysis
Data have been represented as mean ± sem. Statistical significance in experiments by comparing 2 groups was determined using 2-tailed Student's t-test, whereas one-way ANOVA followed by Newman–Keul's test was used to analyze data involving more than 2 groups. Statistical analyses were performed with the GraphPad Prism 5.0 program (GraphPad Inc., La Jolla, CA, USA) and P value less than 0.05 was considered statistically significant.
RESULTS
BCR–ABL negatively regulates NO generation and iNOS expression
In a recent study, we have demonstrated that the expression of both iNOS transcript and protein is significantly less in PMNs from newly diagnosed CML patients,17 whereas its overexpression expedites neutrophilic differentiation of CML cells.27 To further identify its significance in BCR–ABL leukemogenesis, we examined the effect of imatinib, a BCR–ABL kinase inhibitor on NO generation and iNOS expression. Consistent with previous reports,32,33 imatinib (2 μM for 48 h) treatment attenuated BCR–ABL expression and induced cytostasis (G0/G1 phase arrest) and apoptosis in K562 cells (Supplemental Figs. 1A–1C). In contrast, total nitrite content, NO generation, and iNOS transcript and protein expression were significantly augmented in these cells (Supplemental Figs. 1D–1G). Imatinib-mediated up-regulation of iNOS/NO was further validated by silencing of BCR–ABL in K562 cells. Knockdown of BCR–ABL by siRNA significantly attenuated K562 cell proliferation (G0/G1 arrest), with concomitant increase in total nitrite content, NO generation, and iNOS expression (Supplemental Figs. 1A–1G). To ascertain whether expression of iNOS directly correlated with BCR–ABL expression, we performed experiments in HEK293T cells ectopically transfected with BCR–ABL plasmid (Supplemental Fig. 1A). Strikingly, overexpression of BCR–ABL in HEK293T cells (HEK293TBCR–ABL) significantly attenuated nitrite content and iNOS transcript and protein expression, whereas reduction in these parameters was significantly prevented by subjecting HEK293TBCR–ABL cells to imatinib treatment (Supplemental Figs. 1E–1G). Altogether, these experiments demonstrated that expression of iNOS inversely coupled with BCR–ABL positivity.
Expression of iNOS modulates antiproliferative and proapoptotic effect of imatinib
To investigate whether imatinib mediated cytostasis and apoptosis of BCR–ABL+ cell associated with increased iNOS expression, we assessed the effect of a general NOS inhibitor (L-NAME, 1 mM) and a specific iNOS inhibitor (1400W, 100 μM) on the proliferation and survival of K562 cells. Imatinib-induced antiproliferative and proapoptotic effect was significantly prevented in L-NAME or 1400W pretreated K562 cells (Figs. 1A–1C and Supplemental Fig. 2A). Enhanced cell proliferation and survival in iNOS knockdown K562 cells further suggest that intracellular level of iNOS is indispensable for imatinib-mediated cytostasis and apoptosis of BCR–ABL+ cells, but has no influence on the expression of BCR–ABL transcripts (Figs. 1D–1F, Supplemental Figs. 2B, and 3A–3C). Intriguingly, imatinib-mediated decrease in mitochondrial membrane potential was also prevented in L-NAME, 1400W pretreated, or iNOS siRNA transfected K562 cells (Supplemental Figs. 3D and 3E).
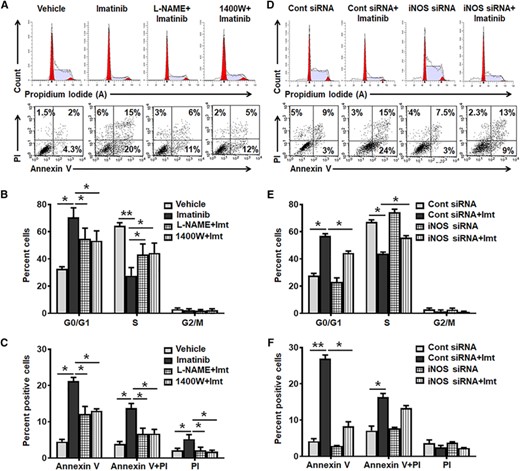
iNOS expression modulates antiproliferative and proapoptotic effect of imatinib in K562 cells. (A–C) K562 cells were pretreated with vehicle, L-NAME (1 mM), or 1400W (100 μM) for 4 h followed by imatinib (imt, 2 μM) treatment for 48 h and then FACS analyzed. Representative flow cytometric histogram and dot plot (A), and bar diagram shows cell cycle (G0/G1, S and G2/M) (B) and apoptosis (Annexin V/PI) (C) in vehicle, L-NAME, or 1400 W pretreated followed by imatinib treated K562 cells. (D–F) K562 cells were transfected with control/scramble or iNOS siRNA and 24 h post transfection cells were treated with imatinib (imt, 2 μM), and 48 h post imatinib treatment cell proliferation and apoptosis was analyzed. Representative flow cytometric histogram and dot plot (D), and quantification summary demonstrate distribution of cells in different phases (G0/G1, S, and G2/M) of cell cycle (E) and apoptosis (F) in iNOS siRNA transfected K562 cells. Data expressed as mean ± sem of 4–8 independent experiments. *P < 0.05 and **P < 0.01
Our group has shown that the overexpression of NOS isoform induced cytostasis and apoptosis in human leukemic K562 cells28; therefore, the role of iNOS on imatinib response was further validated using iNOS stably transfected K562 cells (K562iNOS). Stable overexpression of iNOS was confirmed by enhanced iNOS mRNA and protein expression leading to reduced cell cycle progression, wheras expression of BCR–ABL was impervious in these cells (Figs. 2A and 2B and Supplemental Figs. 3A–3C). Intriguingly, iNOS overexpression sensitized these cells for imatinib-induced cytostasis and apoptosis even at lower concentration of imatinib (0.1 μM) (Figs. 2A–2D and Supplemental Fig. 2C). Altogether these findings strongly implicate a critical association of BCR–ABL+ cells proliferation and survival with reduced iNOS expression, and suggest that the sensitivity of imatinib associated with iNOS expression in BCR–ABL+ cells.
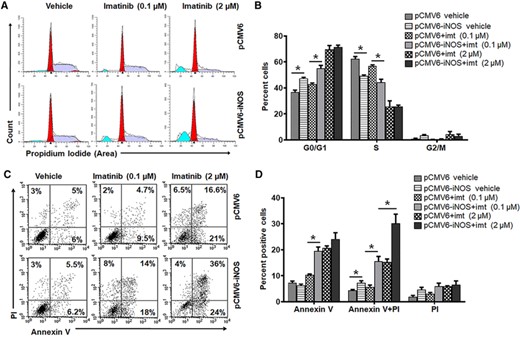
Overexpression of iNOS increases imatinib sensitivity in K562 cells. (A–D) K562 cells were transfected with pCMV6 (empty vector) or pCMV6-iNOS vector and positive clones were selected by G418 resistance. Stably iNOS transfected K562 cells were further treated with vehicle or imatinib (imt, 0.1 or 2 μM) for 48 h followed by FACS analysis. Representative flow cytometry histogram (A) and bar diagram (B) demonstrate cell phase (G0/G1, S, and G2/M) distribution in iNOS overexpressed K562 cells. Flow cytometry dot plot (C) and bar diagram (D) exhibiting apoptosis (Annexin V/PI staining) in stably iNOS transfected K562 cells. Data in bar diagram represent mean ± sem of 4–8 independent experiments. *P < 0.05
Expression of iNOS in CML patients
The ability of iNOS to attenuate BCR–ABL+ cells proliferation and survival and enhance imatinib sensitivity in in vitro studies led us to hypothesize that iNOS might play a significant role in imatinib response in CML patients. In a previous study, using peripheral blood and BM samples from CML and AML patients, we demonstrated that total nitrite level, NO generation, and iNOS expression was significantly less in PMNs obtained from these patients as compared with the healthy controls.17,34,35 In the current study, we subsequently compared NO/iNOS in PMNs from drug naive, imatinib-resistant, and responder CML patients. Results indicate that total nitrite level, NO generation, and iNOS transcript and protein expression was significantly more in PMNs of imatinib responders as compared with the newly diagnosed CML patients (Figs. 3A–3D). In contrast, NO generation and iNOS expression were significantly less in the PMNs of imatinib nonresponder CML patients as compared with the imatinib responders and healthy controls (Figs. 3A–3D). Since, PMNs from imatinib responders are more mature than those from drug naive and imatinib nonresponders, and it has been shown that the expression of iNOS was augmented with maturity of neutrophils,27 we next assessed iNOS expression in neutrophils progenitors and mature cells obtained from drug naive and imatinib nonresponders CML patients. Reduced nitrite level and iNOS expression were evident in the progenitors and mature differentiated PMNs of drug naive and imatinib-resistant CML patients and no significant differences were noted among the cells exhibiting various stage of neutrophils differentiation (Supplemental Figs. 4A–4C).
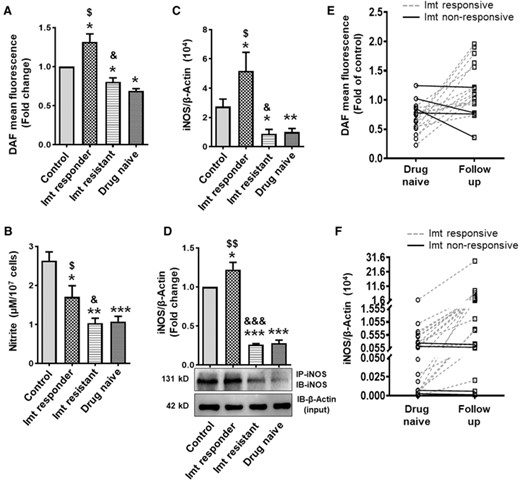
NO generation, nitrite content, and iNOS expression in PMNs of CML patients. (A) NO generation (fold change in DAF-2T mean fluorescence; control n = 78, drug naive n = 83, imatinib responder n = 74, and imatinib resistant n = 25). (B) Total nitrite content as assessed by modified Griess reagent (control, drug naive, and imatinib responder; n = 25 in each group, imatinib resistant n = 10). (C) Expression of iNOS transcript (control n = 78, drug naive n = 83, imatinib responder n = 74, and imatinib resistant n = 25) as measured by real-time PCR using β-actin as an internal loading control, and (D) iNOS protein expression (fold change) in PMNs of healthy control and CML patients (drug naive, imatinib responder, and imatinib-resistant subjects). Cell lysates were immunoprecipitated (IP) and immunoblotted (IB) with iNOS antibody. β-Actin in the aliquot of same lysate used for IP was used as loading control. DAF-2T mean fluorescence or iNOS protein expression in PMNs of healthy volunteers was considered 1 to calculate the fold change. (E and F) NO/iNOS in CML follow-up patients before and after the treatment with imatinib (400 mg/OD, duration of treatment 3 months-2.5 years). NO generation (n = 18) (E) and iNOS mRNA expression (n = 24) (F) in PMNs of CML follow-up patients. Solid and dotted line represent the imatinib nonresponsive and responsive CML follow-up patients respectively. Data expressed as mean ± sem. WB data are from 3 independent experiments. *P < 0.05, **P < 0.01, and ***P < 0.001 versus control; $P < 0.05 and $$P < 0.01 drug naive versus imatinib responder; &P < 0.05 and &&&P < 0.001 imatinib responder versus imatinib resistant. Imt, imatinib
We further conducted an experiment in a limited number of CML follow-up patients (n = 24) to assess NO/iNOS status in same individual before and after the treatment with imatinib (400 mg/OD), and the duration of treatment varied from 3 months to 2.5 years. All the follow-up patients exhibiting complete hematologic response to imatinib show improvement in PMNs NO generation and iNOS expression, and it was independent of duration of imatinib treatment (Figs. 3E and 3F). In contrast, expression of iNOS and NO level remains unchanged or decreased in the PMNs of imatinib nonresponsive CML follow-up patients (Figs. 3E and 3F). We next conducted an in vitro study using PMNs from drug naive CML patients. Similar to CML patient's findings, enhanced NO generation, iNOS expression and increased apoptosis were observed only in those PMNs showing reduction in BCR–ABL expression following in vitro treatment with imatinib (2 μM for 4 h) (Supplemental Figs. 5A–5C). Together, these findings imply a positive correlation between NO generation/iNOS expression and imatinib response (Supplemental Fig. 5D) and suggest that iNOS might be used as an early prognostic marker for identifying the patients likely to response with imatinib and imatinib nonresponders.
S-glutathionylation of NF-κB associated with decreased iNOS expression in BCR–ABL+ cells
As the levels of oxidative stress are significantly higher in CML cells10,32,36 and oxidative stress-mediated S-glutathionylation of NF-κB (p50 and p65) attenuates its binding to iNOS promoter,17,37 we next asked whether imatinib or BCR–ABL siRNA-mediated induction of iNOS depends on de-glutathionylation of NF-κB. Consistent with previous reports,10,32,36 our findings demonstrate that imatinib treatment or BCR–ABL silencing significantly attenuates the superoxide radicals and mtROS generation in K562 cells (Supplemental Figs. 6A and 6B). Notably, S-glutathionylation of NF-κB (p50 and p65) was significantly reduced in imatinib primed or BCR–ABL knockdown K562 cells (Figs. 4A and 4B). In contrast, overexpression of BCR–ABL in HEK293T cells augments oxidative stress and S-glutathionylation of NF-κB (p50 and p65), which was significantly prevented in imatinib primed HEK293TBCR–ABL cells (Fig. 4C and Supplemental Figs. 6A and 6B). Our findings in PMNs isolated from CML patients further demonstrated that the oxidative stress and S-glutathionylation of NF-κB p50 and p65 subunits were significantly higher in drug naive and imatinib-resistant CML patients, whereas it was comparable to healthy subjects in PMNs of imatinib responders and correlated with intracellular superoxide and mtROS levels in these cells (Fig. 4D and Supplemental Figs. 6C and 6D).
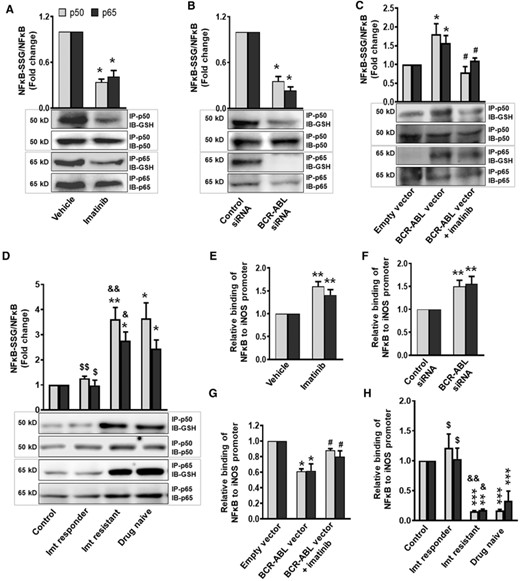
BCR-ABL through S-glutathionylation of NF-κB attenuate its binding to iNOS promoter and decrease iNOS expression. S-Glutathionylation of NF-κB (p50 and p65 subunits) in (A) imatinib treated (2 μM for 48 h) or (B) BCR-ABL siRNA transfected K562 cells, (C) BCR-ABL overexpressed HEK293T cells before and after imatinib (2 μM, 24 h) priming, and (D) in PMNs of healthy control and CML (drug naive, imatinib responder, and imatinib resistant) patients was analyzed by Western blotting. Cell lysates were immunoprecipitated (IP) with p50 or p65 antibody and immunoblotted (IB) with anti-GSH, p50 or p65 antibody. S-Glutathionylation was measured following normalization with respective protein expression. (E–H) ChIP assay demonstrating interaction of NF-κB (p50 and p65 subunits) with iNOS promoter. Cells were processed for ChIP assay using p50 or p65 antibody. The chromatin precipitates and input DNA were amplified with primers of flanking iNOS promoter region and analyzed by real-time PCR. Difference in Cp value of ChIP DNA and input DNA was used to calculate the binding of NF-κB to iNOS promoter. Relative binding of NF-κB (p50 and p65 subunits) to iNOS promoter in (E) imatinib treated or (F) BCR-ABL silenced K562 cells, (G) imatinib (2 μM, 24 h) primed HEK293TBCR-ABL cells, and (H) in PMNs of healthy control and CML patients (drug naive, imatinib responder, and imatinib resistant). NF-κB (p50 and p65 subunits) S-glutathionylation or its binding to iNOS promoter in vehicle treated/control siRNA transfected K562 cells, empty vector transfected HEK293T cells and in PMNs of healthy control was considered 1 to calculate the fold change. Data expressed as mean ± sem from 3–7 independent experiments. WB: 3–4 independent experiments. *P < 0.05, **P < 0.01, and ***P < 0.001 versus control, vehicle, control siRNA, or empty vector; $P < 0.05 and $$P < 0.01 drug naive versus imatinib responder; &P < 0.05 and &&&P < 0.001 imatinib responder versus imatinib resistant, #P < 0.05 BCR-ABL vector versus BCR-ABL vector + imatinib. Imt, imatinib
S-glutathionylation is mostly attributed to the intracellular GSH content, which accounts for more than 90% of the cellular nonprotein thiols38 and Grx maintains the intracellular GSH level as well as protein deglutathionylation.39 Our findings suggest that the intracellular GSH levels and expression of Grx1 and Grx2 transcript were significantly less in PMNs from drug naive and imatinib-resistant CML patients, whereas these parameters were comparable to control in imatinib responders (Supplemental Figs. 7A–7C). Increased expression of Grx1 and Grx2 mRNA in imatinib-treated or BCR–ABL-silenced K562 cells, which was significantly prevented following overexpression of BCR–ABL in HEK293T cells, further highlighted the role of BCR–ABL inhibition on the regulation of antioxidant enzyme system (Supplemental Figs. 7D and 7E).
Having established enhanced S-glutathionylation of NF-κB (p50 and p65) in BCR–ABL+ cells, our next objective was to investigate the DNA binding activity of nuclear NF-κB to iNOS promoter in these cells. ChIP assay clearly demonstrates that imatinib treatment or BCR–ABL siRNA-mediated de-glutathionylation of NF-κB (p50 and p65) significantly augments the DNA binding activity of NF-κB to iNOS promoter (Figs. 4E and 4F). Indeed, S-glutathionylation mediated reduced DNA binding activity of NF-κB to iNOS promoter in HEK293TBCR–ABL cells, and normalization of these parameters to the vector control level in imatinib pretreated HEK293TBCR–ABL cells further substantiated the mechanistic link between BCR–ABL expression, pro-oxidant/antioxidant balance, NF-κB S-glutathionylation, and iNOS expression (Fig. 4G). Interestingly, the PMNs from drug naive and imatinib-resistant CML patients show reduced DNA binding activity of NF-κB to iNOS promoter, in comparison with healthy control and imatinib responder CML patients (Fig. 4H).
Procaspase-3 S-glutathionylation inhibits caspase-3 activity in BCR–ABL positive cells
BCR–ABL prevented caspase 3 activity40 and our data demonstrate that inhibition of BCR–ABL by imatinib or siRNA induced caspase-3 cleavage and increased caspase-3 activity in K562 cells (Figs. 5A–5C). Indeed, stable overexpression of iNOS in K562 cells significantly enhanced the caspase-3 activity even at lower concentration of imatinib (0.1 μM) treatment (Fig. 5D). Previous studies31,41 and our findings in cell-free system suggest that procaspase-3 cleavage and activation is negatively regulated by protein S-glutathionylation (Figs. 5E and 5F). It has been observed that NO/iNOS induces PMNs apoptosis via deglutathionylation and activation of caspase-8 followed by BID truncation, caspase-9 activation, and subsequent caspase-3 deglutathionylation and activation.41 Deficiency of iNOS however attenuates the caspase-3 deglutathionylation and activation, and provide survival advantage.41 We next hypothesize that BCR–ABL-mediated decreased iNOS/NO through S-glutathionylation of procaspase-3 regulates the survival of CML cells. To test this, we first assessed the S-glutathionylation of procaspase-3 in the PMNs of drug naive, imatinib responder, and imatinib-resistant CML patients. As shown in Figur 5G, S-glutathionylation of procaspase-3 was significantly higher in PMNs of drug naive and imatinib-resistant CML patients, whereas it was normalized to control level in PMNs of imatinib responders. To further validate these findings, we assessed procaspase-3 S-glutathionylation in an in vitro imatinib-treated or BCR–ABL knockdown K562 cells. Interestingly, S-glutathionylation of procaspase-3, evident in K562 cells, was significantly attenuated following treatment with imatinib or BCR–ABL knockdown (Fig. 5H).
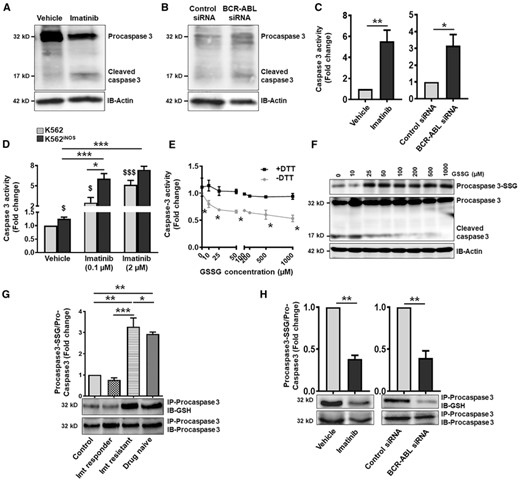
S-glutathionylation of procaspase-3 inhibit caspase-3 activity in BCR-ABL positive cells. Cleavage of procaspase-3 in (A) imatinib treated (2 μM, 48 h) or (B) BCR-ABL siRNA transfected K562 cells. β-Actin represent the loading control. (C) Caspase-3 enzyme activity as measured by acetyl-Asp-Glu-Val-Asp-7-amino-4 methylcoumarin in imatinib treated or BCR-ABL knockdown K562 cells. (D) Caspase-3 activity (represented as fold change) in control (pCMV6) and iNOS stable transfected (pCMV6-iNOS) K562 cells following treatment with imatinib (0.1 and 2 μM, 48 h). $P < 0.05 and $$$P < 0.01 versus K562 vehicle. (E and F) Lysate of healthy subjects PMNs were treated with different concentration of GSSG (0–1 mM) ± DTT (1 mM) for 90 min at room temperature and caspase activation were performed by adding cytochrome c (10 μM) and dATP (1 mM). (E) Caspase-3 activity and (F) procaspase-3 S-glutathionylation was analyzed. (G and H) S-Glutathionylation of procaspase-3 in PMNs of healthy control and CML patients (G), and in imatinib treated or BCR-ABL silenced K562 cells (H). Cell lysates were immunoprecipitated with procaspase-3 antibody and blotted with anti-GSH or procaspase-3 antibody. Procaspase-3 S-glutathionylation was measured following normalization with total procaspase-3 protein expression. Caspase-3 activity or procaspase-3 S-glutathionylation in vehicle treated/control siRNA transfected K562 cells and in PMNs of healthy control was considered 1 to calculate the fold change. Data represent mean ± SEM of 3–5 independent experiments. WB: 3 independent experiments. *P < 0.05, **P < 0.01, and ***P < 0.001. Imt, imatinib
Collectively, our data suggest that the expression of iNOS is a critical regulator of imatinib sensitivity in BCR–ABL+ cells. BCR–ABL inhibition by imatinib or siRNA through deglutathionylation of NF-κB (p50 and p65 subunits) enhanced its binding to iNOS promoter and induced iNOS transcription, which subsequently augmented caspase-3 activity following procaspase-3 deglutathionylation and attenuated BCR–ABL+ cell survival.
DISCUSSION
The application of iNOS as a predictive biomarker and drug target is rapidly emerging as an attractive candidate in cancer therapy. NO/iNOS is critical for cell proliferation, survival, and differentiation,3,42 and depending on its concentration, activity, and localization, it exerts distinct effects on the lymphocytic and myelomonocytic cells.4 NO producing prodrugs, nitrooxy DOX and 3-phenylsulfonylfuroxan DOX, by decreasing the activity of ATP-binding cassette (ABC) transporters, induction of nitrosative stress, and activation of caspase-3, -9 promotes apoptosis of resistant leukemic cells.16 Studies conducted on hematopoietic stem cells derived from CML patients and K562 cells also demonstrated the cytostatic/cytotoxic effect of NO donors.12,43 Conversely, continuous endogenous expression of iNOS in K562 cells diminished growth rate and induced erythrocytic differentiation44; however, clear evidence of iNOS on BCR–ABL+ cell growth and survival, and its correlation with imatinib response, is still not fully understood. In the present study, we by undertaking a direct comparison between drug naive, imatinib responder, and resistant CML patients demonstrated that nitrite content, NO generation, and iNOS expression were several fold more in the PMNs of imatinib responders showing complete hematologic response (CHR) as compared with the PMNs of drug naive and imatinib-resistant CML patients, and in patients not achieving CHR. Most of the BCR–ABL positive cells are replaced by mature nonleukemic myeloid cells in imatinib responders, whereas these cells remained apparent in patients who responded poorly to imatinib. Normalization of NO/iNOS in imatinib responders to the level of healthy volunteers thus corresponds with the removal of BCR–ABL positive cells. Our in vitro observations in K562 and HEK293TBCR–ABL cells further confirmed an inverse correlation between BCR–ABL and NO/iNOS status. Hence, monitoring of iNOS expression post imatinib therapy may serve as an early prognostic indicator to identify potential poor responders to imatinib therapy or the development of resistance to imatinib.
NO donors cause tumor regression in both imatinib-sensitive and resistant CML cells14,15; however, the half-life of NO is very short and in whole blood it rapidly oxidized into nitrite and nitrate.45–47 Thus, for a potent antitumorigenic response, it is essential to determine that NO synthesized and secreted inside the leukemic cells. Ghalaut et al.48 have shown that the circulating nitrite content, as assessed by Griess assay, is significantly high in CML patients and it reduced following treatment with imatinib and more so by cotreatment with turmeric powder. In contrast, Jain et al.34 following enzymatic reduction of nitrate into nitrite demonstrated decreased level of total nitrite content in the plasma and PMNs of CML patients, and profound increase in plasma nitrite content was noted in CML patients treated with second-generation tyrosine kinase inhibitors dasatinib and nilotinib.49 This controversial result could be linked to the kind of the patients included, efficiency of nitrate to nitrite reduction, and the deproteinization of plasma/serum samples.
Rakshit et al.50 have shown that imatinib treatment enhances NO generation in K562 cells and scavenging of intracellular ROS by N-acetyl cysteine enhances imatinib sensitivity through stimulation of eNOS-mediated NO generation. Other reports further imply that the suppressive ability of farnesyltransferase inhibitors, ICB3E; a synthetic analogue of Piper betel, IFNα, simvastatin, and tamoxifen on BCR–ABL+ cells, depends on iNOS, and reversed in presence of NOS inhibitor L-NAME.12,51–53 Recent report from our laboratory has demonstrated that the overexpression of iNOS in human leukemic K562 cells enhanced neutrophilic differentiation, as well as cytostasis and apoptosis of these cells.27,28 Present study demonstrates that imatinib or BCR–ABL siRNA mediated growth inhibition and apoptosis of BCR–ABL+ cells linked with increased iNOS expression. Noticeable reduction in imatinib-induced cytostasis and apoptosis in L-NAME, 1400W pretreated, or iNOS knockdown K562 cells highlighted the importance of iNOS in BCR–ABL+ cell growth and survival. Enhanced sensitivity of imatinib in iNOS overexpressed K562 cells further substantiated the importance of iNOS in imatinib response. Overall, these data suggest that expression of iNOS influence the treatment outcome of imatinib, and can be used to personalise therapy.
Besides inhibition of BCR–ABL signalling, imatinib also potently attenuated the expression of stem cell factor receptor protein tyrosine kinase (c-kit), platelet-derived growth factor receptor (PDGFR)α and (PDGFR)β, nonreceptor tyrosine kinase, Abl, and discoidin domain receptors (DDR1 and DDR2).54–56 Michurina et al.57 have shown that in vivo inhibition of NOS activity enhanced the proportion of c-kit+ cells in the BM followed by an increase in the neutrophils count. Indeed, BM mesenchymal stromal cells mediated myeloid cell differentiation and hematopoietic reconstitution was largely dependent on iNOS expression.58 Concomitantly, NO negatively regulates PDGF-mediated proliferation of vascular smooth muscle cells and induction of the anti-apoptotic protein, survivin, and maintains luminal remodeling and vascular quiescence.59 These studies suggest that NO also plays a crucial role in the regulation of other pathways that imatinib modulates, and warrant further investigations.
Expression of iNOS is predominantly regulated at the transcriptional level,60 although translational and post-translational mechanisms are also active.61,62 It has been known that NF-κB regulates iNOS expression and human iNOS promoter contain NF-κB binding motifs at −5.5, −5.8, and −6.1 kb.63,64 In a recent study, we demonstrated that NOX2 and mtROS-mediated enhanced NF-κB S-glutathionylation attenuated its binding to iNOS promoter and decreased iNOS expression in PMNs of drug naive CML patients.17 This traffic is also likely to happen in imatinib-mediated induction of iNOS in BCR–ABL+ cells, and our findings in PMNs of imatinib responder and resistant CML patients as well as in vitro studies provide compelling evidence that inhibition of BCR–ABL by imatinib or siRNA by attenuating free radicals generation with a concomitant increase in Grx1 and Grx2 cellular redox enzymes attenuates NF-κB S-glutathionylation, leading to enhanced binding to iNOS promoter and increased iNOS transcription.
BCR–ABL prevents activation of several crucial proteins of the apoptotic cascade including caspase-3 and caspase-9, and its binding to Apaf-1.65 Caspase-3 cleavage and activation play a central role in the cell apoptosis and is responsible for the deliberate disassembly of a cell into apoptotic bodies.31 S-glutathionylation of procaspase-3 (p17cys163 and p12cys220) inhibited proteolytic activation of cytochrome c and prevents caspase-3 activation,31 deglutathionylation of procaspase-3, however, promotes TNF-α-induced apoptosis.66 Studies from our laboratory has observed that iNOS mediated deglutathionylation of procaspase -3, -8, and -9 associated with caspase activation and apoptosis of PMNs.41 Using cell-free system as well as PMNs of drug naive, imatinib responder and imatinib-resistant CML patients, and in vitro studies in imatinib treated or BCR–ABL–silenced K562 cells, we demonstrated that deglutathionylation of procaspase-3 is indispensable for the apoptosis of BCR–ABL+ cells. Imatinib hypersensitivity and increased caspase-3 activity in iNOS-overexpressed K562 cells further emphasized the importance of iNOS in procaspase-3 deglutathionylation and activation.
In summary, the present study suggest that the expression of inducible NOS is indispensable for the antiproliferative and proapoptotic effect of imatinib in BCR–ABL positive cells. Mechanistically, we provide evidence that imatinib by attenuating S-glutathionylation of NF-κB (p50 and p65 subunits) enhanced its binding to iNOS promoter and pronounced iNOS transcription. Furthermore, this study also suggests that the imatinib-mediated iNOS/NO via deglutathionylation and activation of caspase-3 promote apoptosis of BCR–ABL+ cells; however, involvement of other regulatory pathways cannot be ruled out. Altogether, this study highlights the importance of iNOS in BCR–ABL+ cell growth and survival, and suggests that monitoring of iNOS expression in CML patients undergoing imatinib therapy could be beneficial to identify the patients most likely to respond or who have a high risk of developing imatinib resistance.
AUTHORSHIP
A.K.S. performed most of the experiments and was involved in analyzing the data and writing the manuscript. D.A. generated K562iNOS cells and performed related experiments. M.D. and S.N. helped in human PMNs isolation and associated experiments. M.K.B. provided critical suggestions during the experiments. T.C. provided healthy volunteers blood samples. A.K.T. provided the CML patient's blood samples and was involved in finalizing the manuscript. M.D. designed and conceptualized the work and was involved in writing and finalizing the manuscript.
ACKNOWLEDGMENTS
The study was supported by a financial grant to M.D. from Department of Biotechnology-INDIGO, and from JC Bose fellowship. Awards of research fellowships to A.K.S., D.A., and M.D. from the Council of Scientific and Industrial Research and S.N. from University Grants Commission, India are acknowledged. The technical help of Mr. A.L. Vishwakarma and Mrs. M. Chaturvedi of the Flow Cytometry Facility, CSIR-Central Drug Research Institute, Lucknow is also gratefully acknowledged.
DISCLOSURES
The authors declare no conflicts of interest.
REFERENCES
Abbreviations
- BM
Bone marrow
- ChIP
Chromatin immunoprecipitation
- CHR
complete hematologic response
- CML
chronic myeloid leukemia
- DAF-2DA
4, 5-diaminofluorescein diacetate
- DHE
dihydroethidium
- DTT
1,4-Dithiothreitol
- Grx
glutaredoxins
- GSH
glutathione
- HEK293TBCR-ABL
BCR-ABL expressing HEK293T
- iNOS
inducible nitric oxide synthase
- JC-1-5
5′,6,6′-tetrachloro-1,1′,3,3′-tetra-ethyl-benzimidazocarbo-cyaniniodide
- K562iNOS
iNOS overexpressing K562
- L-NAME
L-NG-Nitroarginine methyl ester
- mtROS
mitochondrial reactive oxygen species
- MSR
mitoSOX red
- mBrB
monobromobimane
- NF-κB
Nuclear factor kappa B
- NEM
N-ethylmaleimide
- NO
nitric oxide
- NOX2
NADPH oxidase 2
- PMNs
neutrophils
- ROS
reactive oxygen species
- 1400W
N-[[3-(aminomethyl)phenyl]methyl]-ethanimidamide, dihydrochloride
