


Abstract
Atherosclerosis (AS) is the principal cause of heart attack, sudden cardiac death, stroke, and necrosis of the extremities, in which significant changes in gene expression associated with inflammation are found. However, the molecular mechanisms of AS are not clearly elucidated. In this study, ApoE−/− mice were fed with a high fat diet for 12 weeks to induce atherosclerosis and half of the mice were treated with tanshinone IIA (TAN). Then sequencing analysis was performed to investigate the expression patterns of ncRNAs in AS plaques obtained from mice treated with TAN and AS Model mice. A total of 22 long noncoding RNAs (lncRNAs), 74 microRNAs (miRNAs), 13 circular RNAs (circRNAs), and 1359 mRNAs in AS plaque were more significantly regulated from TAN mice, compared with model mice. Bioinformatics tools and databases were employed to investigate the potential ncRNA functions and their interaction. Our data showed that the most significantly pathways regulated by TAN were associated with inflammation, and involved in the signaling pathways of Ras, Rap1, MAPK, cAMP, T cell receptor, and so on. In addition, the competitive endogenous RNA (ceRNA) network had been constructed and the core nodes included circ-Tns3/let-7d-5p/Ctsl, circ-Wdr91/miR-378a-5p/Msr1, and circ-Cd84/ miR-30c/ Tlr2. The DERNAs were validated by quantitative RT-PCR and dual luminescence reporter assay in RAW264.7 cells in vitro. This study identified ceRNAs network regulated by TAN and elucidated the ncRNAs profile and signal pathways to attenuate AS comprehensively. This research would contribute to further research on the pathogenesis of AS, and facilitate the development of novel therapeutics targeting ncRNAs.
Introduction
Atherosclerosis (AS) is the most important inducement of heart attack, stroke, and sudden cardiac death. The lesions arise from an excessive, inflammatory-fibro proliferative response to some of the damage in the endothelial cells and smooth muscle of the artery wall related with retained low-density lipoprotein (LDL) particles.1 It is well known that atherosclerosis is a chronic inflammatory disease that is mainly caused by endogenous modified proteins initially, such as ox-LDL, and then activates the innate and adaptive immune responses. A variety of cells are involved in this process, such as endothelial cells, T lymphocytes, monocyte/Mϕ, NK cells, dendritic cells, and so on.
The atherosclerotic process is associated with gene expression changes in several activated pathways. Tanshinone IIA (TNA) is the major component extracted from the root of Salvia miltiorrhiza. Research found TNA has several pharmacological functions in clinical, such as anti-bacteria, anti-inflammation, and obvious antitumor. TAN has been used in the treatment of cardiovascular diseases in China for decades. It has been reported that TNA can act as a natural anti-oxidant to reduce myocardial oxygen consumption and anti-atherosclerosis. However, the therapeutic molecular mechanisms of TNA are not fully elucidated.
Noncoding RNAs (ncRNAs) comprise a category of RNA molecules that typically cannot encode proteins but functionally regulate protein expression.2 ncRNA http://genes include certain ample and functional RNAs, such as microRNAs, siRNAs, long ncRNAs, and so on.3 ncRNAs are involved in many biological processes, and the mutations or imbalances of the repertoire could cause multifarious of diseases. Although ncRNAs have been confirmed to play a role in AS pathogenesis, the exact effects of ncRNAs in AS still remain unknown. In this study, sequencing analysis was performed to investigate the expression patterns of ncRNAs in AS from mice treated with TAN and the AS Model mice fed with a high fat diet with background of ApoE gene knockout, and then the comparison between them was made.
Our study is aimed to identify the dynamic network of inflammation, and optimally balance the levels of genes and protein activation regulated by TAN to attenuate atherosclerosis. We try to explore the mechanism of TAN on regulating the genes encoding and develop new diagnostic and therapeutic agents of AS.
Materials and Methods
Treatment of mice
Apolipoprotein E–deficient (ApoE−/−) mice with C57BL/6 background (10 mice for each group) were obtained from Beijing Vitalriver Experimental Animal Technology Co, Ltd. (Beijing, China). ApoE−/- male mice were fed with a high-fat diet containing 21% butter fat and 0.15% cholesterol (Specialty Feeds) for a period of 12 weeks4,5 commencing at 8 weeks of age. Meanwhile, ApoE−/− mice in TNA group were treated with 10 mg/kg TNA (> 98.0% pure, Sigma–Aldrich, USA, dissolved in 10% DMSO/PBS, v/v) by intraperitoneal injection once a day. For mice in model group, 10% DMSO/PBS (v/v) was administered instead. Afterward, the mice were anesthetized with 5% isoflurane, and the proximal aorta were collected for histological and molecular studies respectively. Blood was collected from heart for the detection of plasma triglycerides and cholesterol. The study was conducted in accordance with the NIH Guide for the Care and Use of Laboratory Animals. All protocols were approved by the Animal Ethics Committee of Liaoning University of Traditional Chinese Medicine.
H&E and oil red O staining of aorta
For H&E staining, paraffin sections were deparaffinized with alcohol, and dyed with hematoxylin for 10 min, then color separation with 10% hydrochloric acid in alcohol for 10 s, backed to blue by 0.5% ammonia, and dyed with eosin for 5 min, gradient dehydrated with alcohol. Finally, the slides were observed under a microscope.
For oil red O staining, the aorta was embedded in OCT compound and frozen at −80°C, then been cut into 6-μm sections. The sections were placed into isopropanol for 5 min, and then stained with 0.5% Oil Red O/isopropanol solution for 30 min. Afterwards, the sections were treated as described in H&E staining. Then the average area of lipid accumulation within lesions of the aorta slice and the percentage of the positive staining on the aortic intima were quantified separately by Oil-Red O staining using Image Pro (Silver Springs, MD).
RNA isolation and sequencing
Total RNA was extracted from the aorta of TAN mice and Model mice. For RNA isolation, an RNeasy plus Mini Kit (QIAGEN) was used. The RNA concentration was detected by the RNA Assay Kit (Life Technologies, CA, USA). For RNA-seq analyses, RNA samples were analyzed by Ori-gene Science and Technology Corp., LTD. Libraries for RNA-seq were made using the TruSeq Stranded mRNA Library Prep kit (Illumina) per manufacturer instructions. Libraries were pooled together, resulting in 10G mapped reads for each sample. The data have been submitted to NCBI-Sequence Read Archive database (accession: PRJNA604080) and will be released upon publication.
GO annotations and KEGG pathways analysis
GO analysis was applied to elucidate genetic regulatory networks by forming hierarchical categories according to the differentially expressed genes (http://www.geneontology.org). Pathway analysis was performed to explore the significant pathways of the differentially expressed genes in terms of KEGG (http://www.genome.jp/kegg/).
Construction of the ceRNA network
Competitive endogenous RNAs can bind to miRNAs through miRNA response elements (MREs), which affects the expression of genes regulated by miRNAs.6 As known, lncRNAs/circRNAs can compete with each other to interact with miRNAs.7 Thus, we constructed a ceRNA network for lncRNA/circRNA-miRNA-mRNA interactions. First, the differentially expressed RNAs (DERNA, including lncRNA, circRNA, miRNA and mRNA) with an FDR < 0.01, |logFC| > 1, and P-value < 0.01 were retained. The regulation between the lncRNAs/circRNAs and miRNAs was predicted by using mirtarbase (http://mirtarbase.mbc.nctu.edu.tw) and miRWalk (http://mirwalk.umm.uni-heidelberg.de/). The target genes were predicted for the miRNAs by TargetScan (http://www.targetscan.org) and StarBase (http://starbase.sysu.edu.cn). Next, we identified the intersection of common miRNAs and mRNAs among DERNAs and the predicted RNAs. The co-expression networks were drawn by using Cytoscape 3.7.1 software based on the screening of lncRNA-miRNA pairs, circRNA-miRNA pairs, and miRNA-mRNAs pairs. To find out the key RNAs in the ceRNA network, we generated the diagram with Venny 2.1.0 (https://bioinfogp.cnb.csic.es/tools/venny/index.html).
Validation of DERNAs by realtime quantitative RT-PCR
To perform the molecular studies, Mϕs were isolated from plaques by cold enzyme digestion and purified with gate of F4/80+ by fluorescent-activated cell sorting (FACS). To find if the mechanism was different between in vivo and in vitro, RAW264.7 cells were treated with TNA or miRNAs inhibitors or circRNAs mimics in vitro for quantitative RT-PCR (qRT-PCR) analysis.
qRT-PCR was performed with TaqMan miRNA probes (Applied Biosystems). Briefly, total RNA was reverse transcribed to cDNA with AMV reverse transcriptase (Takara) and a stem-loop RT primer (Applied Biosystems) or RT primer. Real-time PCR was performed with a TaqMan PCR kit and an Applied Biosystems 7900 Sequence Detection System (Applied Biosystems). RNA expression levels were determined by 2−ΔΔCt method and normalized to β-actin and U6 for lncRNAs/circRNAs and miRNAs, respectively. The specific primers/sequences for amplifying of circRNAs, lncRNA, miRNAs, and mRNA are listed in Tables 1 and 2.
Primers used for qPCR
| Gene | Sequences of primers | Product length | NCBI Reference Sequence |
|---|---|---|---|
| β-actin | F 5′- CATCCGTAAAGACCTCTATGCCAAC- 3′ | 171 bp | NM_007393.5 |
| R 5′- ATGGAGCCACCGATCCACA-3′ | |||
| Tlr2 | F 5′- CGTTGTTCCCTGTGTTGCT-3′ | 119 bp | NM_011905.3 |
| R 5′- AAAGTGGTTGTCGCCTGCT-3′ | |||
| Msr1 | F 5′- CCAAGTCCTTGCAGAGTCTG-3′ | 237 bp | NM_ 001113326.1 |
| R 5′- GTCTGAGGTCGTTGGTGATG -3′ | |||
| Mrc1 | F 5′- GTCTGAGTGTACGCAGTGGTTGG-3′ | 85 bp | NM_ 008625.2 |
| R 5′- TCTGATGATGGACTTCCTGGTAGCC-3′ | |||
| Ctsl | F 5′- GACCGGGACAACCACTGTG- 3′ | 64 bp | NM_ 009984.4 |
| R 5′- CTACCCATCAATTCACGAC-3′ |
F, forward; R, reverse.
Primers used for qRT-PCR
| RNA name | Primer |
|---|---|
| miR-378a | F 5′-CTGACTCCAGGTCCTGTG-3′ |
| R 5′-GAACATGTCTGCGTATCTC-3′ | |
| let-7d | F 5′-GAGGTAGTAGGTTGCATAG -3′ |
| R 5′-GAACATGTCTGCGTATCTC -3′ | |
| miR-146b | F 5′- GAGAACTGAATTCCATAGGC -3′ |
| R 5′- GAACATGTCTGCGTATCTC -3′ | |
| miR-378c | F 5′-ACTGGACTTGGAGTCAGAA-3′ |
| R 5′-GAACATGTCTGCGTATCTC-3′ | |
| miR-30c | F 5′- TGTAAACATCCTACACTCTC -3′ |
| R 5′- GAACATGTCTGCGTATCTC -3 | |
| circ-Cd84 | F 5′- CTGACTCTGTCACTGTCCAGCA-3′ |
| R 5′-CAGGACAATCCTGTCTCGCCTT-3′ | |
| circ-Wdr91 | F 5′-TACCTGGAACGCAGGCTCTTCA -3′ |
| R 5′-GCAAAGAACTCCTGTGCCTTGTC-3′ | |
| circ-Tns3 | F 5′-GAATGCCCTTGGCATCTCAGCT-3′ |
| R 5′-GATGCTCAGCTTACGAAGCCGT-3′ | |
| lnc-Pirb | F 5′-CACAACCTCTCCTCTGAGTGGT-3′ |
| R 5′-GTCCATTGACCAACACAGCAGG-3′ |
F, forward; R, reverse.
Dual luminescence reporter assay
The sequences of circ-Cd84 (SLAMF5), circ-Wdr91, circ-Tns3, Ctsl, Msr1, and Tlr2 3′-UTR comprising miR-30c/let-7d-5p/miR-378a-5p binding site were synthesized and, respectively, inserted into pMIR-REPORT™ vector (Ambion) to construct luciferase vector. Next, miRNAs mimics/miR-NC (synthesized by GenePharma, Shanghai, China) and above luciferase vector were co-transfected into RAW264.7 cells. For measurement of luciferase activity, a procedure based on the protocol of Dual-Glo luciferase reporter assay (Promega, WI, USA) was used and detected by GloMax® 20/20 Luminometer (Promega) 48 h after co-transfection.
Statistical analysis
Statistical analyses in 2 groups were performed using a 2-tailed Student’t-test. For multiple comparisons, P-value was determined by 2-way ANOVA followed by a Bonferroni posttest. All analyses were performed with GraphPad Prism 5 software. A value of P < 0.05 was considered to be statistically significant. Data are shown as mean ± sd.
Results
The levels of plasma cholesterol and triglycerides
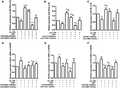
The plasma triglycerides (TG), total cholesterol (TC), HDL-C (cholesterol), VLDL-C, and LDL-C were measured in mice. Compared with mice in model group, the levels of TG, TC, LDL-C, and VLDL-C were lower, while HDL-C were higher in mice of TAN group, but the levels of them showed no significant difference compared with model group (P > 0.05; Fig. 1A).
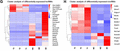
The levels of plasma cholesterol and triglycerides, histology of atherosclerotic lesions, and the RNAs expression profiling of proximal aortas from Model mice and TAN-treated mice. (A) The plasma triglycerides (TG), total cholesterol (TC), HDL-C, LDL-C, and VLDL-C were measured in mice. n = 5. The lesion area in atherosclerotic plaques and the percentage of AS plaque area in the aortic intima were analyzed using Image Pro and shown in the histograms separately; (B) The lipid accumulation in atherosclerotic plaque (yellow-labeled) was assessed by H&E or Oil red O staining in atherosclerotic plaque (×100) and aortic intima. (C) Volcano plot indicate up- and down-regulated genes in proximal aortas of TAN group compared with Model group; (D) Heat map showing hierarchical clustering of changed genes. In clustering analysis, up- and down-regulated genes are colored in red and blue, respectively. (E) Volcano plot indicate up- and down-regulated miRNAs in proximal aortas of TAN group compared with Model group; (F) Heat map of miRNAs showing hierarchical clustering of changed miRNAs of in proximal aortas of TAN group compared with Model group. In clustering analysis, up- and down-regulated genes are colored in red and green, respectively. Heat map of lncRNAs (G) or circRNAs (H) showing hierarchical clustering of changed circRNAs/lncRNAs in proximal aortas from TAN mice compared with Model mice; In clustering analysis, up- and down-regulated genes are colored in red and blue, respectively
Histology of atherosclerotic lesions
Atherosclerosis assessment was done via intimal lesion areas of atherosclerotic lesions by H&E staining and lipid accumulation by Oil Red O staining. The lesion areas shown by H&E staining were obviously reduced in TAN group, compared with model group (P < 0.01). The lipid accumulation shown by Oil Red O staining in atherosclerotic plaque and aortic intima was decreased significantly in TAN group versus model group (P < 0.01), shown in Fig. 1B. The results suggested that TAN could attenuate lipid accumulation in aorta and improve the restore of atherosclerotic lesions.
The expression profiling changes of genes in proximal aortas
Volcano Plot indicates 605 up-regulated and 754 down-regulated genes (mRNAs) in proximal aortas from TAN group compared with Model group, as shown in Fig. 1C; heat map showed the hierarchical clustering of changed genes. In clustering analysis, up- and down-regulated genes are colored in red and blue, respectively (Fig. 1D).
The expression profiling changes of miRNAs in proximal aortas from ApoE−/− mice and WT mice
Forty-three up-regulated miRNAs and 31 down-regulated miRNAs in proximal aortas from TAN group compared with Model group are shown in the volcano plot (Fig. 1E); In clustering analysis, up- and down-regulated genes are colored in red and green, respectively. Heat map of miRNAs showed the hierarchical clustering of changed miRNAs of in proximal aortas of TAN group compared with Model group (Fig. 1F).
The expression profiling changes of lncRNAs and circRNAs in proximal aortas from mice
Four up-regulated and 9 down-regulated circRNAs, as well as 18 up-regulated and 4 down-regulated lncRNAs in proximal aortas of TAN group compared with Model group are shown in heat map. The details of the lncRNAs and circRNAs are shown in Fig. 1G and 1H, respectively.
GO analysis of miRNAs target genes
We used Gene Ontology database (http://www.geneontology.org) to perform GO analysis on the miRNA target genes. The 508 up-regulated and 449 down-regulated genes were analyzed individually. P-value and FDR was calculated by Fisher’s exact test and multiple comparisons test respectively (P < 0.05). Around 197 differentially expressed genes were classified in the light of GO term, including biological process, molecular function, and cellular component (Fig. 2A).
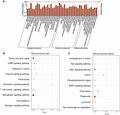
GO and enriched KEGG pathway analysis in proximal aortas of Model mice and TAN-treated mice. GO analysis in proximal aortas. The significant molecular function, biological process, and cellular component changed mRNAs targeted miRNAs in proximal aortas of TAN treated mice. The number and percent of genes in GO term were showed in histography (A). The mRNAs enriched KEGG pathway histogram showing statistics of pathway enrichment in proximal aortas from TAN treated mice. The abscissa represents signal pathway and the ordinate represents the number of statistics of mRNAs enriched KEGG pathway in proximal aortas from TAN treated mice compared with Model mice. Up- and down-regulated signaling pathways are shown in the histograms (B and C, respectively)
Analysis of mRNAs enriched KEGG pathway
Pathway enrichment analyses in proximal aortas from mice were performed based on KEGG pathway analysis by using either Chi-square test or Fisher’s exact test. Pathways with more annotations in the differentially expressed genes (P < 0.05) were considered significantly enriched. One hundred sixty-four up-regulated and 173 down-regulated signaling pathways were found in TAN mice. A number of up-regulated genes are linked to thyroid hormone signal, cAMP signaling pathway, cancer pathways, oxytocin signaling pathway, endocytosis, chemokine signaling pathway, T cell receptor signaling pathway, sphingolipid signaling pathway, axon guidance, glucagon signaling pathway, and so on, as shown in Fig. 2B. Down-regulated genes mainly participate in the pathways of proteoglycans in cancer, Ras signaling pathway, Rap1 signaling pathway, Phosphatidylinositol signal, MAPK signaling pathway, endocytosis, phagosome, glycosaminoglycan degradation, lysosome, and so on, as shown in Fig. 2C.
Construct of ceRNAs network
Since MREs are the mediators of lncRNA-miRNA interaction, we utilized the online website to identify relationships between the 22 DElncRNAs, 13 DEcircRNAs, 74 DEmiRNAs, and 1359 DEmRNAs. Furthermore, we selected pairs with the strong correlations to construct the lncRNAs (circRNAs)-miRNAs-mRNAs network. The interacted networks indicated that the co-expression patterns of miRNA, lncRNAs, circRNAs, and mRNAs in atherosclerotic plaques (Supplementary Fig. 1). In this network, each gene corresponds to a node, and the connection of two genes is represented by an edge that indicates an obvious negative correlation. A degree is defined as the number of directly linked neighbors. The main circRNAs, lncRNAs, miRNAs, and mRNAs in the network are shown in different color in Supplementary Fig. 1. The size of the node was directly proportional to the degree. The noteworthy nodes appeared in a co-reposition in the regulated network, which is more closely related to TAN treatment on AS.
The lncRNAs-miRNAs-mRNAs network included 15 miRNAs, 18 lncRNAs (down-regulated by TAN), and 18 mRNAs (Supplementary Fig. 1A). Since 4 lncRNAs (up-regulated by TAN) could not set out the relation network with other miRNA the mRNAs, the data were not shown. The circRNAs (up-regulated by TAN)-miRNAs-mRNAs network included 2 miRNAs, 1 circRNAs, and 104 mRNAs (Supplementary Fig. 1B). The circRNAs (down-regulated by TAN)-miRNAs-mRNAs network included 16 miRNAs, 6 circRNAs, and 60 mRNAs (Supplementary Fig. 1C). The list of ceRNAs is shown in Supplementary Table 1.
To find out the key RNAs in the ceRNA network, we generated the diagram with Venny 2.1.0 as shown in Supplementary Fig. 2A. Venn diagram showed the number of unique and shared RNAs experimentally identified in the ceRNA network. The result showed 35 co-expression miRNAs and 4 co-expression mRNAs (Msr1, Mrc1, Ctsl, and Tlr2) were shared in the 4 groups. We selected 5 miRNAs (miR-146b-5p, miR-378c, miR-30-2-3p, miR-378a-5p, and let-7d-5p) from the 35 miRNAs that could target the 4 genes by predicted. Then 1 lncRNA (lncRNA-Pirb) and 5 circRNAs (circ-Cd84, circ-Wdr91, circ-Adgre, circ-Abca1, and circ-Tns3) were selected that could be targeted by the 5 miRNAs. The regulated relationship is shown in the table of Supplementary Fig. 2B.
Validation of DERNAs by realtime qRT-PCR
Total RNA was extracted from the Mϕs in proximal aorta of TAN treated mice and Model mice. The quantitation of DERNAs aforementioned was detected by using qRT-PCR to validate the expression in samples. The results showed these 4 genes were down-regulated by TAN significantly as compared to Model control (P < 0.01), shown in Fig. 3A.
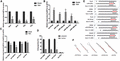
The quantitation of RNAs to validate the predicted results. The quantitation of mRNAs (A), miRNAs (B), and circRNAs/lncRNAs (C) associated with inflammation in Mϕs isolated from plaques was detected by qRT-PCR to validate the results of RNA-seq analysis of aorta. n = 3. **P < 0.01 versus Model group, n = 3/group. qRT-PCR analysis of the location of circ-Cd84, circ-Wdr91, circ-Tns3, and lnc-Pirb in RAW264.7 cells (D). The predicted secondary structure of miRNAs binding with circRNAs or mRNAs (E). The 2D construction of miRNAs and the predicted binding site with relative mRNAs are shown (F)
With the significant difference of miRNAs between TAN mice and Model mice, we selected miR-146b-5p, miR-378c, miR-30-2-3p, miR-378a-5p, and let-7d-5p to validate the expression of the miRNAs. It showed that the levels of miR-146b-5p were lower in TAN group than model group (P < 0.01), and the levels of miR-378c, miR-30-2-3p, miR-378a-5p, and let-7d-5p were higher in TAN group than the Model group (P < 0.05) as shown in Fig. 3B. Since the tendency of miR-146b-5p was opposite to other miRNAs, we only focus on the other 4 miRNAs (miR-378c, miR-30-2-3p, miR-378a-5p, and let-7d-5p) in the next study.
Three circRNAs (circ-Cd84, circ-Wdr91, circ-Tns3) and 1 lncRNA (lncRNA-Pirb) were down-regulated by TAN significantly as compared to Model control (P < 0.01 or 0.05), shown in Fig. 3C. The levels of circ-Adgre and circ-Abca1 were not detected.
circRNAs directly interacts with miRNAs in RAW264.7 cells by dual luminescence reporter assay
We found that circ-Cd84 (SLAMF5), circ-Wdr91, and circ-Tns3 were mainly located in the cytoplasm. The level of lnc-Pirb was low in both cytoplasm and nucleus of cells (Fig. 3D). Given that cytoplasmic circRNA mainly functions by acting as an effective molecular sponge for miRNAs, we thus searched for miRNAs that might be adsorbed by these 3 circRNAs via using miRWalk online. Only 4 miRNAs (miR-378a-5p, miR-378c, let-7d-5p, and miR-30c) were predicted to harbor 3 circRNAs binding site (Fig. 3E). The 2D construction of miRNAs and the predicted binding site with relative mRNAs are shown in Fig. 3F.
To confirm this prediction, we performed the luciferase reporter assay in RAW264.7 cells. The results showed that enforced expression of miR-30c, miR-378a-5p, and let-7d-5p could dramatically reduce the luciferase activity of wildtype circ-Cd84, circ-Wdr91 and circ-Tns3 luciferase vector, respectively, whereas did not affect the luciferase activity of mutant one. But enforced expression of miR-378c/miR-378a-5p could not reduce the luciferase activity of wildtype circ-Tns3/circ-Cd84 luciferase vector (Fig. 4A1–A5).
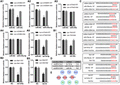
CircRNAs acts as a sponge for miRNAs and the ceRNA network. The luciferase reporter assays in RAW264.7 cells co-transfected with wild-type or mutant circ-Cd84/ circ-Wdr91/circ-Tns3 luciferase vector and control (A1-5) or miR-378a-5p/miR-378c/let-7d-5p mimics (B1-3). The wild-type and mutant sites of the circRNAs and mRNAs with miRNAs are shown in red color (C). The interaction of 3 ceRNAs (circ-Tns3/let-7d-5p/Ctsl, circ-Wdr91/miR-378a-5p/Msr1, and circ-Cd84/miR-30c/TLR2) (D). The ceRNA network is shown in graph (E). Three miRNAs (red color) are the center of the regulation, purple and green colors represent circRNAs and mRNA, respectively
Next, we performed the luciferase reporter assay in RAW264.7 cells to confirm the interaction between miRNAs (miR-378a-5p, miR-378c, let-7d-5p, and miR-30c) and mRNAs (Msr1, Ctsl, and Tlr2). The results showed that enforced expression of miR-30c, miR-378a, and let-7d-5p could dramatically reduce the luciferase activity of wild-type Tlr2, Msr1, and Ctsl luciferase vector, respectively, whereas did not affect the luciferase activity of mutant one. But enforced expression of miR-378c could not reduce the luciferase activity of wild-type Msr1luciferase vector (Fig. 4B1–B3). The mutant sites of the circRNAs and mRNAs are shown in Fig. 4C.
Construct of inflammation-related ceRNA network
After processing the data above, inflammation-related RNAs were then extracted from the ceRNA network. Three ceRNAs (circ-Tns3/let-7d-5p/Ctsl, circ-Wdr91/miR-378a-5p/Msr1, and circ-Cd84/ miR-30c/ Tlr2) were interacted in the network, as shown in Fig. 4D and E.
The expression of RNAs in RAW264.7 cells treated with TNA in vitro
To find if the mechanism was different between in vivo and in vitro, we set up experiments to indicate the change of miRNAs and mRNAs in RAW264.7 treated with TNA. Cells were treated with TNA or miRNAs inhibitors or circRNAs mimics in vitro. The results of qRT-PCR showed that the quantitation of miR378a, let-7d-5p, and miR-30c treated with TAN up-regulated the levels of these miRNAs as compared with ox-LDL treatment (A–C). The levels of Msr1, Ctsl, and Tlr2 mRNAs were down-regulated by TAN vs. ox-LDL treatment (D-F). The in vivo results were consistent, as shown in Fig. 5.
The expression of selected RNAs in RAW264.7 cells treated with TNA in vitro. RAW264.7 cells were treated with TNA or miRNAs inhibitors or circRNAs mimics in vitro and the quantitation of miRNAs (A–C) and mRNA (D–F) were detected by qRT-PCR. n = 3. **P < 0.01 and *P < 0.05 versus control group, ##P < 0.01 and #P < 0.05 versus ox-LDL treated group
Discussion
To date, the impact of ncRNAs in regulating immune response during atherosclerosis has not been evaluated in detail. Evidence has revealed that inflammation is the early trigger in the formation of atherosclerosis. Numerous miRNAs are induced by innate immune signaling to modulate the inflammatory responses. It has been reported that miR-121, miR-155, miR-21, miR-23, and miR-132 are the important miRNAs that negatively regulate the inflammatory by activation of TLR signaling.8–10 Earlier studies have reported a negative regulatory role of miR-132, miR-146a, and miR-155 in TLR signaling by inhibition of NF-κB activity and MyD88/IRAK.9,11 It has been reported that miR-155 is another miRNA to regulate innate immune responses by down-regulating SOCS1, DC-SIGN, and TAB2.12–14 MiR-146a is the best characterized miRNAs to regulate inflammation by targeting IRAK1, NF-κB, and TRAF6.15–17
In this study, we specifically focused on the miRNAs regulated by TAN controlling innate and inflammatory responses during atherosclerosis. We found that miR-378a-5p, miR-30c and let-7d-5p were the key nodes in the network. In the co-expression network, the inflammation-related miRNAs are connected with lncRNAs, circRNAs, and mRNAs, including positively and negatively regulated genes. Three ceRNAs (circ-Tns3/let-7d-5p/Ctsl, circ-Wdr91/miR-378a-5p/Msr1, and circ-Cd84/miR-30c/Tlr2) were interacted in the network.
The key mRNAs in the ceRNAs network include Msr1, Tlr2, and Ctsl. MSR1 (Mϕ scavenger receptor 1) has been implicated in many Mϕ-associated physiological and pathological processes, such as atherosclerosis, Alzheimer’s disease, and host defense. TLR2 plays a fundamental role in pathogen recognition and activation of innate immunity. Activation of TLR2 by PAMPs leads to an up-regulation of signaling pathways to modulate the host’s inflammatory response. Ctsl (cathepsin L) is a lysosomal cysteine proteinase that plays a major role in intracellular protein catabolism. It has been found Ctsl can up-regulate LPS stimulation to participate in the microglia-mediated neuroinflammation. These 3 mRNAs are all involved in the pathway of inflammation of AS. The anti-inflammation related miRNAs (such as miR-378, miR-30c, and let-7d-5p) could inhibit the activating of these cytokines and activate anti-inflammatory immune responds. This effect could be inhibited by the sponge of circ-Cd84, circ-Wdr91, and circ-Tns3, respectively. Meanwhile, acting as an anti-inflammatory agent, TNA could down-regulate the expression of circ-Cd84, circ-Wdr91, and circ-Tns3 effectively and inhibit the expression of pro-inflammatory cytokines (such as TLR2, MSR1, and Ctsl) to eliminate the process of AS.
Although new findings in the pathogenesis of atherosclerosis and the role of TAN are revealed in this study, there are still some limitations in this research. Atherosclerotic plaques contain many cells types including endothelial cells, vascular smooth muscle cells, Mϕs, CD4+ T cells, iNKT cells, and so on. All these cells contribute to plaque development, progression, and inflammation. Due to the limited size of the murine coronary artery, the RNAs-seq analysis were detected on the extracted RNA from whole aorta rather than isolated Mϕs from atherosclerotic plaques. The complexity of plaques in relation to cell composition were not interpreted completely in RNA-seq data. The data would be much more meaningful if we focused on a single cell type, such as Mϕs in plaque. On the other hand, we detected the expression of RNAs in RAW264.7 cells treated with TNA in vitro rather than the murine primary Mϕs. The gene expression in cell lines might be different from the primary cells. Furthermore, a large number of Mϕs in plaques are lipid laden (foam cells) rather than normal Mϕs. Although RAW264.7 cells treated with ox-LDL were used in vitro to confirm the mechanism in this study, the complex inflammatory microenvironment in atherosclerotic plaque should be further considered. We will fully consider these limitations and carry out in-depth research in the future.
Since manipulating the activation of immune response is essential to promote innate host defenses, the accumulation of evidence on miRNAs as inflammatory regulators is likely to make the new progress in the treatment of atherosclerosis. Future studies will contribute to develop novel and effective RNA interference therapeutics.
Authorship
W.C. performed the majority of experiments, and wrote the paper; D.W. contributed to the generation of ApoE−/− mice; X.L. and R.Y. helped in experimental design; S.G. and N.S. performed ELISA and qPCR.
Abbreviations
- AS
Atherosclerosis
- ceRNA
the competitive endogenous RNA
- circRNA
circular RNA
- DERNAs
different expressed RNAs
- GO
Gene Ontology
- HDL-C
high-density lipoprotein cholesterol
- KEGG
Kyoto Encyclopedia of Genes and Genomes
- LDL-C
low-density lipoprotein cholesterol
- lncRNA
long noncoding RNA
- miRNA
microRNA
- MRE
microRNA response element
- ncRNA
noncoding RNA
- RNA-seq
RNA sequencing
- TAN
Tanshinone IIA
- TC
total cholesterol
- TG
triglycerides
- VLDL-C
very low-density lipoprotein cholesterol
Acknowledgments
This work was financed by National Natural Science Foundation of China grant (No. 81874372 to W.C.), Key Basic Research Project of Liaoning Ministry of Education (L201701 to W.C.), and Young and Middle-aged Science and Technology Innovation Talent Support Plan of Shenyang, China (RC180069 to W.C.). We are grateful to Hongwei Sun, Xiande Ma, and Junyan Wang for their assistance in animal studies and the researchers in Beijing Ori-gene Science and Technology Corp., LTD for RNA-seq analysis.
Disclosure
The authors have declared no conflict of interest.
References
