


Abstract
Biases in legal decision-making are difficult to identify as type II errors (wrongful acquittals) are hardly observable and type I errors (wrongful convictions) are only observed for the subsample of subsequently exonerated convicts. Our data on the first German soccer league allow us to classify each referee decision accurately as correct, type I error or type II error. The potential bias we are interested in is favoritism toward clubs with higher long-term status, proxied by the ranking in the all-time table at the beginning of each session and by membership. Higher status clubs benefit largely from fewer type II errors. By contrast, the actual strength of clubs has no impact on referee decisions. We find no difference in type I errors and suggest anticipation of the bias as a potential explanation for the difference. We investigate several mechanisms potentially underlying our results; including career concerns and social pressure (JEL J00, M51, D81, D83).
1. Introduction
Legal decisions can be classified as biased if the frequencies of type I errors (wrongful convictions) and type II errors (wrongful acquittals) differ, for example, by gender, race, or status. In this paper, we focus on the impact of status (often referred to as Matthew effect; Merton 1968) by analyzing if referee decisions in professional sports are biased by the long-term status of clubs. The advantage of our unique data set from German soccer is that it allows for an identification strategy that does not suffer from the three usual obstacles in identifying biases in legal decision-making. The first obstacle is that wrongful acquittals are hardly observable, implying that type II errors can only be inferred indirectly by, for example, utilizing race combinations of perpetrators and victims (Alesina and La Ferrara 2014) or by interpreting decisions of judges as noisy signals for the actual guilt of defendants (Kanaya and Taylor 2020). Second, wrongful convictions are only observable for the subsample of subsequently exonerated convicts and the number of unnoted wrong convictions is likely to be substantial (Gross et al. 2014). Thus, estimating the overall wrongful conviction rate, defined as wrongful convictions over all convictions, tends to be imprecise as well. But even if estimations work well by considering, for example, only DNA tests (Bjerk and Helland 2020), the third problem is that wrongful conviction rates are not necessarily conclusive for type I errors. If the percentage of truly innocent defendants varies among subgroups, then group-specific differences in wrongful conviction rates may well be compatible with no bias. Thus, inferring type I errors from wrongful conviction rates is often problematic.
To identify potential biases in (legal) decision-making, we utilize a unique data set for referee decisions in the first German soccer league (“Bundesliga”). The main advantage of our data is that the frequency of type I and type II errors for the two most important referee decisions in soccer, deciding on goals and penalties, can directly be taken from the data. Experts from the professional data provider Sportec Solutions classify each decision on goals and penalties as either “correct,” “wrong,” or “debatable,”1 which can accurately be done by using video footage. We can hence not only observe all incorrectly awarded penalties (type I errors) but also all “wrongful acquittals” in case penalties are incorrectly denied (type II errors).2
We investigate if referee decisions favor clubs with high status. Our main proxy for status is an index measuring each club’s position in the all-time table (ATT) at the beginning of each season. We use club members as a second proxy for status. We find robust evidence for pronounced favoritism: Low-status clubs suffer from a 2 percentage point (36%) increase in type II errors (penalties and goals that are wrongfully denied) when compared with those with higher status.3 Conversely, we find no impact of status on type I errors. To ensure that status does not simply affect referee decisions via social pressure we control for home field advantage, attendance, and proximity of fans in the stadium. We also interact our main explanatory variables with our measure of home advantage and show that the status bias is generally not more pronounced in home games, suggesting that it is not caused by social pressure.
The reason why we proxy status by either the clubs’ long-time performance or by club members is that we want to distinguish as cleanly as possible between status and current strength. Current strength is proxied by odds but also by several other measures including an alternative calculation of winning probabilities, TV money received by clubs, and the aggregated transfer market value of a club’s players. Our proxies for current strength and status are correlated but status remains highly significant when adding current strength which, in turn, becomes insignificant. This suggests that it is indeed the long-term reputation of clubs that drives our findings.
The crucial advantage of observing type I and type II errors instead of just the frequency of wrongful convictions is that results are independent of whether high- or low-status clubs are more or less often in situations that truly deserve a penalty. Still, the situations at hand can potentially differ depending on the style of play, and this may make it inherently differently challenging for referees to come up with the right decision. To account for this, we control for several proxies for tactic and style of play. Results are robust.
A question related to different play styles is how our estimations would be affected if players of clubs anticipate the referee bias. In the Appendix, we develop a simple model that suggests anticipation effects as a potential explanation for the puzzling fact that there is a pronounced impact of status on type II errors but no impact on type I errors. The model is based on the idea that, when anticipating the bias, players from high-status clubs have incentives to dive even in cases that are ceteris paribus less likely to receive a penalty. In this case, the bias still exists but can no longer be identified.
Given the status bias in our data, we next investigate potential mechanisms. Starting with career concerns, we find that careers of referees depend indeed largely on the accuracy of decisions, but we find no evidence that wrong judgments matter more when they disadvantage high-status clubs. We then move on to several proxies for social pressure, including a home field advantage, attendance, and proximity of fans in the stadium. We also interact our main explanatory variables with our measure of home advantage and show that the status bias is not more pronounced in home games, suggesting that the status bias is not caused by social pressure. Eventually, we exploit variation in the birth years of referees and analyze rolling tables for different time periods. We thereby test the hypothesis that referees tend to favor clubs that were most successful during their own childhood and adolescence. However, we do not find any significant effects.
The remainder of the paper is organized as follows: Section 2 relates to the literature. Section 3 describes the institutional background and our data. Section 4 explains our estimation strategy. Section 5 presents our main results. Section 6 investigates potential mechanisms underlying our findings. Several other important aspects of our findings are discussed in Section 7. We conclude in Section 8.
2. Relation to the Literature
The potential bias we are interested in leads back to the Matthew effect (Merton 1968; George et al. 2016) which states that the (perceived) status of individuals, groups, and institutions influences how their behavior is judged (Zavyalova et al. 2012; Graffin et al. 2013; Bednar et al. 2015). Numerous benefits are associated with high status [see Podolny (2005) for a review], strong reputation (see Lange et al. 2011) or both (Ertug and Castellucci 2013). McDonnell and King (2018) find that high-prestigious firms prevail more often in employment discrimination suits but are punished harsher in case they are found liable. The key identification issue is whether different judgments are based on Bayesian updating (Fombrun and Shanley 1990) or rather on irrelevant but valued features such as success in unrelated fields (Lynn et al. 2009; Sauder et al. 2012).
Two other papers also use type I and type II errors in referee decisions identified by experts from video footage: First, Kim and King (2014) capture player status by the number of All-Star Game nominations in baseball. They find that umpires are more likely to mistake a ball for a strike and less likely not to call a strike when pitchers have high status. High-status pitchers thus benefit from more (less) wrong decisions in case of low-quality (high-quality) pitches. Our paper is complementary to Kim and King (2014) as we analyze the impact of status at the club level, while they consider status at the player level. We control with several proxies for player status and discuss in Section 7 why analyzing status at the club level is more instructive for soccer. Second, Dohmen (2008) uses data from the predecessor of our data provider and finds a pronounced home bias. We find a home bias for referee decisions on penalties but not for goals which suggests that the home bias has decreased over time. Dohmen (2008) does not analyze the impact of status.
All other papers using sports data we are aware of cannot directly observe whether decisions are right or wrong. They therefore identify a potential bias by comparing the frequency of decisions for different subgroups. In their seminal paper on referee bias in soccer, Garicano et al. (2005) show that referees in the “Primera División,” the first Spanish League, grant longer extra time for injuries in close games if home teams are behind. As the effect is larger when games are more important and when the number of spectators is high, and disappears if games are not close, they attribute their finding to social pressure. Most other papers on the home bias follow the basic idea developed in Garicano et al. (2005) (Sutter and Kocher 2004; Scoppa 2008; Buraimo et al. 2010; Price et al. 2012). It is then shown that the home bias is moderated by referee professionalism (Rickman and Witt 2008; Dawson and Dobson 2010), the number of spectators (Nevill et al. 2002; Page and Page 2010; Pettersson-Lidbom and Priks 2010; Bryson et al. 2021), former potentially incorrect decisions in the respective games (Plessner and Betsch 2001) and the current score [see Di Corrado et al. (2011) for an overview]. We will get back to this identification strategy in our Section 7.4
Sandberg (2018) shows that scoring judges in dressage award more points to equestrians who share their own nationality or the nationality of other judges on the board. In a similar vein, Parsons et al. (2011) and Price and Wolfers (2010) show that players tend to benefit from decisions when they share the referee’s ethnicity.
Kilduff et al. (2016) uses NFL data to show that possessing a celebrity tie to a successful head coach increases the probability of getting a first senior coaching position. Interestingly, these coaches are also more likely to be dismissed after some time. Assuming increasing labor market efficiency, this suggests that social connections lead to a bias similar to high status in our data. While dismissals are a good indicator of appropriateness, the advantage of our data is that it allows us to clearly identify whether a decision was right or wrong at the very moment when it is made.
3. Background and Data
We use data for the first German soccer league (“Bundesliga”) for the seasons 2000/2001 to 2012/2013.5 The Bundesliga includes 18 clubs playing each other twice per season; alternating between home and away club. A season thus consists of 34 match days with a total number of 306 games per season, leaving us with matches. The winning club gets three points and a draw yields one point. The club with the most points wins the championship. In the seasons 2000/01–2007/08, the three clubs with the lowest score were directly relegated to the second division. Since 2008/09, the third to last club instead plays a relegation match against the club ranked third in the second league. Depending on the overall ranking of national clubs within Europe, the leading three or four clubs qualify for the lucrative and prestigious “UEFA Champions League” consisting of 32 clubs in Europe, and two or three other clubs for the less lucrative but still important “Euro League.”
According to UEFA rules, refereeing falls under the jurisdiction of the national soccer associations (“Deutscher Fußballbund,” DFB). The DFB provides training for referees and, since 2012/2013, pays a base salary regardless of the number of refereed games of up to 75,000 euros (in 2017/18). In addition, referees receive a bonus per game (PG) which was 5,000 Euros in 2017/18.6 Referees in soccer make a variety of crucial decisions, including goals, the punishment of fouls, offside, throw-ins, and corner kicks. We focus on decisions made by the (main) referee who makes the ultimate calls and is supported by two assistants (so-called “Linesmen”) who are placed at each long border of the field. Their main responsibility is the judgment of potential offside.7
Our main data provider Sportec Solutions was formed as a joint venture of Deltatre, the world’s leading sports and entertainment technology provider, and the German Soccer League (Deutsche Fussball Liga, DFL). The declared purpose of the joint venture is improving the use of data in German soccer. Sportec Solutions focuses on recording, storing, analyzing, and evaluating data from professional soccer in Germany.8 Already before the joint venture with DFL, data from Deltatre have often been used for studies involving professional soccer (see e.g. Dohmen 2008). To the best of our knowledge, comparable data are not obtainable for any other soccer league.
Sportec Solutions classifies each referee decision on goals and penalties as “incorrect,” “correct,” or “debatable,” in case the decision cannot be unambiguously judged. For each match, there is an observer in the stadium who records game-related statistics such as goals, shots on goal, passes, corners, throw-ins, and tackles. Every decision initially labeled as incorrect or debatable by the observer in the stadium is reviewed by the responsible “Head-Observer” after the game, utilizing video footage. Whenever there is at least some doubt about whether a decision is either correct or incorrect, it is recorded as debatable. One can hence safely assume that any incident not recorded as debatable is accurately judged. We use data from the Web site fussballdaten.de to fill in missing referee names, to calculate referees’ experience,9 and to determine the clubs’ positions in the ATT ranking for each season.
We analyze four kinds of situations, those where goals or penalties are actually deserved and those where they are not. Table 1 provides summary statistics for each of those four events. Our classification of wrong decisions as type I or type II error is based on the Null hypothesis (H0) that a penalty or goal is not deserved. The two error types are then as shown in Table 2.
Descriptive Statistics on Decisions
| Awarded | Not awarded | Total | |
|---|---|---|---|
| Goal | 10,732 (98.3%) | 184 (1.7%) | 10,916 (100%) |
| Penalty | 704 (53.2%) | 620 (46.8%) | 1324 (100%) |
| No goal | 266 (30.7%) | 601 (69.3%) | 867 (100%) |
| No penalty | 80 (3.6%) | 2118 (96.4%) | 2198 (100%) |
| Goal (deb.) | 397 (72.4%) | 151 (27.6%) | 548 (100%) |
| Penalty (deb.) | 178 (13.3%) | 1165 (86.7%) | 1343 (100%) |
Notes: The table shows the number (and percentage) of awarded and not awarded penalties that were warranted, not warranted, or debatable in the period from 2000 to 2012 in the Bundesliga.
Error Types of Referee Decisions
| H0 is true: | H0 is wrong: | |
|---|---|---|
| No penalty/goal deserved | Penalty/goal deserved | |
| Penalty/goal not given | Correct decision | Type II error |
| Penalty/goal given | Type I error | Correct decision |
| H0 is true: | H0 is wrong: | |
|---|---|---|
| No penalty/goal deserved | Penalty/goal deserved | |
| Penalty/goal not given | Correct decision | Type II error |
| Penalty/goal given | Type I error | Correct decision |
Table 1 shows that actual goals are awarded in 98.3% of all cases, that is, type II errors for goals are very rare.10 The reason is that, when a goal is awarded, the decision is often straightforwardly correct as not even a potential violation of the rules of the game is involved. By contrast, in 30.7% of all situations where a goal should not be awarded, it is mistakenly granted (type I errors). The reason for the discrepancy between the two error types is that situations where a goal should not be awarded are systematically more challenging as fouls and offside are often close calls.
According to the official rules of the game, “a penalty kick is awarded against a club that commits 1 of the 10 offenses for which a direct free kick is awarded, inside its own penalty area and while the ball is in play.” Table 1 shows that penalties that should be awarded are actually denied in 46.8% of all cases, that is, there are many type II errors. Conversely, there are only few type I errors as a penalty is only awarded in 3.6% of all cases when it is undeserved. This behavior is in line with the famous Blackstone ratio in criminal law that “it is better that ten guilty persons escape than that one innocent suffer” (Blackstone 1979: 358) (in-dubio-pro-reo approach). Figure 1 shows the development of the share of type I and type II errors for the four events over time. Both for goals and for penalties, the frequency of type I errors has declined; for goals driven by a drop between 2003 and 2007 and for penalties by a continuous decline between 2000 and 2007. In addition, we observe a sharp increase for Type II errors in penalties.11
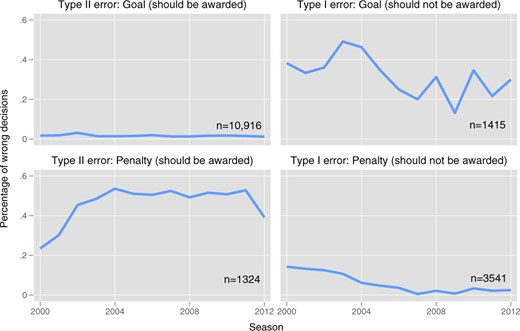
Development of Decision Quality over Time. Notes: The figure shows the yearly percentage of incorrect decisions in the seasons 2000/01 until 2012/13 separated by error type and goal/penalty calls.
As a proxy for the status of clubs, we construct a measure that allows us to determine each club’s position in the ATT at the beginning of each season. We sum up over all points a club has reached from the first season of the Bundesliga (1963) up to the respective season. Thereby, a win counts three, a draw one, and a loss zero points. As this implies that the ATT varies from season to season, the procedure can be seen as a compromise between two objectives: On the one hand, we want to account for the fact that status builds up over time, so we take the all-time ranking rather than the actual strength of a club. On the other hand, we need to allow for the possibility that status changes. As a second measure for status we consider the number of club members.12 Using membership numbers as a proxy for club status follows a similar logic as ATT positioning, teams that have been around longer in the Bundesliga and thus have accumulated a higher status are also more likely to have more club members. As teams additionally gain (loose) members when they are performing well (bad), the measurement using the number of club members also allows for updating of status. Figures A2 and A3 show that the average status change of clubs between seasons is just about one place, both in the ATT ranking and in membership.
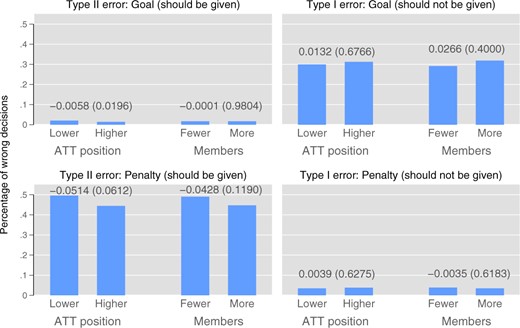
Incorrect Decisions, Separated by Status and Club Members. Notes: Each bar in the figure shows the ratio of wrong decisions divided by the sum of correct and wrong decisions. In each panel, we display two status proxies: (i) ahead in the ATT in a given season and (ii) fewer or more club members when compared with the competing club in a given season. The four panels then refer to error types (type II errors on the left side, type I error on right side) and decisions concerning goals (top panels) and penalties (bottom panels). Numbers above the bars are differences in frequencies. Numbers in parentheses are p-values for a proportions test with the null hypothesis of equal means.
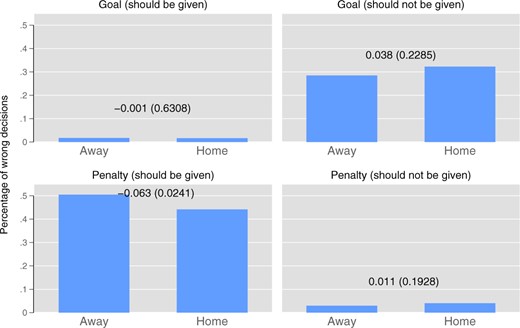
Incorrect Decisions, Separated by Home and away Team. Notes: Each bar in the figure shows the ratio of wrong decisions divided by the sum of correct and wrong decisions. In each panel, we display the share of incorrect decisions for the home team and the away team separately. The four panels then refer to error types (type II errors on the left side, type I error on right side) and decisions concerning goals (top panels) and penalties (bottom panels). Numbers above the bars are differences in frequencies. Numbers in parentheses are p-values for a proportions test with the null hypothesis of equal means.
For each game, we define the club with the higher ranking in the ATT at the beginning of each season as “high-status club” and the club with the lower ranking as “low-status club.” The same logic applies to the number of club members. This given, Figure 2 shows the percentage differences of wrong decisions between the higher and the lower ranked club (with p-values for the significance of the difference using a proportions test in parentheses). Figure 2 already suggests that we will find no significant difference for type I errors while clubs that are higher ranked benefit from a lower frequency of type II errors (i.e., deserved penalties and goals are less often incorrectly denied for those clubs).
Figure 3 shows the same frequencies, now separated by home and away team. Similar to status, Figure 3 suggests that there is no difference for type I errors, but we do observe a home bias with respect to penalties and type II errors.
4. Estimation Strategy
We consider four different events, those where goals and penalties are actually deserved or undeserved. We estimate linear probability models on the probability that a deserved goal or penalty was incorrectly denied (type II errors) and that a non-deserved goal or penalty was incorrectly awarded (type I errors). Debatable decisions are excluded as type I or type II errors cannot be defined for those cases. Clubs suffer from type II errors (i.e., when actual goals or penalties are incorrectly denied) but benefit from type I errors (i.e., when goals or penalties are incorrectly awarded). We therefore need to consider the two error types in separate regressions. Status is proxied by the position in the ATT at the beginning of each season and the membership as discussed in the data section.
Our regression analyses focus on the status difference between the two clubs in every match. In all regressions, we adopt both a continuous and a discrete version for our status variables: In the discrete version, we define a dummy that takes the value “0” (“1”) for the club that is behind (ahead) in the ATT or that has a lower (higher) number of members at the beginning of the respective season. In the continuous version, we use the difference between the two clubs in the ATT position or the membership position. All regressions include club-fixed effects, so what matters is the status difference and not the status of a club itself. We show in the Appendix that our main results also hold without fixed effects.
Other controls in our estimations include variables that may influence referee decisions due to social pressure; proxies for the clubs’ playing style which may potentially influence the difficulty of referee decisions; experience of referees; skill and performance of referees; and previous favorable and unfavorable wrong calls. We also include season as well as match day-fixed effects to capture possible changes in referee performance over time in all specifications. The exact definition and calculation of aforementioned control variables is explained when they appear first in a regression. All estimations include standard errors clustered at the game level.
A final remark on our estimation strategy relates to the influential paper by Knowles et al. (2001). They show that, while police are more likely to search cars of African-American drivers compared with white drivers for illegal drugs, this just equilibrates the two groups’ detection probabilities at the margin. Since the most suspicious cars are stopped first, the marginal detection probability declines from car to car, implying that identical detection probabilities on average do not necessarily imply that probabilities are equilibrated at the margin (Anwar and Fang 2006). This problem, however, does not exist in our setting as each game is considered separately, that is, there is no interdependency between the decisions in different games.
5. Results
Table 3 shows results for type II errors from a linear probability model. The dependent variable is a dummy that takes the value “1” if a correct goal or a deserved penalty is incorrectly denied. Clubs hence suffer from type II errors. The first row shows that, in contrast to Dohmen (2008) who uses data from the same data provider but for an earlier time period, we find no home bias.
Probability of Type II Errors
| (1) | (2) | (3) | (4) | |
|---|---|---|---|---|
| Home (d) | −0.0040 | −0.0053 | −0.0022 | −0.0034 |
| (0.0051) | (0.0051) | (0.0051) | (0.0052) | |
| Ahead in ATT (d) | −0.0204z | |||
| (0.0051) | ||||
| ATT-position difference | −0.0008*** | |||
| (0.0002) | ||||
| Ahead in members (d) | −0.0087* | |||
| (0.0050) | ||||
| Member–position difference | −0.0005** | |||
| (0.0003) | ||||
| Win probability (odds based) | −0.0145 | −0.0063 | −0.0260 | −0.0186 |
| (0.0199) | (0.0204) | (0.0200) | (0.0213) | |
| Referee experience | 0.0005** | 0.0005** | 0.0006** | 0.0005** |
| (0.0002) | (0.0002) | (0.0002) | (0.0002) | |
| Ref. avg. performance (season) | 0.0102 | 0.0107 | 0.0108 | 0.0107 |
| (0.0073) | (0.0073) | (0.0073) | (0.0073) | |
| Goal (d) | −0.4525*** | −0.4523*** | −0.4523*** | −0.4521*** |
| (0.0139) | (0.0138) | (0.0139) | (0.0139) | |
| Prev. unfav. wrong call (d) | −0.0092 | −0.0097 | −0.0091 | −0.0091 |
| (0.0084) | (0.0085) | (0.0085) | (0.0085) | |
| Prev. fav. wrong call (d) | −0.0008 | −0.0009 | −0.0004 | −0.0005 |
| (0.0143) | (0.0144) | (0.0144) | (0.0144) | |
| Prev. unfav. wrong call (opponent) (d) | 0.0063 | 0.0064 | 0.0072 | 0.0070 |
| (0.0101) | (0.0101) | (0.0101) | (0.0101) | |
| Prev. fav. wrong call (opponent) (d) | −0.0010 | 0.0004 | −0.0002 | −0.0005 |
| (0.0132) | (0.0131) | (0.0132) | (0.0131) | |
| Last 10 min (d) | −0.0004 | −0.0006 | −0.0002 | −0.0004 |
| (0.0052) | (0.0052) | (0.0052) | (0.0052) | |
| Close game (d) | 0.0113** | 0.0114** | 0.0111** | 0.0112** |
| (0.0056) | (0.0056) | (0.0056) | (0.0056) | |
| Decisive call | 0.0075* | 0.0077* | 0.0077* | 0.0077* |
| (0.0042) | (0.0042) | (0.0042) | (0.0042) | |
| Spectators (scaled) | −0.0039 | −0.0051* | −0.0026 | −0.0035 |
| (0.0026) | (0.0027) | (0.0026) | (0.0027) | |
| Stadium with running track (d) | −0.0077 | −0.0085* | −0.0075 | −0.0078 |
| (0.0049) | (0.0049) | (0.0049) | (0.0049) | |
| Season FE | Yes | Yes | Yes | Yes |
| Match day FE | Yes | Yes | Yes | Yes |
| Team FE | Yes | Yes | Yes | Yes |
| Referee FE | Yes | Yes | Yes | Yes |
| N | 12,232 | 12,232 | 12,232 | 12,232 |
| R2 | 0.3335 | 0.3337 | 0.3328 | 0.3329 |
Notes: Linear probability model estimates; (d) for discrete change of dummy variable from 0 to 1. The dependent variable is a dummy variable that takes value 1 for wrong calls among possible penalties and goals that should have been awarded. Debatable decisions are excluded. Standard errors in parentheses are clustered at the game level.
p < 0.01,
p < 0.05,
p < 0.1.
In our first specification, we define status as dummy variable that takes the value “1” if the club is ranked higher in the ATT than its opponent at the beginning of the respective season. The coefficient is negatively significant at the 1% level and economically meaningful: If the position in the ATT is lower, then the probability of suffering from a type II error increases by 2 percentage points. As the probability for a type II error for a high-status team is 5.7%, this amounts to an increase of 36%.17 Results are qualitatively the same for all subsequent specifications of the status variable: In Column (2), we define status as a continuous variable by considering the difference between the two clubs in the ATT. Columns (3) and (4) substitute the binary and continuous versions of the ATT ranking by club members.
In line with the descriptive statistics, the probability of type II errors is far higher for penalties; however, we find a status bias both for decisions on goals and penalties. Table A1 separates our analysis by penalties and goals and shows that status is significantly negative at the 1% level for both kinds of events when using ATT as status measure. As most other potentially interesting interactions turn out to be insignificant, we do not display interaction terms but will get back to this when analyzing the potential interplay of social pressure and status in Section 7.
The most interesting result for our control variables is that the inverse of (adjusted) odds is insignificant throughout. Thus, it is indeed the long-term prestige and not the actual strength of a club that triggers the decision bias. When we consider a specification without status, then odds become slightly significant in some specifications (specifications not included). This, however, can be attributed to the fact that status and the inverse of odds are positively correlated; with coefficients between 0.38 and 0.46 depending on the exact measurement of status. In Table A2, we show that the inverse of odds rather than the status predicts the result of a game, which reinforces the view that it is indeed the status and not the current strength of clubs that influences referee decisions.
For the experience of referees, we calculate a variable capturing how many games referees have headed previous to the game in question. Coefficients express the effect of a one additional game refereed. We use grades from the highly respected soccer magazine “kicker” for referees’ skill and performance in each match. We average a referee’s grades over each season (excluding the game under consideration) and scale this variable to have mean 0 and standard deviation 1 over all referees in each season. Controlling for both experience and the average performance in a season, experience increases the probability of type II errors.
Dummy variables for previous wrong calls are defined as follows: “Type II error team” means that the team under consideration had suffered before from a mistakenly denied penalty or goal. “Type I error team” concerns situations where the team had previously benefitted from getting an undeserved penalty or goal. The next two dummies are defined analogously for the opponent. All previously wrong decisions are insignificant for type II errors.
The subsequent control variables all concern proxies for social pressure, which may increase the susceptibility to wrong decisions itself but, more importantly, potentially also the impact of the status variable. “Close game” is defined as a game where the goal difference at the moment of the decision is at most one. “Decisive calls” are calls that influence, everything else equal, whether a team would eventually have received more or less points had the call been different. The (scaled) number of spectators and the dummy on whether the stadium has a running track, which reduces the proximity of spectators and the referee, are variables often used to proxy for social pressure. “Close game” and “Decisive calls” are indeed significant at the 5% and the 10% significance level, respectively, suggesting that referees may choke under pressure. All specifications include fixed effects for season, match day, team, and referee. Table A3 provides a detailed description of all control variables.
The Appendix shows results of several robustness checks: Table A4 considers only matches where the difference in the ATT ranking exceeds a minimum threshold. The difference in the ATT ranking remains significant at the 1% level in all specifications. Furthermore, the coefficient is indeed increasing in the threshold for the minimum difference. Similar results hold for status measured using the ranking in members. Note however that a statistical test does not detect any significant difference between the coefficients in the three specifications.
Table A5 focuses on the definition of the clubs’ current strength and substitutes the (adjusted) inverse of odds by the performance in the last season, the performance in the current season, TV income, inferred winning probability based on ELO instead of odds, and the transfer market value of a team, defined as the sum of the players’ aggregated transfer market values taken from transfermarkt.de. Results do not change qualitatively.
Table A6 disaggregates by the periods before and after 2004, where the dividing line is based on the observation from Figure 1 that the frequency of wrong decisions dropped after 2004. While this has also led to a reduction of the impact of status measured by the position in the ATT, status is still significant for both periods.
As we cannot fully exclude that the style of play of clubs influences the difficulty of correct decisions, Table A7 adds, sequentially and simultaneously, four different kinds of tactic variables taken from kicker.de. We define proxies for the tactical orientation (such as the number of defenders in the start formation) as well as for the procedure of the game itself (such as the number of shots on target and the number of fouls). Results are robust.
To ensure that our results are not driven by misspecification of the linear probability models, Table A8 includes different specifications of our control variables for time within a season and game as well as referee experience. We furthermore estimate a random sample of all possible model specifications (given our control variables) and plot the distribution of the point estimates for the status variable “Ahead in ATT” of these 106,017 estimations in Figure A4. The plot indicates that the estimate for the status bias is not driven by model mis-specification.
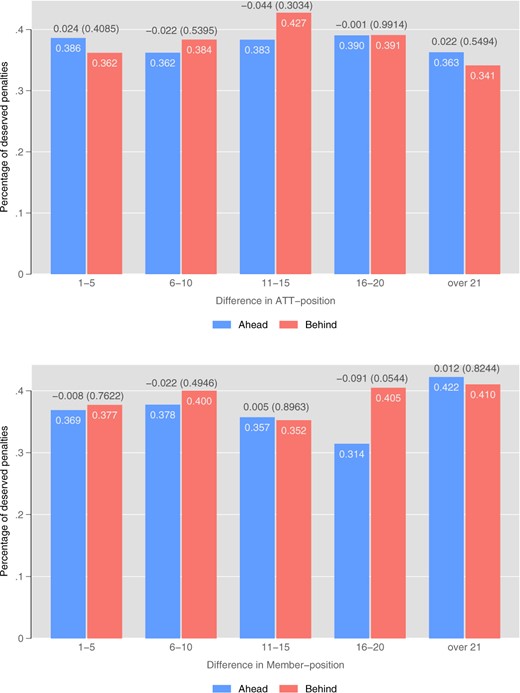
Share of Deserved Penalties by Status. Notes: The figure shows the share of deserved penalties by status and for different levels of status difference between the teams. Debatable decisions are excluded. Numbers above the bars are differences in frequencies. Numbers in parentheses are p-values for a proportions test with the null hypothesis of equal means.
Finally, Table A9 considers different econometric techniques as robustness checks. We compare our linear probability models to specifications usually applied for rare events and coefficients are almost exactly identical for all specifications. While linear probability models are in general robust to rare events, we nonetheless want to ensure that the small number of type II errors (rare event) does not bias the estimations.
Table 4 presents results for the same models when we consider situations where penalties and goals have been incorrectly awarded (type I errors). In contrast to Table 3 clubs now benefit from wrong decisions. Again in line with the descriptive statistics, mistakes are now far more frequent for goals for reasons discussed in Section 1. The bottom line is that the status variable is insignificant in all specifications. The same holds for almost all of our control variables of interest, most importantly for the home team, for odds and, in contrast to type II errors, now also for referee experience, close games, and decisive calls. The only significant control variable is “Type I error team,” which means that teams that already benefitted from a type I error before have a higher probability of receiving another undeserved penalty or goal.18 In Section 7, we will discuss potential reasons why we find a pronounced and robust impact of status on type II errors but no impact on type I errors.
Probability of Type I Errors
| (1) | (2) | (3) | (4) | |
|---|---|---|---|---|
| Home (d) | 0.0019 | 0.0001 | 0.0031 | −0.0003 |
| (0.0124) | (0.0126) | (0.0125) | (0.0129) | |
| Ahead in ATT (d) | −0.0015 | |||
| (0.0150) | ||||
| ATT-position difference | −0.0004 | |||
| (0.0005) | ||||
| Ahead in members (d) | 0.0055 | |||
| (0.0149) | ||||
| Member–position difference | −0.0005 | |||
| (0.0008) | ||||
| Win probability (odds based) | 0.0505 | 0.0634 | 0.0427 | 0.0642 |
| (0.0469) | (0.0488) | (0.0489) | (0.0526) | |
| Referee experience | 0.0008 | 0.0008 | 0.0008 | 0.0008 |
| (0.0010) | (0.0010) | (0.0010) | (0.0010) | |
| Ref. avg. performance (season) | 0.0303 | 0.0300 | 0.0302 | 0.0303 |
| (0.0214) | (0.0214) | (0.0214) | (0.0213) | |
| Goal (d) | 0.2357*** | 0.2357*** | 0.2356*** | 0.2358*** |
| (0.0160) | (0.0160) | (0.0160) | (0.0160) | |
| Prev. unfav. wrong call (d) | −0.0237 | −0.0241 | −0.0234 | −0.0239 |
| (0.0241) | (0.0241) | (0.0241) | (0.0241) | |
| Prev. fav. wrong call (d) | 0.4044*** | 0.4042*** | 0.4045*** | 0.4045*** |
| (0.0452) | (0.0451) | (0.0452) | (0.0452) | |
| Prev. unfav. wrong call (opponent) (d) | 0.0195 | 0.0193 | 0.0194 | 0.0194 |
| (0.0271) | (0.0270) | (0.0271) | (0.0271) | |
| Prev. fav. wrong call (opponent) (d) | −0.0035 | −0.0032 | −0.0036 | −0.0039 |
| (0.0425) | (0.0424) | (0.0425) | (0.0425) | |
| Last 10 min (d) | 0.0237 | 0.0233 | 0.0237 | 0.0237 |
| (0.0175) | (0.0175) | (0.0175) | (0.0175) | |
| Close game (d) | 0.0061 | 0.0066 | 0.0059 | 0.0064 |
| (0.0213) | (0.0212) | (0.0212) | (0.0212) | |
| Decisive call | −0.0030 | −0.0031 | −0.0029 | −0.0033 |
| (0.0208) | (0.0208) | (0.0207) | (0.0207) | |
| Spectators (scaled) | 0.0018 | 0.0001 | 0.0027 | 0.0002 |
| (0.0073) | (0.0073) | (0.0073) | (0.0074) | |
| Stadium with running track (d) | −0.0217 | −0.0226 | −0.0216 | −0.0222 |
| (0.0168) | (0.0168) | (0.0168) | (0.0168) | |
| Season FE | Yes | Yes | Yes | Yes |
| Match day FE | Yes | Yes | Yes | Yes |
| Team FE | Yes | Yes | Yes | Yes |
| Referee FE | Yes | Yes | Yes | Yes |
| N | 3065 | 3065 | 3065 | 3065 |
| R2 | 0.2666 | 0.2668 | 0.2667 | 0.2667 |
Notes: Linear probability model estimates; (d) for discrete change of dummy variable from 0 to 1. The dependent variable is a dummy variable that takes value 1 for wrong calls among possible penalties and goals that should not have been awarded. Debatable decisions are excluded. Standard errors in parentheses are clustered at the game level.
p < 0.01,
p < 0.05,
p < 0.1.
6. Investigation of Mechanisms
We now investigate potential mechanisms underlying our findings; career concerns, social pressure, and whether the bias is more pronounced for clubs that performed well during a referee’s adolescence.
6.1 Career Concerns
We test career concerns in two ways: First, we analyze if unfavorable decisions toward high-status clubs lead to higher exit rates from the pool of Bundesliga referees (extensive margin). Second, we examine if these decisions increase the period between two nominations (intensive margin).
The German national soccer association (DFB) is officially in charge of the referee pool for the top three German soccer leagues. In addition to the DFB, the DFL (“Deutsche Fußballliga”), which is the association of all clubs playing in the first two soccer leagues, influences referee nominations since 2010 after a “referee commission elite” was established.19 The pool consists of about 150 referees with about 18–23 (varies yearly) of them appointed for the Bundesliga. The rules of promotion and demotion to the Bundesliga pool are not entirely transparent but decisions are based on grades assigned by an observer in the stadium. Furthermore, there is an age limit of 47 years and referees need to pass a fitness test. There is limited information about how and when referees are selected for each game. The DFB announces the referee on their Web site only for the next match day.20
Table 5 shows results for the extensive margin.21 Referees with better average performance in a season are less likely to exit the pool of referees, which supports the use of “kicker”-grades as performance proxies. A one standard deviation increase in average season performance is associated with a 10.5–20.3 percentage points lower likelihood of exit. Given a mean exit rate of around 6.9 percentage points, this is a large effect size. Age also goes in the expected direction where one additional year of age leads on average to an increase in the exit probability by around 1.1–3.1 percentage points (however, the estimate is only significant in one specification).
Complementary Log–Log Models on Exit from the Referee Pool
| (1) | (2) | (3) | (4) | ||
|---|---|---|---|---|---|
| Referee avg. performance (season) | −0.1047*** | −0.1532*** | −0.2032*** | −0.1674*** | |
| (0.0310) | (0.0457) | (0.0472) | (0.0465) | ||
| DFB cup referee (d) | −0.0436 | 0.0936 | 0.0687 | 0.1365*** | |
| (0.0724) | (0.0903) | (0.0615) | (0.0465) | ||
| International referee (d) | −0.0776 | −0.0023 | 0.0272 | 0.0041 | |
| (0.1124) | (0.0535) | (0.0372) | (0.0298) | ||
| Age | 0.0109 | 0.0209 | 0.0311*** | 0.0251 | |
| (0.0087) | (0.0139) | (0.0119) | (0.0167) | ||
| PG: Type II errors | −0.0789 | } p = 0.1125 | |||
| (0.1219) | |||||
| PG: Type I errors | −0.5050* | ||||
| (0.2855) | |||||
| PG: Type II errors (ATT ahead) | 0.0819 | } p = 0.1299 | |||
| (0.0682) | |||||
| PG: Type II errors (ATT behind) | −0.4281** | ||||
| (0.2090) | |||||
| PG: Type I errors (ATT ahead) | −0.1714 | } p = 0.0007 | |||
| (0.2274) | |||||
| PG: Type I errors (ATT behind) | −1.4865*** | ||||
| (0.3692) | |||||
| PG: Type II errors (members ahead) | −0.0526 | } p = 0.7423 | |||
| (0.0726) | |||||
| PG: Type II errors (members behind) | 0.0253 | ||||
| (0.2392) | |||||
| PG: Type I errors (members ahead) | −0.0341 | } p = 0.1418 | |||
| (0.0999) | |||||
| PG: Type I errors (members behind) | −3.4657** | ||||
| (1.7507) | |||||
| Tenure FE | Yes | Yes | Yes | Yes | |
| N | 207 | 207 | 207 | 207 | |
Notes: Complementary log–log estimates; average marginal effects; (d) for discrete change of dummy variable from 0 to 1. The dependent variable is a dummy that takes value 1 if a referee left the pool of active referees in a given season. Referees at the age limit are excluded. We furthermore exclude one referee as he was suspended due to connections to a betting scandal. The control variables measure average performance in the season—in standard deviations and with mean 0, whether a referee was also refereeing in the DFB Cup (German National Cup) or internationally (Champions League or Euro League), and the average age in the season. Tenure-fixed effects take the role of mixed proportional hazards. The last column presents the p-value for test of equality for the indicated coefficients. Standard errors in parentheses are clustered at the referee level.
p < 0.01,
p < 0.05,
p < 0.1.
The average frequency of type I and type II errors PG has not much additional explanatory power (Column 2). Referees seem to slightly benefit from more type I errors, but only when we control for the overall performance of referees (see also Table A10). In the next two columns, we separate type I and type II errors, for each match, by clubs ahead and behind in the ATT (column 3) and in membership (column 4). In column 5, we show the p-values from a test of equality for the coefficient estimates regarding high- and low-status clubs. Referees who make more type I and type II errors regarding low-status clubs are less likely to exit from the pool. However, only the coefficient for type I errors is significantly different for low-status and high-status clubs. While the difference in the exit probability between high- and low-status clubs goes in the expected direction for type II errors, this does surprisingly not hold for type I errors (recall that clubs benefit from type I errors). A qualitatively similar result emerges in Column 4 when we consider membership instead of ATT ranking.
A potential issue with the overall performance grade is that the impact of type I and type II errors on the grade might itself be influenced by status. Table A10 therefore presents results for the same regressions, but without performance. Results remain qualitatively the same for type I errors, but the impact of type II errors on the exit probability is now significantly higher for clubs ahead in the ATT. Career concerned referees would thus try to avoid type II errors more so for high status than for low status clubs. Combining these results from Tables 5 and A10 provides suggestive evidence of career concerns as a potential driver of the status bias for type II errors. However, results for type I errors are not in line with this mechanism.
In the next table (Table 6), we estimate negative binomial models to analyze the determinants of the pause between two games (intensive margin). The pause matters as, in addition to the fixed salary, referees now receive about 5,000 euros PG. Appendix B explains how the pause itself and the control variable “expected pause” are calculated. The sample lasts from 2000 to 2012 as these are the years we have data for both referee performance and wrong calls. Control variables used in all regressions are listed under the table. We find that better grades are associated with shorter breaks: Performing one standard deviation better than other referees at a given match day reduces the pause by between 0.05 and 0.08 games.
Negative Binomial Models on Pause between Games
| (1) | (2) | (3) | (4) | ||
|---|---|---|---|---|---|
| Avg. performance (season) | −0.0778*** | −0.0531** | −0.0523** | −0.0528** | |
| (0.0230) | (0.0228) | (0.0227) | (0.0227) | ||
| DFB cup referee (d) | 0.0478 | 0.0561 | 0.0554 | 0.0556 | |
| (0.1653) | (0.1664) | (0.1676) | (0.1684) | ||
| International referee (d) | 0.1692 | 0.1752 | 0.1746 | 0.1727 | |
| (0.1163) | (0.1166) | (0.1169) | (0.1162) | ||
| Age | 0.0004 | 0.0004 | 0.0001 | 0.0009 | |
| (0.0268) | (0.0266) | (0.0270) | (0.0267) | ||
| Tenure (BL) | −0.0874*** | −0.0885*** | −0.0885*** | −0.0895*** | |
| (0.0297) | (0.0292) | (0.0295) | (0.0292) | ||
| Expected pause | 0.6356*** | 0.6155*** | 0.6167*** | 0.6185*** | |
| (0.1479) | (0.1483) | (0.1474) | (0.1472) | ||
| Type II errors | 0.0640 | } p = 0.3422 | |||
| (0.0405) | |||||
| Type I errors | 0.0986*** | ||||
| (0.0317) | |||||
| Type II errors (ATT ahead) | 0.0266 | } p = 0.3120 | |||
| (0.0502) | |||||
| Type II errors (ATT behind) | 0.0998* | ||||
| (0.0577) | |||||
| Type I errors (ATT ahead) | 0.1229*** | } p = 0.3163 | |||
| (0.0418) | |||||
| Type I errors (ATT behind) | 0.0744** | ||||
| (0.0361) | |||||
| Type II errors (members ahead) | 0.0207 | } p = 0.2636 | |||
| (0.0546) | |||||
| Type II errors (members behind) | 0.1025* | ||||
| (0.0553) | |||||
| Type I errors (members ahead) | 0.1326*** | } p = 0.1605 | |||
| (0.0391) | |||||
| Type I errors (members behind) | 0.0610 | ||||
| (0.0404) | |||||
| Referee FE | Yes | Yes | Yes | Yes | |
| N | 3704 | 3704 | 3704 | 3704 |
Notes: Negative binomial estimates. Average marginal effects; (d) for discrete change of dummy variable from 0 to 1. The discrete dependent variable measures the number of game days between the present game and the next one in which the referee is used (0 when referee is immediately used in the next game). The control variables measure performance in the game—in standard deviations and with mean 0, whether a referee was also refereeing in the DFB Cup or internationally (Champions League or Euro League) in this season, the age at the time of the game as well as tenure in the Bundesliga. We furthermore calculate the “expected pause” based on the number of referees in the referee pool in a given season and the number of available games and match days. The last column presents the p-value for test of equality for the indicated coefficients. Standard errors in parentheses are clustered at the referee level.
p < 0.01,
p < 0.05,
p < 0.1.
Top referees nominated for international games need to recover between matches, and hence might have longer breaks. All error types tend to increase the pause between two matches, albeit not all of them significantly. Most importantly for our research question, we do not find any significant difference between the impact of wrong decisions in favor of higher or lower status teams; neither for one of the two error types nor for one of the two status measures. Results are robust when we run the four types of regressions without performance grade (see Table A11). These results do not support the idea that career concerns facilitate the status bias. If anything, referees face longer breaks when making type II errors concerning low-status when compared with high-status clubs. Beyond that they seem to be facing longer breaks when favoring high-status clubs by wrongfully awarding them penalties and goals (type I errors). However, none of these differences is significant as shown in the last column of each table.
Finally, assuming that referees close to the retirement age of 47 years might be less concerned with their future career, we would expect a significant difference in the status bias between those referees and others. We do not find this difference (see Table A12), which reinforces the view that the status bias is not mediated by career concerns.
Summing up, we do not find consistent evidence for the hypothesis that the bias is driven by career concerns, neither for the exit probability, the pause between matches, nor for retiring referees.
6.2 Social Pressure
The literature on the home bias discussed in Section 2 finds evidence that this bias is (partially) driven by social pressure. We hence analyze if social pressure is also related to the status bias. Specifically, we investigate if the status bias is more pronounced when high-status teams play at home or when the travel distance for the fans of the higher status team is low. Low travel distance is defined as a linear distance between home and away team below 150 km. Overall, our results displayed in Table 7 do not lend support for the hypothesis that the status bias may be driven by social pressure: The interaction between status and home is only negative for one out of our four status measures, and only at the 10% significance level. Travel distance of away fans has no impact, neither on the frequency of type II errors itself nor on the impact of status on type II errors.22
Type II Errors: Social Pressure
| Ahead in ATT | Difference in ATT position | Ahead in members | Difference in member position | |||||
|---|---|---|---|---|---|---|---|---|
| (1) | (2) | (3) | (4) | (5) | (6) | (7) | (8) | |
| Status | −0.011 | −0.021** | −0.001*** | −0.0007*** | −0.0040 | −0.0005 | −0.0004 | −0.0003 |
| (0.007) | (0.010) | (0.000) | (0.0003) | (0.0074) | (0.0097) | (0.0004) | (0.0004) | |
| Status × Home (d) | −0.015* | 0.000 | −0.0072 | −0.0002 | ||||
| (0.009) | (0.000) | (0.0087) | (0.0004) | |||||
| Home (d) | 0.004 | −0.005 | 0.0013 | −0.0034 | ||||
| (0.007) | (0.005) | (0.0067) | (0.0052) | |||||
| Status × low travel distance (d) | 0.003 | −0.0001 | −0.0130 | −0.0004 | ||||
| (0.013) | (0.0003) | (0.0134) | (0.0004) | |||||
| Low travel distance (d) | −0.008 | −0.0063 | 0.0041 | −0.0018 | ||||
| (0.008) | (0.0044) | (0.0080) | (0.0046) | |||||
| N | 12,232 | 12,232 | 12232 | 12,232 | 12,232 | 12,232 | 12,232 | 12,232 |
Notes: Linear probability model estimates; (d) for discrete change of dummy variable from 0 to 1. The dependent variable is a dummy for wrong calls among penalties and goals that should have been awarded. Debatable decisions are excluded. The regressions include controls for the home team, inverse of odds, referee experience and average performance in the season, previous wrong decisions (both favorable and unfavorable for the affected and unaffected team), type of the situation (goal or penalty), the last 10 min of the game, closeness of the game, decisiveness of the call, and the number of spectators. Furthermore, season, match day, referee, and team-fixed effects are included. Standard errors in parentheses are clustered at the team level.
p < 0.01,
p < 0.05,
p < 0.1.
As a robustness check, Table A13 restricts attention to games where the attendance to capacity ratio is in the first decile or first quartile of all observations. We use the attendance to capacity ratio, because social pressure may be highest if stadiums are fully packed. Results are similar to those for the full sample. In addition, Figure A5 shows attendance depending on the status of away teams. At least for our ATT measure, we do not find that high-status teams attract larger crowds. Note that using home attendance would not be a good measure here as high-status clubs have larger stadiums due to their longer membership in the Bundesliga.
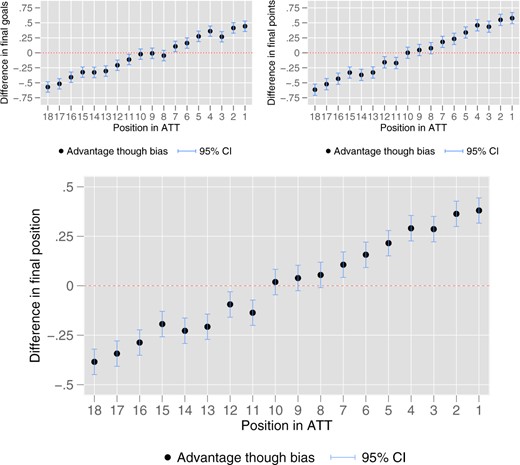
BoE Analysis for Difference in Outcomes. Notes: Tests for difference in means between for each level of status (according to a fictional ATT) from 100,000 simulated seasons. A positive difference in means indicates that the team at this position in the status table was advantaged. In each simulation, we define 18 teams which only differ in the position in a fictional ATT (positions 1–18). We simulate 34 games for each team by drawing the number of goal events and penalty events for home and away clubs from the empirical distribution. We then use our estimates on the probability that a referee makes a type II error and randomly determine whether a goal or penalty event is not given depending on the status of the affected team. In 50,000 simulations, we instead use the average probability of a type II error, to simulate the season in there was no status bias. For penalties that are awarded, we randomly determine if they lead to a goal (again we draw the probability from our data). We assign a team three points for a game if it has received more goals in the simulation than its opponent. If both teams received the same amount of goals, we assign 1 point for each team. Finally, we combine all games of the season to calculate the overall goals, points, and the position in the season’s points ranking. For each club (i.e., level of status), we perform a difference in means test for the goals, points, and positions in the ranking between simulations with and without status bias.
6.3 Preferences and the Referees’ Adolescence
A final potential mechanism is based on the observation that spectators develop long-term fandom for the leading clubs during their childhood and adolescence (Stephens-Davidowitz 2014). Depending on their age, different clubs were leading the field during the referees’ childhood and adolescence, and we explore if this correlates with their (wrong) decisions.23 The variable “Ahead in rolling ATT” is a dummy variable that takes the value “1” if a club was, on average, higher ranked than its opponent during the period where the referee was in the age group specified in the columns. Importantly, as we also control for the ATT position at the very moment of the actual game, we estimate whether the relative status of clubs during a referee’s adolescence has an impact beyond the actual status difference of the two clubs.
We consider three different age groups for referees and four different specifications that vary by the games included: The first specification includes all games and the second (third) only those where the average difference in the ATT during the period in the respective column was at least five (10) ranks. The fourth specification uses the difference in the rolling ATT. Results in Table 8 lead us to reject the hypothesis that the ranking of clubs during the referees’ adolescence matters beyond the current impact of status. Table A14 considers in addition whether the status bias differs by the distance between a referee’s birthplace and the high-status team. We indeed find a somewhat higher status bias for type II errors when the distance is below 350 km, but the difference in the coefficients for the subsamples with distances below and above 350 km is never significant. Overall, none of our investigated mechanisms sheds light on what drives the bias.
Type II Errors: Status by Referee’s Birth Year
| (1) | (2) | (3) | |
|---|---|---|---|
| 1–10 y.o. | 11–20 y.o. | 21–30 y.o. | |
| Ahead in rolling ATT | 0.0018 | −0.0019 | −0.0049 |
(0.0052) | (0.0054) | (0.0056) | |
N | 12,232 | 12,232 | 12,232 |
| Ahead in rolling ATT (diff. ) | 0.0077 | 0.0033 | −0.0057 |
(0.0073) | (0.0082) | (0.0077) | |
N | 9176 | 9176 | 9176 |
| Ahead in rolling ATT (diff. ) | −0.0041 | −0.0023 | −0.0067 |
(0.0101) | (0.0143) | (0.0141) | |
N | 6296 | 6296 | 6296 |
| Difference in rolling ATT | 0.0001 | 0.0001 | 0.0000 |
(0.0001) | (0.0001) | (0.0001) | |
| N | 12,232 | 12,232 | 12,232 |
Notes: Linear probability model estimates; (d) for discrete change of dummy variable from 0 to 1. The dependent variable is a dummy for wrong calls among penalties and goals that should have been awarded. Debatable decisions are excluded. The variable “Ahead in rolling ATT” is a dummy variable indicating if the affected team was ahead in the rolling ATT (in terms of collected points in the Bundesliga) when the referee was in the age indicated in the respective column. Similarly, “Ahead in rolling ATT (diff. )” and “Ahead in rolling ATT (diff. )” are dummy variables taking value 1 if the affected team was ahead in the rolling ATT, but the sample is restricted to only include games in which the difference in the ATT was at least 5 and 10, respectively. Importantly, all regressions include controls for whether the team affected by the decision is ahead in full ATT (our benchmark variable specification) or the ATT-position difference from the full ATT. The regressions furthermore include controls for the home team, inverse of odds, referee experience and average performance in the season, type of the situation (goal or penalty), the last 10 min of the game, closeness of the game, decisiveness of the call, the number of spectators, and stadiums with running tracks. Furthermore, season, match day, referee, and team-fixed effects are included. Standard errors in parentheses are clustered at the game level.
p < 0.01,
p < 0.05,
p < 0.1.
7. Discussion
7.1 Anticipation Effect
A somewhat puzzling result of our analysis is that we find pronounced favoritism for type II errors but not so for type I errors. To see why this is puzzling, suppose referees receive a noisy signal S about whether a penalty is deserved or not and grant a penalty for club if the signal exceeds a threshold .24 A referee bias then means that the threshold is lower for high-status clubs, . For any given distribution of signals, less type II errors should then inevitably lead to more type I errors. We now discuss, somewhat speculatively, potential reasons for our findings.
First, one might point to lower statistical power as there are only 90 incorrectly awarded penalties and 266 incorrectly awarded goals (type I errors) compared with 620 incorrectly denied penalties and 184 incorrectly denied goals (type II errors), and overall 3,065 compared with 12,232 observations. However, as coefficients are close to zero, one could hardly expect to get significant results for a higher number of observations. More interestingly, when a penalty is truly undeserved, then referees make only 3.6% wrong decisions (type I errors) compared with 46.8% type II errors for truly deserved penalties. Hence, referees are very reluctant to grant potentially undeserved penalties, which ceteris paribus reduces the chances of finding an effect.
The in our view most interesting potential explanation, however, is based on the players’ incentives, and laid out in a simple model in the Appendix. Assume players anticipate the referee bias, that is, they form rational expectations on . Suppose further that this does not influence our estimation of type II errors, as all players deserving a penalty always take their chances anyway (we will discuss this assumption below). Finally, assume that, for undeserved penalties, situations can be ordered by the probability that the signal a referee receives weakly exceeds . Due to , players from high-status clubs dive more often which, in equilibrium, reduces the average strength of the signals referees receive. As a consequence, there are two countervailing effects of status on type I errors: For any signal given, referees are more likely to grant an undeserved penalty for clubs with higher status, which leads ceteris paribus to more type I errors. But if this is anticipated, then the average strength of a signal is lower for higher status clubs, which leads ceteris paribus to less type I errors. Anticipation would hence imply that our empirical model systematically underestimates the bias for type I errors.
To test whether our data are in line with anticipation, Figure 4 shows the ratio of deserved penalties over all penalties. For each game, differences in ATT ranking and membership are divided into five different classes, ranging from rather small differences of 1–5 to large differences of more than 21. While we do observe a lower share for clubs with higher ATT and higher membership ranking for three out of five classes, these differences are insignificant in all but one comparison. Figure A7 shows that the ratio of deserved goals over all goals does not differ between high- and low-status clubs. Note also that, if anticipation mattered also for type II errors, this would just mean that our estimation would underestimate the true referee bias, as the signal that a penalty is deserved would be stronger for lower status clubs.
7.2 The Level of Analysis: Players versus Clubs
While the paper by Kim and King (2014) discussed in Section 1 identifies favoritism toward players with more All-Star Game nominations in baseball, we focus on a potential referee bias at the club level. Both perspectives are important as status may well lead to biases at the individual level (for instance for promotion decisions) and at the firm level (for instance, when the perception of product quality or safety issues depends on the status of firms). Identifying a bias at the player level is less promising for soccer for two reasons: First, there are only few observations per player. Second, it is likely that there are countervailing effects, as in particular prominent strikers have a (bad) reputation for their susceptibility to diving.25 Table A15 accounts for the potential interplay of player and club status by controlling for a player’s status with his transfer market value and by whether he played for the national team in a World Cup tournament. We also include the players’ age and nationality. Results are robust.26
7.3 The Impact of the Bias on the Overall Ranking
We find that the probability of suffering from a type II error is 2 percentage points lower for clubs with the higher status in a game. To assess the importance of this, we now conduct a thought experiment where we define hypothetically 18 teams which differ only in their position in a fictional ATT (positions 1–18). We then simulate a season consisting of 306 games where the number of goal events and penalty events follows the empirical distribution in our data. We then use our estimates on the impact of status on the probability of type II errors to compare two final rankings in the season, those where referees are biased and those where they are not.
Overall, we simulate 100,000 full seasons. In half of these, we treat referees as biased. For the other 50,000 simulations, we treat referees as unbiased. For each game of the 306 games in each simulated season, we randomly draw the number of goal and penalty events from the empirical distribution in our data. Given these events, we randomly determine whether the referee makes a type II error. In seasons in which referees are biased, we hence let them make a mistake and deny a penalty or goal that should have been awarded in around 7.7% of the cases where the affected club is behind in the fictional ATT. For higher status clubs, we let this happen in around 5.7% of the events (both probabilities are taken from our benchmark regressions in Table 3). In seasons without status bias, we fix the probability to around 6.6%, the average probability of type II errors. Next, for penalties that are awarded, we randomly determine if they lead to a goal (again we draw the probability from our data). We assign a club three points for a game if it has received more goals in the simulation than its opponent. If both clubs received the same amount of goals, we assign one point for each club. Finally, we combine all games of the season to calculate the overall goals, points, and the position in the season’s fictional points ranking. For each club (i.e., level of status), we then perform a difference in means test for the goals, points, and positions in the ranking between simulations with and without status bias. The results are shown in Figure 5.
We find that on average the top ranking club will receive around 0.45 more goals, 0.6 more points and will rank around 0.35 positions higher in the final table when referees are biased when compared with seasons where they are not. Clubs in the middle of the hypothetical ATT do not benefit or loose out due to the status bias; however, clubs at the bottom of the ranking receive significantly fewer goals, points, and are ranked lower in the final table. Since the final table translates into important financial benefits for the teams, our results are also meaningful to clubs in a financial sense.
7.4 Extra Time
Following the seminal paper by Garicano et al. (2005), many papers have used the extra time granted for injuries to identify a home bias. This identification strategy is instructive, but based on the assumption that the correct extra time is independent of whether the home or the away team leads. Given the pronounced home advantage in soccer, however, one may well argue that many away teams will keep playing defensively even when they are behind; hoping for a lucky punch. Home teams are likely to attack fiercely when they are behind, which then leads to more fouls by the away team and thereby to a longer justified extra time. A similar argument can be made a fortiori for favorites which will increase their attacks when they are behind. No such argument can be made for clubs with higher long-term status, as the score-dependent style of play should depend on the current strength and not on long-term status.
Our data does not allow us to disentangle interpretations based on a bias or on the score-dependent style of play, but we can check whether arguments based on the latter interpretation are consistent with what we observe. Note first that both interpretations predict that extra time should be longer if the home team is behind in close games, defined as games with a maximum goal difference of one. This effect should be smaller or even die out if one considers instead games with at least two goals difference. Similar to Garicano et al. (2005), these hypotheses are supported by our data; see Table 9 (for close games) and Table A16 (for other games).
Extra Time in Close Games
| (1) | (2) | (3) | (4) | |
|---|---|---|---|---|
| Home | −0.1437** | −0.1502** | −0.1352** | −0.1589** |
| (0.0673) | (0.0679) | (0.0685) | (0.0682) | |
| Ahead in ATT team in front (d) | −0.0385 | |||
| (0.0628) | ||||
| ATT-position difference (team in front) | −0.0018 | |||
| (0.0020) | ||||
| Ahead in members team in front (d) | −0.0104 | |||
| (0.0656) | ||||
| Member–position difference (team in front) | −0.0029 | |||
| (0.0029) | ||||
| Win probability (odds based) | −0.9249*** | −0.8883*** | −0.9716*** | −0.8456*** |
| (0.2416) | (0.2436) | (0.2521) | (0.2617) | |
| Substitutions (halftime 2) | 0.1159*** | 0.1164*** | 0.1156*** | 0.1155*** |
| (0.0337) | (0.0337) | (0.0338) | (0.0337) | |
| Red cards (halftime 2) | 0.2454*** | 0.2448*** | 0.2453*** | 0.2461*** |
| (0.0653) | (0.0652) | (0.0653) | (0.0652) | |
| Yellow cards (halftime 2) | 0.1123*** | 0.1123*** | 0.1125*** | 0.1119*** |
| (0.0183) | (0.0183) | (0.0183) | (0.0184) | |
| Penalties (halftime 2) | −0.0340 | −0.0333 | −0.0350 | −0.0336 |
| (0.0652) | (0.0650) | (0.0652) | (0.0650) | |
| Goals (halftime 2) | 0.0015 | 0.0019 | 0.0010 | 0.0018 |
| (0.0270) | (0.0271) | (0.0270) | (0.0268) | |
| Attendance of visitors | 0.0047*** | 0.0048*** | 0.0048*** | 0.0048*** |
| (0.0017) | (0.0017) | (0.0017) | (0.0017) | |
| Season FE | Yes | Yes | Yes | Yes |
| Referee FE | Yes | Yes | Yes | Yes |
| N | 1460 | 1460 | 1460 | 1460 |
| R2 | 0.2176 | 0.2178 | 0.2174 | 0.2180 |
Notes: OLS estimates; (d) for discrete change of dummy variable from 0 to 1. The dependent variable is the extra time in the second half in minutes. The sample is restricted to include only games where the goal difference before the beginning of the extra time is exactly 1. Robust standard errors in parentheses.
p < 0.01,
p < 0.05,
p < 0.1.
Assuming that the extra time is unbiased and depends on the style of play, however, yields two additional hypotheses:
There should be a positive impact of current strength and hence a negative coefficient for odds. Arguably, this effect should not be restricted to close games as (strong) favorites will still try catching up if they are more than just one goal behind. This is what we find: Odds are highly significantly negative regardless of the separation between close and other games.
There should be no impact of status, neither for close nor for other games, as the only reason why long-term status should influence the average number of interruptions is via their correlation with actual strength, which is controlled for. In line with this argument, we find no evidence for an impact of status on extra time.
Our data on extra time are hence not only consistent with the interpretation in the paper by Garicano et al. (2005), but also with the alternative hypothesis that differences in extra time are driven by actual differences in interruptions. Therefore, one might argue that our identification strategy, based on type I and type II errors for goals and penalties that can directly reconstructed from video footage, is superior for our research question.
8. Conclusion
Biases in legal decision-making are difficult to identify, as type II errors (wrongful acquittals) are hardly observable, and because type I errors (wrongful convictions) are only observed for the subsample of subsequently exonerated convicts. Our data on professional soccer allow for a clean identification of a status bias, as each referee decision is ex post categorized as “correct,” “wrong,” or “debatable” by professional experts. Decisions can precisely be reconstructed ex post with video footage. As experts are conservatively labeling any decision as debatable where some doubt remains, it seems justified to assume that our data contain very few measurement errors.
Our main proxy for status is an index measuring each club’s position in the all-time ranking at the beginning of each season. Controlling for all available observables at the level of clubs, players, referees, and proxies for social pressure, we find pronounced favoritism toward higher status clubs for type II errors: Clubs with higher status suffer less often from penalties and goals that are mistakenly denied. We suggest anticipation of the referee bias by players as a potential explanation for why we do not identify a similar bias for type I errors. While the identification of the bias for type II errors itself is robust, our attempts of identifying underlying reasons are basically unsuccessful: We investigate career concerns, social pressure, and favoritism based on the clubs’ status during a referee’s adolescence as potential mechanisms but find no conclusive evidence.
One might question why we do not utilize debatable decisions. There are two reasons for this: Most straightforward, identifying type I and type II errors requires to know whether a goal or a penalty is truly deserved or not, and this is not known by definition of debatable decisions. Still, one could consider the percentages of debatable decisions in which penalties were granted for higher and lower status clubs. Such a procedure, however, could easily be challenged because debatable decisions may well differ between different clubs, depending on the style of play. And given that non-debatable decisions are clearly identified as right or wrong, we see no benefit of diluting the analysis by adding debatable decisions.
As our effects are sizable, the question for remedies arises. First and most generally, biases should be frankly acknowledged as the exposure to discrimination is known to decline when individuals are made aware of them (e.g., Stewart et al. 2012; Pope et al. 2018). Second and more specifically, our study provides strong arguments for video proofs, even though the current experience after the video proof has been introduced in the season 2017/18 turns out to be more difficult than expected. This, however, can mainly be attributed to the fact that not only clearly wrong but also debatable decisions are often reversed. Opponents of video proofs usually argue that, on average and within a larger time horizon, all clubs benefit and suffer from false decisions to a similar degree. Our paper shows that this presumption is false.
We are grateful to the co-editor (Raffaella Sadun), two anonymous referees, Martin Artz, David Feess, Gerd Muehlheusser, Christoph Schumacher, Roee Sarel, Dana Sisak, and Olivier Marie for very helpful comments as well as to Dominik Boddin for sharing data on transfer market values of players with us. We also thank conference participants at the EEA Annual Meeting in Lisbon (2017), GEABA Annual Meeting in Stuttgart, and seminar participants at Frankfurt School of Finance and Management, TU Berlin, WHU Vallendar, Massey University Albany, Erfurt University, and Erasmus University Rotterdam. Martin Dorschel, Adrian Schlesiger, and Maximilian Westhoff provided excellent research assistance. All remaining errors are ours.
Footnotes
We will provide more detailed information on Sportec Solutions in the data section.
Granting a goal can hardly be interpreted as a “conviction” but the logic still applies.
Among soccer fans, the idea that stronger clubs receive favorable treatment from referees is ubiquitous. A simple Google search yields hundreds of press articles by major newspapers about those incidents just for the 2014/2015 season. In UK, newspapers like the Telegraph even do their own “back of the envelope”-calculations to show proof that stronger clubs are being treated advantageously by the referee. Scandalous decisions such as in the 2014 World Cup where the Japanese referee granted the top team Brazil an obviously undeserved penalty against the underdog Croatia are seen as anecdotal evidence for a celebrity bias.
Dohmen and Sauermann (2016) provide a comprehensive survey of scholarly work on referee decisions in professional sports.
Former years are excluded as either odds or decisions for denied penalties are not available. More recent seasons are excluded as the data provider has changed the data collection mode.
Older numbers are hard to find but in 2009/2010 (i.e., before the base salary was introduced) referees earned 3600 euros per game.
A player of an attacking club who kicks a ball is offside if, at the moment the ball was passed to them, less than two players of the competing club are between them and the goal line. In case of offside, the other club is awarded a free kick.
See http://www.sportec-solutions.de; own translation from German.
More detailed information on referees is taken from the Web site kicker.de and is described when analyzing referee behavior at a more disaggregated level in Section 5.
According to the FIFA rules, “a goal is scored when the whole of the ball passes over the goal-line, between the goalposts and under the crossbar, provided that no infringement of the laws of the game has been committed previously by the club scoring the goal”.
In addition to (wrongly awarded) penalty and goals, referee decisions on red cards which lead to dismissals from the field can be decisive for the final result. We cannot utilize red cards as we have no information on fouls where red cards were incorrectly not awarded. We do also not utilize data on decisions classified as debatable (see the last two rows in Table 1) as type I and type II errors cannot be identified without knowing the correct decision.
We collect historic data for the number of members of a club using a number of sources, including the official Web sites and reports of the clubs, scientific and popular publications, and press articles, as well as historical versions of the Web sites kicker.de and weltfussball.de. We furthermore add data from historical editions of the printed version of the kicker magazine for the years 2001–2010. As we cannot find data for all years and clubs, we use a growth model to extra-/interpolate the missing values. To do so, we take the log of the members data, extra-/interpolate and for each club before delogging again. We extra-/interpolate for 60 of our 236 club × season pairs (see also Figure A1). While this is a substantial fraction, two points increase our confidence in the results we provide based on this data. First, for teams for which full data are available, member-growth seems to be relatively close to a log-linear form, making it more credible that a similar process underlies growth in other teams. Second and more importantly, our analysis does not take into account the exact member numbers but rather the relative ordering of teams in the yearly members-count and is thus insensitive to a slight misspecification in how members develop.
The favorite-longshot bias expresses that favorites are undervalued compared with longshots (see the overview in Ottaviani and Sørensen2008), which can be attributed to the overweighting of small probabilities when estimating the representative bettor’s preferences from the data.
Feddersen et al. (2017) find that bookmakers’ response to the popularity of clubs does not reduce the informational efficiency of betting markets.
In the ELO system, a number is assigned to each club and updated after each game it plays. Generally a clubs’ ELO increases after a win and decreases after a loss. The number by which it changes then depends on the ELO difference between the club and its opponent. ELO numbers are commonly used to calculate win probabilities in zero-sum games such as chess or soccer. Hvattum and Arntzen (2010) show that ELO ratings provide a good measure of clubs’ strength. Furthermore, win probabilities based on the ELO ratings are good predictors of the game outcome. We collect ELO numbers for each club and week from clubelo.com.
Peeters (2018) shows that transfer market values of a club’s players provide a good proxy for team strength, though odds and ELO ratings possibly outperform this measure in minimizing forecasting errors.
We will get back to the quantitative importance of the bias on the end-of-the-season ranking in Section 7.
This contradicts a common perception of soccer fans that referees rather tend to make up for mistakes, for instance after becoming aware of them during the half-time break, by granting critical or undeserved penalties to the other team.
From the most respected German soccer magazine “kicker,” we collected data on the referees’ career, names, date of birth, alternative job, birth place, nationality, club, confederation, first appearance in Bundesliga, all games refereed (including results and cards shown), and performance in these games for the years 1995–present in Bundesliga, 2. Bundesliga and 3. Liga, DFB-Pokal (German soccer cup), Europe League, and Champions League.
We duplicated the analysis for type I errors but don’t find any significant effect, which is not surprising given that status itself is insignificant for type I errors.
See Figure A6 for the distribution of birth years of referees in our sample.
H (L) stands for high (low) status.
Most prominently, a former German world class striker had the nickname “Diver Klinsmann” after joining Tottenham Hotspurs (https://thesefootballtimes.co/2018/07/29/when-jurgen-klinsmann-dived-his-way-into-the-heart-of-english-football/), and other world class players including Neymar seem to have difficulties of getting even deserved penalties due to their bad reputation.
To complement our analyses, we have thought about using NBA data which, however, is available only since 2014/2015; see https://official.nba.com/nba-officiating-last-two-minute-reports-archive. Furthermore, clubs occasionally change locations, which reduce the importance of status at the club level.
There may be some exceptions where players keep playing in case of deserved penalties, but arguing that these few cases could influence the difference in type II errors between high and low-status clubs seems rather far-fetched to us.
Equivalently, we could assume that player from high-status clubs always correctly assume while players from low-status clubs assume either or .
Appendix A
Type II Errors: Separate for Goals and Penalties
| (1) | (2) | |
|---|---|---|
| Penalties | Goals | |
| Ahead in ATT (d) | −0.0978*** | −0.0140*** |
| (0.0370) | (0.0034) | |
| Home (d) | −0.0761** | 0.0008 |
(0.0380) | (0.0034) | |
N | 1324 | 10,908 |
| ATT-position difference | −0.0043*** | −0.0004*** |
| (0.0014) | (0.0001) | |
| Home (d) | −0.0846** | 0.0008 |
(0.0386) | (0.0034) | |
N | 1324 | 10,908 |
| Ahead in members (d) | −0.0440 | −0.0038 |
| (0.0374) | (0.0034) | |
| Home (d) | −0.0705* | 0.0025 |
(0.0380) | (0.0034) | |
N | 1324 | 10,908 |
| Member–position difference | −0.0024 | −0.0003** |
| (0.0019) | (0.0002) | |
| Home (d) | −0.0737* | 0.0013 |
(0.0390) | (0.0035) | |
| N | 1324 | 10,908 |
Notes: Linear probability model estimates; (d) for discrete change of dummy variable from 0 to 1. The dependent variable is a dummy variable that takes value 1 for wrong calls among penalties and goals that should have been awarded. Debatable decisions are excluded. In the first column the sample is restricted to include only decision about penalties. The second column contains only decisions on goals. The regressions include controls for the home team, inverse of odds, referee experience and average performance in the season, the last 10 min of the game, closeness of the game, decisiveness of the call, the number of spectators, and stadiums with running tracks. Furthermore, season, match day, referee, and team-fixed effects are included. Standard errors in parentheses are clustered at the game level.
p < 0.01,
p < 0.05,
p < 0.1.
Ordered Probit Models on Game Outcome and Status
| Points for home team | (1) | (2) | (3) | (4) | (5) | (6) | (7) | (8) |
|---|---|---|---|---|---|---|---|---|
| Win probability (odds based) | 2.7850*** | 2.7585*** | 2.8138*** | 2.7582*** | ||||
| (0.1592) | (0.1598) | (0.1612) | (0.1668) | |||||
| Win probability (elo based) | 2.2636*** | 2.2488*** | 2.2574*** | 2.1845*** | ||||
| (0.1401) | (0.1415) | (0.1402) | (0.1438) | |||||
| Ahead in ATT | 0.0050 | 0.0331 | ||||||
| (0.0436) | (0.0434) | |||||||
| ATT-position difference | −0.0007 | −0.0013 | ||||||
| (0.0014) | (0.0014) | |||||||
| Ahead in members | −0.0135 | 0.0388 | ||||||
| (0.0450) | (0.0444) | |||||||
| Members–position difference | −0.0008 | −0.0036* | ||||||
| (0.0020) | (0.0019) | |||||||
| Visitors (scaled) | 0.0206 | 0.0228 | 0.0182 | 0.0205 | 0.0227 | 0.0212 | 0.0182 | 0.0130 |
| (0.0201) | (0.0200) | (0.0205) | (0.0204) | (0.0204) | (0.0203) | (0.0209) | (0.0207) | |
| N | 3891 | 3891 | 3891 | 3891 | 3891 | 3891 | 3891 | 3891 |
| Pseudo-R2 | 0.0522 | 0.0465 | 0.0523 | 0.0465 | 0.0523 | 0.0465 | 0.0523 | 0.0469 |
Notes: Ordered probit model estimates; the outcome variable is categorical and takes value 0 for a lost game, value 1 for a draw, and value 2 for a won game from the perspective of the home game. Win probability and status are also defined from the perspective of the home team. Note that the sample is slightly restricted by the availability of data for win probability (87 missing games). Robust standard errors in parentheses.
p < 0.01,
p < 0.05,
p < 0.1.
Description of Variables
| Variable | Description | Availability | Min. | Max. | Mean | ||||
|---|---|---|---|---|---|---|---|---|---|
| Home | Dummy variable for the home club. Takes value 1 if the affected club is also the home club. | 2000–2012 | 0.00 | 1.00 | 0.58 | −0.02 | −0.02 | −0.01 | −0.02 |
| Inverse of betting odds | Continuous value of inverse of odds from the perspective of the affected club. Calculated as the inferred probability of winning. | 2000–2012 | 0.05 | 0.91 | 0.45 | 0.38 | 0.40 | 0.40 | 0.46 |
| Referee experience | Referee’s experience in the Bundesliga. Based on the number of games refereed in the Bundesliga at the time of the present game. | 2000–2012 | 0.00 | 336.00 | 105.27 | 0.00 | −0.00 | 0.00 | −0.01 |
| Ref. avg. performance (season) | Average performance of the referee in the current season (excluding performance in the game under consideration)—based on grades collected from kicker.de. Scaled to have 0 mean and standard deviation 1. | 2000–2012 | −1.30 | 1.09 | −0.03 | −0.01 | −0.00 | 0.00 | −0.00 |
| Prev. fav. wrong call | Dummy variable for previous favorable wrong decisions. Takes value 1 if the referee has in the previously wrongfully awarded a penalty or goal to the affected club. | 2000–2012 | 0.00 | 1.00 | 0.02 | 0.01 | 0.01 | 0.01 | 0.01 |
| Prev. unfav. wrong call | Dummy variable for previous unfavorable wrong decisions. Takes value 1 if the referee has in the previously wrongfully denied a penalty or goal to the affected club. | 2000–2012 | 0.00 | 1.00 | 0.06 | 0.01 | 0.00 | −0.01 | −0.00 |
| Goal | Dummy variable for decisions that involve a goal. Takes value 1 for decisions that are about goals. | 2000–2012 | 0.00 | 1.00 | 0.72 | 0.02 | 0.03 | 0.04 | 0.04 |
| Last 10 min | Dummy variable for the last 10 min of a game. Takes value 1 for decisions that are undertaken in the last 10 min of regular playing time in a game. | 2000–2012 | 0.00 | 1.00 | 0.15 | −0.01 | −0.02 | 0.00 | −0.01 |
| Close game | Dummy for close games. Takes value 1 if the game was (at the time of the decision) a close game, that is, less than one goal difference between affected and unaffected club. | 2000–2012 | 0.00 | 1.00 | 0.82 | −0.00 | 0.00 | −0.00 | 0.00 |
| Decisive call | Decisiveness of the referee call. Takes value 1 if the result of the game would be changed based on the referees decision if the game were to end directly after it. Takes value 0.75 for decisive penalties, based on the probability of scoring a penalty. | 2000–2012 | 0.00 | 1.00 | 0.58 | −0.04 | −0.03 | −0.04 | −0.04 |
| Spectators (scaled) | Number of spectators in the stadium. Scaled to have 0 mean and standard deviation 1. | 2000–2012 | 0.12 | 4.69 | 2.12 | 0.08 | 0.08 | 0.10 | 0.09 |
| Stadium with running track | Dummy variable for stadiums with a running track. Takes value 1 if the stadium has a running track. | 2000–2012 | 0.00 | 1.00 | 0.27 | 0.03 | 0.02 | 0.01 | 0.01 |
| Shots on goal | 2000–2007 | 2.00 | 41.00 | 15.73 | 0.18 | 0.20 | 0.17 | 0.21 | |
| Shots on goal (opponent) | Shots on goal of the affected club (in the entire game, including time after the call). | 2000–2007 | 1.00 | 37.00 | 13.88 | −0.20 | −0.21 | −0.17 | −0.21 |
| Fouls | Fouls by the affected club (in the entire game, including time after the call). | 2000–2007 | 4.00 | 39.00 | 19.33 | −0.07 | −0.08 | −0.06 | −0.06 |
| Fouls (opponent) | Fouls by the unaffected club (in the entire game, including time after the call). | 2000–2007 | 4.00 | 39.00 | 19.60 | 0.00 | 0.01 | 0.00 | −0.03 |
| Ball contacts | Ball contacts by the affected club (in the entire game, including time after the call). | 2000–2007 | 354.00 | 873.00 | 579.87 | 0.27 | 0.32 | 0.25 | 0.30 |
| Ball contacts (opponent) | Ball contacts by the unaffected club (in the entire game, including time after the call). | 2000–2007 | 352.00 | 822.00 | 570.73 | −0.24 | −0.30 | −0.22 | −0.27 |
| Ball possession | 2000–2007 | 30.10 | 69.90 | 50.38 | 0.29 | 0.36 | 0.27 | 0.33 | |
| Ball possession (opponent) | Ball possession by the affected club in percent (in the entire game, including time after the call). | 2000–2007 | 30.10 | 69.90 | 49.62 | −0.29 | −0.36 | −0.27 | −0.33 |
Notes: Description of control variables. , and ρ4 refer to the correlation coefficient between the control variable and the high-status variables “Ahead in ATT,” “ATT-position difference,” “Ahead in members,” and “Member-position difference,” respectively, over the entire observation period.
Type II Errors: Different Levels of Status Difference
| (1) | (2) | (3) | |
|---|---|---|---|
| Ahead in ATT (d) | −0.0204*** | −0.0280*** | −0.0334*** |
(0.0051) | (0.0074) | (0.0113) | |
N | 12,232 | 9176 | 6296 |
| Ahead in members (d) | −0.0087* | −0.0117* | −0.0148 |
(0.0050) | (0.0071) | (0.0113) | |
| N | 12,232 | 8813 | 5562 |
| (1) | (2) | (3) | |
|---|---|---|---|
| Ahead in ATT (d) | −0.0204*** | −0.0280*** | −0.0334*** |
(0.0051) | (0.0074) | (0.0113) | |
N | 12,232 | 9176 | 6296 |
| Ahead in members (d) | −0.0087* | −0.0117* | −0.0148 |
(0.0050) | (0.0071) | (0.0113) | |
| N | 12,232 | 8813 | 5562 |
Notes: Linear probability model estimates; (d) for discrete change of dummy variable from 0 to 1. The dependent variable is a dummy variable that takes value 1 for wrong calls among penalties and goals that should have been awarded. Debatable decisions are excluded. The sample is restricted to include only games where the difference in the position in ATT (members) of the clubs in the respective season was at least 0, 5, or 10 as indicated by the respective column. The regressions include controls for the home team, the inverse of odds, referee experience and average performance in the season, type of the situation (goal or penalty), the last 10 min of the game, closeness of the game, decisiveness of the call, the number of spectators, and stadiums with running tracks. Furthermore, season, match day, referee, and team-fixed effects are included. Standard errors in parentheses are clustered at the team level.
p < 0.01,
p < 0.05,
p < 0.1.
Type II Errors: Different Performance Measures
| (1) | (2) | (3) | (4) | (5) | (6) | (7) | (8) | |
|---|---|---|---|---|---|---|---|---|
| Ahead in ATT (d) | −0.0105*** | −0.0214*** | −0.0220*** | −0.0216*** | −0.0204*** | −0.0215*** | −0.0138** | −0.0168** |
| (0.0038) | (0.0050) | (0.0050) | (0.0051) | (0.0052) | (0.0052) | (0.0067) | (0.0069) | |
| N | 12,232 | 12,232 | 12,232 | 11,881 | 12,232 | 12,232 | 7,525 | 7,298 |
| ATT-position difference | −0.0003** | −0.0008*** | −0.0009*** | −0.0008*** | −0.0008*** | −0.0009*** | −0.0004 | −0.0004 |
| (0.0001) | (0.0002) | (0.0002) | (0.0002) | (0.0002) | (0.0002) | (0.0002) | (0.0003) | |
| N | 12,232 | 12,232 | 12,232 | 11,881 | 12,232 | 12,232 | 7,525 | 7,298 |
| Ahead in members (d) | −0.0046 | −0.0106** | −0.0107** | −0.0105** | −0.0087* | −0.0098** | −0.0177*** | −0.0181*** |
| (0.0037) | (0.0048) | (0.0049) | (0.0050) | (0.0050) | (0.0050) | (0.0065) | (0.0067) | |
| N | 12,232 | 12,232 | 12,232 | 11,881 | 12,232 | 12,232 | 7,525 | 7,298 |
| Member-position difference | −0.0002 | −0.0006*** | −0.0007*** | −0.0006** | −0.0005** | −0.0006** | −0.0007* | −0.0006* |
| (0.0001) | (0.0002) | (0.0002) | (0.0002) | (0.0003) | (0.0002) | (0.0003) | (0.0004) | |
| N | 12,232 | 12,232 | 12,232 | 11,881 | 12,232 | 12,232 | 7,525 | 7,298 |
| Control variables | Yes | Yes | Yes | Yes | Yes | Yes | Yes | Yes |
| Season FE | No | Yes | Yes | Yes | Yes | Yes | Yes | Yes |
| Team FE | No | Yes | Yes | Yes | Yes | Yes | Yes | Yes |
| Match day FE | No | Yes | Yes | Yes | Yes | Yes | Yes | Yes |
| Referee FE | No | Yes | Yes | Yes | Yes | Yes | Yes | Yes |
| Performance controls: Last season | No | No | Yes | No | No | No | No | Yes |
| Performance controls: Current season | No | No | No | Yes | No | No | No | Yes |
| Performance controls: TV income | No | No | No | No | Yes | No | No | Yes |
| Performance controls: Win probability (ELO based) | No | No | No | No | No | Yes | No | Yes |
| Performance controls: Transfer market value difference | No | No | No | No | No | No | Yes | Yes |
| Performance controls: Win probability (odds based) | No | No | No | No | No | No | No | Yes |
Notes: Linear probability model estimates; (d) for discrete change of dummy variable from 0 to 1. The dependent variable is a dummy for wrong calls among penalties and goals that should have been awarded. Debatable decisions are excluded. Control variables include a dummy for the home team, previous wrong decisions (separated by unfavorable and favorable ones for the affected and unaffected team), type of the situation (goal or penalty), the last 10 min of the game, closeness of the game, and stadiums with running tracks. Furthermore, they include referee experience and average performance in the season, decisiveness of the call, and the number of spectators. Performance indicators for the last season are the difference in position between teams at the end of the last season. Performance in the current season is measured by the difference in points as well as position in the table before the game. Performance indicators using the difference in ranks according to TV income are based on the actual distribution of TV income that is split between all teams in the first and second Bundesliga and are calculated using the weighted performance in the last four seasons. Performance controls using ELO numbers are based on the win probability calculated using ELO numbers collected from clubelo.com and controls for transfer market value are based on the difference in transfer market value in starting formation based on values collected from tranfermarkt.de. Transfer market values are only available between 2005 and 2013, thus explaining the smaller sample. Standard errors in parentheses are clustered at the game level.
p < 0.01,
p < 0.05,
p < 0.1.
Type II Errors: Different Times
| (1) | (2) | |
|---|---|---|
| Ahead in ATT (d) | −0.0288*** | −0.0153** |
(0.0081) | (0.0067) | |
N | 4707 | 7525 |
| ATT-position difference | −0.0015*** | −0.0005* |
(0.0003) | (0.0002) | |
N | 4707 | 7525 |
| Ahead in members (d) | 0.0069 | −0.0194*** |
(0.0082) | (0.0066) | |
N | 4707 | 7525 |
| Member-position difference | −0.0005 | −0.0008** |
(0.0004) | (0.0004) | |
| N | 4707 | 7525 |
Notes: Linear probability model estimates; (d) for discrete change of dummy variable from 0 to 1. The dependent variable is a dummy variable that takes value 1 for wrong calls among penalties and goals that should have been awarded. Debatable decisions are excluded. In each column, the sample of games is restricted to games which took place in the indicated time interval. The regressions include controls for the home team, inverse of odds, referee experience and average performance in the season, type of the situation (goal or penalty), the last 10 min of the game, closeness of the game, decisiveness of the call, the number of spectators, and stadiums with running tracks. Furthermore, season, match day, referee, and team-fixed effects are included. Standard errors in parentheses are clustered at the game level.
p < 0.01,
p < 0.05, and
p < 0.1.
Type II Errors: Tactic Control Variables
| (1) | (2) | (3) | (4) | (5) | (6) | |
|---|---|---|---|---|---|---|
| Ahead in ATT (d) | −0.0205*** | −0.0201*** | −0.0203*** | −0.0243*** | −0.0205*** | −0.0235*** |
| (0.0051) | (0.0051) | (0.0051) | (0.0066) | (0.0052) | (0.0066) | |
| N | 12,232 | 12,232 | 12,232 | 7,485 | 12,232 | 7,485 |
| ATT-position difference | −0.0008*** | −0.0008*** | −0.0008*** | −0.0013*** | −0.0008*** | −0.0013*** |
| (0.0002) | (0.0002) | (0.0002) | (0.0003) | (0.0002) | (0.0003) | |
| N | 12,232 | 12,232 | 12,232 | 7,485 | 12,232 | 7,485 |
| Ahead in members (d) | −0.0092* | −0.0087* | −0.0087* | −0.0031 | −0.0093* | −0.0022 |
| (0.0050) | (0.0050) | (0.0050) | (0.0065) | (0.0050) | (0.0065) | |
| N | 12,232 | 12,232 | 12,232 | 7,485 | 12,232 | 7,485 |
| Member-position difference | −0.0006** | −0.0005** | −0.0005** | −0.0007* | −0.0006** | −0.0007* |
| (0.0003) | (0.0003) | (0.0003) | (0.0003) | (0.0003) | (0.0003) | |
| N | 12,232 | 12,232 | 12,232 | 7,485 | 12,232 | 7,485 |
| Control variables | Yes | Yes | Yes | Yes | Yes | Yes |
| Season FE | Yes | Yes | Yes | Yes | Yes | Yes |
| Match day FE | Yes | Yes | Yes | Yes | Yes | Yes |
| Referee FE | Yes | Yes | Yes | Yes | Yes | Yes |
| Team FE | Yes | Yes | Yes | Yes | Yes | Yes |
| Tactic controls: start formation | Yes | No | No | No | Yes | Yes |
| Tactic controls: offensive score | No | Yes | No | No | Yes | Yes |
| Tactic controls: number of attacking players | No | No | Yes | No | Yes | Yes |
| Tactic controls: game statistics | No | No | No | Yes | No | Yes |
Notes: Linear probability model estimates; (d) for discrete change of dummy variable from 0 to 1. The dependent variable is a dummy for wrong calls among denied penalties and goals. Debatable decisions are excluded. Control variables include a dummy for the home team, win probability based on betting odds, previous wrong decisions (separated by unfavorable and favorable ones for the affected and unaffected team), type of the situation (goal or penalty), the last 10 min of the game, closeness of the game, and stadiums with running tracks. Furthermore, they include referee experience and average performance in the season, decisiveness of the call, and the number of spectators. Tactic indicators for the formation are 14 dummy variables classifying the tactical starting formation for the affected and opposition team. Offensive score measures the difference in the overall offensive positioning in the start formation between the affected and opposing team. Tactic controls using the number of attacking players measure the difference in the number of attacking player in the start formation between the affected and opposition team. Game statistics include the number of shots on target, fouls, and balls contacts by both the affected and unaffected team, as well as the ball possession by the affected team. These variables are only available between 2000 and 2007, thus explaining the smaller sample. Standard errors in parentheses are clustered at the game level.
p < 0.01,
p < 0.05,
p < 0.1.
Type II Errors: Different Specification of Control Variables
| (1) | (2) | (3) | (4) | (5) | |
|---|---|---|---|---|---|
| Ahead in ATT (d) | −0.0207*** | −0.0204*** | −0.0205*** | −0.0204*** | −0.0208*** |
(0.0051) | (0.0051) | (0.0051) | (0.0051) | (0.0052) | |
N | 12,232 | 12,232 | 12,232 | 12,232 | 12,232 |
| ATT-position | −0.0008*** | −0.0008*** | −0.0008*** | −0.0008*** | −0.0008*** |
(0.0002) | (0.0002) | (0.0002) | (0.0002) | (0.0002) | |
N | 12,232 | 12,232 | 12,232 | 12,232 | 12,232 |
| Ahead in members (d) | −0.0090* | −0.0087* | −0.0087* | −0.0085* | −0.0088* |
(0.0050) | (0.0050) | (0.0050) | (0.0050) | (0.0050) | |
N | 12,232 | 12,232 | 12,232 | 12,232 | 12,232 |
| Member-position difference | −0.0006** | −0.0005** | −0.0006** | −0.0006** | −0.0006** |
(0.0003) | (0.0003) | (0.0003) | (0.0003) | (0.0003) | |
N | 12,232 | 12,232 | 12,232 | 12,232 | 12,232 |
| Other control variables | Yes | Yes | Yes | Yes | Yes |
| Referee FE | Yes | Yes | Yes | Yes | Yes |
| Season FE | Yes | Yes | Yes | Yes | Yes |
| Match day FE | Yes | Yes | No | No | No |
| Tenure | Yes | No | No | No | Yes |
| Play time (minute) | No | Yes | No | No | Yes |
| Half-season dummies | No | No | Yes | Yes | Yes |
| Last five games | No | No | No | Yes | Yes |
Notes: Linear probability model estimates; (d) for discrete change of dummy variable from 0 to 1. The dependent variable is a dummy for wrong calls among penalties and goals that should have been awarded. Debatable decisions are excluded. Control variables include a dummy for the home team, previous wrong decisions (separated by unfavorable and favorable ones for the affected and unaffected team), type of the situation (goal or penalty), the last 10 min of the game (except when other play time indicators are included), closeness of the game, and stadiums with running tracks. Furthermore, they include referee experience (except when tenure details are included) and average performance in the season, decisiveness of the call, and the number of spectators. Tenure refers to years as a Bundesliga referee. Play time is measured in minutes. Standard errors in parentheses are clustered at the game level.
p < 0.01,
p < 0.05,
p < 0.1.
Type II Errors: Alternative Methods
| (1) | (2) | (3) | (4) | |
|---|---|---|---|---|
| OLS | Logit | Pen. logit | Poisson | |
| Ahead in ATT (d) | −0.0204*** | −0.0217*** | −0.0219*** | −0.0222*** |
(0.0051) | (0.0050) | (0.0053) | (0.0052) | |
N | 12,232 | 12,157 | 12,232 | 12,232 |
| ATT-position difference (d) | −0.0008*** | −0.0009*** | −0.0009*** | −0.0010*** |
(0.0002) | (0.0002) | (0.0002) | (0.0002) | |
N | 12,232 | 12,157 | 12,232 | 12,232 |
| Ahead in members (d) | −0.0087* | −0.0091* | −0.0092* | −0.0099* |
(0.0050) | (0.0050) | (0.0052) | (0.0052) | |
N | 12,232 | 12,157 | 12,232 | 12,232 |
| Member-position difference (d) | −0.0005** | −0.0006** | −0.0006** | −0.0006** |
(0.0003) | (0.0003) | (0.0003) | (0.0003) | |
| N | 12,232 | 12,157 | 12,232 | 12,232 |
Notes: Estimates as indicated by column; average marginal effects; (d) for discrete change of dummy variable from 0 to 1. The dependent variable is a dummy variable that takes value 1 for wrong calls among penalties and goals that should be awarded. Debatable decisions are excluded. The regressions include controls for the home team, win probability (odds based), referee experience and average performance in the season excluding the current game, the last 10 min of the game, closeness of the game, decisiveness of the call, the number of spectators, accuracy of previous decisions, and stadiums with running tracks. Furthermore, season, match day, referee, and team-fixed effects are included. Standard errors in parentheses are clustered at the game level except for the Firthlogit regression, which does not allow for clustering. Note that the logit regression struggles at estimating some referee-fixed effects and hence excluded two referees from the sample, explaining the slightly smaller observation number.
p < 0.01,
p < 0.05,
p < 0.1.
Complementary Log–Log Models on Exit from the Referee Pool (without Performance)
| (1) | (2) | (3) | (4) | ||
|---|---|---|---|---|---|
| DFB cup referee | −0.1928 | −0.1439 | −0.1607 | −0.1137 | |
| (0.1360) | (0.1375) | (0.1193) | (0.1019) | ||
| International referee | −0.2493 | −0.2110 | −0.2015 | −0.1503 | |
| (0.2592) | (0.2537) | (0.2990) | (0.1825) | ||
| Age | 0.0079 | 0.0093 | 0.0141 | 0.0209 | |
| (0.0085) | (0.0097) | (0.0120) | (0.0143) | ||
| PG: Type II errors | 0.0923 | } p = 0.0198 | |||
| (0.0843) | |||||
| PG: Type I errors | −0.3279 | ||||
| (0.2219) | |||||
| PG: Type II errors (ATT ahead) | 0.2057* | } p = 0.0315 | |||
| (0.1091) | |||||
| PG: Type II errors (ATT behind) | −0.2678 | ||||
| (0.2548) | |||||
| PG: Type I errors (ATT ahead) | 0.0350 | } p = 0.0117 | |||
| (0.1917) | |||||
| PG: Type I errors (ATT behind) | −0.9439** | ||||
| (0.4629) | |||||
| PG: Type II errors (members ahead) | 0.2026** | } p = 0.7158 | |||
| (0.0984) | |||||
| PG: Type II errors (members behind) | 0.1299 | ||||
| (0.2351) | |||||
| PG: Type I errors (members ahead) | 0.0544 | } p = 0.0041 | |||
| (0.2237) | |||||
| PG: Type I errors (members behind) | −3.9233*** | ||||
| (1.4090) | |||||
| Tenure FE | Yes | Yes | Yes | Yes | |
| N | 207 | 207 | 207 | 207 |
Notes: Complementary log–log estimates; average marginal effects; (d) for discrete change of dummy variable from 0 to 1. The dependent variable is a dummy that takes value 1 if a referee left the pool of active referees in a given season. Referees at the age limit are excluded. We furthermore exclude one referee as he was suspended due to connections to a betting scandal. The control variables measure average performance in the season—in standard deviations and with mean 0, whether a referee was also refereeing in the DFB Cup (German National Cup) or internationally (Champions League or Euro League), and the average age in the season. Tenure-fixed effects take the role of mixed proportional hazards. The last column presents the p-value for test of equality for the indicated coefficients. Standard errors in parentheses are clustered at the referee level.
p < 0.01,
p < 0.05,
p < 0.1.
Negative Binomial Models on Pause between Games (without Performance)
| (1) | (2) | (3) | (4) | ||
|---|---|---|---|---|---|
| DFB cup referee (d) | 0.0408 | 0.0546 | 0.0538 | 0.0541 | |
| (0.1679) | (0.1675) | (0.1687) | (0.1696) | ||
| International referee (d) | 0.1773 | 0.1813 | 0.1805 | 0.1787 | |
| (0.1171) | (0.1177) | (0.1180) | (0.1173) | ||
| Age | 0.0038 | 0.0025 | 0.0022 | 0.0030 | |
| (0.0267) | (0.0266) | (0.0270) | (0.0267) | ||
| Tenure (BL) | −0.0913*** | −0.0912*** | −0.0912*** | −0.0923*** | |
| (0.0299) | (0.0295) | (0.0299) | (0.0295) | ||
| Expected pause | 0.6333*** | 0.6125*** | 0.6138*** | 0.6156*** | |
| (0.1478) | (0.1476) | (0.1466) | (0.1465) | ||
| Type II errors | 0.0943** | } p = 0.4838 | |||
| (0.0383) | |||||
| Type I errors | 0.1191*** | ||||
| (0.0325) | |||||
| Type II errors (ATT ahead) | 0.0537 | } p = 0.2764 | |||
| (0.0495) | |||||
| Type II errors (ATT behind) | 0.1322** | ||||
| (0.0552) | |||||
| Type I errors (ATT ahead) | 0.1443*** | } p = 0.3065 | |||
| (0.0436) | |||||
| Type I errors (ATT behind) | 0.0936*** | ||||
| (0.0360) | |||||
| Type II errors (members ahead) | 0.0505 | } p = 0.2582 | |||
| (0.0531) | |||||
| Type II errors (members behind) | 0.1327** | ||||
| (0.0530) | |||||
| Type I errors (members ahead) | 0.1539*** | } p = 0.1468 | |||
| (0.0395) | |||||
| Type II errors (members behind) | 0.0805** | ||||
| (0.0411) | |||||
| Referee FE | Yes | Yes | Yes | Yes | |
| N | 3705 | 3705 | 3705 | 3705 |
Notes: Negative binomial estimates; average marginal effects; (d) for discrete change of dummy variable from 0 to 1. The discrete dependent variable measures the number of game days between the present game and the next one in which the referee is used (0 when referee is immediately used in the next game). The control variables measure performance in the game—in standard deviations and with mean 0, whether a referee was also refereeing in the DFB Cup or internationally (Champions League or Euro League) in this season, the age at the time of the game as well as tenure in the Bundesliga. We furthermore calculate the “expected pause” based on the number of referees in the referee pool in a given season and the number of available games and match days. Standard errors in parentheses are clustered at the referee level.
p < 0.01,
p < 0.05,
p < 0.1.
Type II Errors: Referees Close to Retirement
| Ahead in ATT | Difference in ATT position | Ahead in members | Difference in member position | |||||
|---|---|---|---|---|---|---|---|---|
| (1) | (2) | (3) | (4) | (5) | (6) | (7) | (8) | |
| Status | −0.0201*** | −0.0189*** | −0.0008*** | −0.0008*** | −0.0078 | −0.0073 | −0.0005* | −0.0005* |
| (0.0052) | (0.0053) | (0.0002) | (0.0002) | (0.0051) | (0.0052) | (0.0003) | (0.0003) | |
| Status × 1 year to age limit (d) | −0.0051 | −0.0010* | −0.0198 | −0.0010 | ||||
| (0.0187) | (0.0006) | (0.0188) | (0.0006) | |||||
| 1 year to age limit (d) | 0.0064 | 0.0052 | 0.0154 | 0.0061 | ||||
| (0.0180) | (0.0130) | (0.0178) | (0.0131) | |||||
| Status × 3 years to age limit (d) | −0.0109 | −0.0003 | −0.0117 | −0.0006 | ||||
| (0.0117) | (0.0004) | (0.0118) | (0.0005) | |||||
| 3 years to age limit (d) | 0.0248** | 0.0195** | 0.0261** | 0.0205** | ||||
| (0.0126) | (0.0097) | (0.0127) | (0.0098) | |||||
| N | 12,232 | 12,232 | 12,232 | 12,232 | 12,232 | 12,232 | 12,232 | 12,232 |
Notes: Linear probability model estimates; the dependent variable is a dummy for wrong calls among penalties and goals that should have been awarded. Debatable decisions are excluded. The regressions include controls for the home team, inverse of odds, referee experience and average performance in the season, previous wrong decisions (both favorable and unfavorable for the affected and unaffected team), type of the situation (goal or penalty), the last 10 min of the game, closeness of the game, decisiveness of the call, and the number of spectators. Furthermore, season, match day, referee, and team-fixed effects are included. Standard errors in parentheses are clustered at the game level.
p < 0.01,
p < 0.05,
p < 0.1.
Type II Errors: Games with Less Social Pressure (Almost Empty Stadiums)
| (1) | (2) | |
|---|---|---|
| Attendance to capacity | Attendance to capacity | |
| (First decile) | (First quantile) | |
| Ahead in ATT (d) | −0.0441** | −0.0285** |
(0.0219) | (0.0132) | |
N | 1193 | 3035 |
| ATT-position difference | −0.0018** | −0.0012** |
(0.0009) | (0.0005) | |
N | 1193 | 3035 |
| Ahead in members (d) | −0.0112 | −0.0002 |
(0.0183) | (0.0121) | |
N | 1193 | 3035 |
| Member-position difference | −0.0025** | −0.0008 |
(0.0010) | (0.0006) | |
| N | 1193 | 3035 |
Notes: Linear probability model estimates; (d) for discrete change of dummy variable from 0 to 1. The dependent variable is a dummy variable that takes value 1 for wrong calls among penalties and goals that should have been awarded. Debatable decisions are excluded. In the first column, the sample is restricted to include only decisions in games with attendance to capacity ratio in the first decile of all games. The second column contains only decisions in games with attendance to capacity ratio in the first quartile of all games. The regressions include controls for the home team, inverse of odds, referee experience and average performance in the season, the last 10 min of the game, closeness of the game, decisiveness of the call, and the number of spectators. Furthermore, season, match day, referee, and team-fixed effects are included. Standard errors in parentheses are clustered at the game level.
p < 0.01,
p < 0.05,
p < 0.1.
Type II Errors: Referee’s Distance from High-Status Team
| (1) | (2) | (3) | |
|---|---|---|---|
| Ahead in ATT (d) | −0.0223*** | −0.0178** | p = 0.6606 |
(0.0071) | (0.0077) | ||
N | 6125 | 6107 | |
| ATT-position difference | −0.0011*** | −0.0005* | p = 0.1090 |
(0.0003) | (0.0003) | ||
N | 6125 | 6107 | |
| Ahead in members (d) | −0.0136* | −0.0026 | p = 0.2765 |
(0.0074) | (0.0070) | ||
N | 6247 | 5985 | |
| Member-position difference | −0.0008** | −0.0002 | p = 0.2202 |
(0.0004) | (0.0004) | ||
| N | 6247 | 5985 |
Notes: Linear probability model estimates; (d) for discrete change of dummy variable from 0 to 1. The dependent variable is a dummy for wrong calls among penalties and goals that should have been awarded. Debatable decisions are excluded. In each column, the sample of games is restricted to games in which the shortest distance of the referee’s birthplace to the top team’s home town is in the indicated interval. The regressions include controls for the home team, inverse of odds, referee experience and average performance in the season, type of the situation (goal or penalty), the last 10 min of the game, closeness of the game, decisiveness of the call, the number of spectators, and stadiums with running tracks. Furthermore, season, match day, referee, and team-fixed effects are included. The last column presents the p-value for a test of equality for the coefficients in the regressions (1) and (2). Standard errors in parentheses are clustered at the game level.
p < 0.01,
p < 0.05,
p < 0.1.
Type II Errors: Controls for Player Status
| (1) | (2) | (3) | (4) | (5) | |
|---|---|---|---|---|---|
| Ahead in ATT (d) | −0.0153** | −0.0147** | −0.0220*** | −0.0147** | −0.0187*** |
(0.0066) | (0.0067) | (0.0053) | (0.0066) | (0.0068) | |
N | 7522 | 7522 | 11,528 | 7522 | 7139 |
| ATT-position difference | −0.0005* | −0.0004* | −0.0009*** | −0.0004* | −0.0005** |
(0.0002) | (0.0002) | (0.0002) | (0.0002) | (0.0002) | |
N | 7,522 | 7,522 | 11,528 | 7,522 | 7,139 |
| Ahead in members (d) | −0.0204*** | −0.0202*** | −0.0089* | −0.0202*** | −0.0203*** |
(0.0065) | (0.0065) | (0.0052) | (0.0065) | (0.0067) | |
N | 7,522 | 7,522 | 11,528 | 7,522 | 7,139 |
| Member-position difference | −0.0009** | −0.0008** | −0.0006** | −0.0008** | −0.0010*** |
(0.0003) | (0.0003) | (0.0003) | (0.0003) | (0.0004) | |
N | 7,522 | 7,522 | 11,528 | 7,522 | 7,139 |
| Control variables | Yes | Yes | Yes | Yes | Yes |
| Season FE | Yes | Yes | Yes | Yes | Yes |
| Match day FE | Yes | Yes | Yes | Yes | Yes |
| Referee FE | Yes | Yes | Yes | Yes | Yes |
| Team FE | Yes | Yes | Yes | Yes | Yes |
| Player status: transfer market value | Yes | No | No | No | Yes |
| Player status: age | No | Yes | No | No | Yes |
| Player status: world cup participant | No | No | Yes | No | Yes |
| Player status: nationality same as Ref. | No | No | No | Yes | Yes |
Note: Linear probability model estimates; (d) for discrete change of dummy variable from 0 to 1. The dependent variable is a dummy for wrong calls among penalties and goals that should have been awarded. Debatable decisions are excluded. Control variables include a dummy for the home team, win probability based on betting odds, previous wrong decisions (separated by unfavorable and favorable ones for the affected and unaffected team), type of the situation (goal or penalty), the last 10 min of the game, closeness of the game, and stadiums with running tracks. Furthermore, they include referee experience and average performance in the season, decisiveness of the call, and the number of spectators. Player status control using player transfer market value is based on transfer market value collected from tranfermarkt.de. Age is the age of the player at the beginning of the season. World cup participation indicates whether the player has been nominated to a national team that participated in the FIFA world cup. Finally, nationality controls for players who are of the same nationality as the referee. Transfer market value, age, and nationality data is only available between 2005 and 2013, thus explaining the smaller sample. Standard errors in parentheses are clustered at the game level.
p < 0.01,
p < 0.05,
p < 0.1.
Extra Time in Other Games
| (1) | (2) | (3) | (4) | |
|---|---|---|---|---|
| Home | 0.0511 | 0.0823 | 0.0916 | 0.1162 |
| (0.0832) | (0.0842) | (0.0827) | (0.0848) | |
| Ahead in ATT team in front (d) | −0.0279 | |||
| (0.0730) | ||||
| ATT-position difference (team in front) | 0.0021 | |||
| (0.0022) | ||||
| Ahead in members team in front (d) | 0.1013 | |||
| (0.0724) | ||||
| Member-position difference (team in front) | 0.0066** | |||
| (0.0030) | ||||
| Win probability (odds based) | −1.7402*** | −1.9021*** | −1.9576*** | −2.1024*** |
| (0.2836) | (0.2854) | (0.2864) | (0.2922) | |
| Substitutions (halftime 2) | 0.1531*** | 0.1519*** | 0.1527*** | 0.1501*** |
| (0.0359) | (0.0359) | (0.0359) | (0.0360) | |
| Red cards (halftime 2) | 0.1522* | 0.1532* | 0.1524* | 0.1550* |
| (0.0890) | (0.0893) | (0.0893) | (0.0892) | |
| Yellow cards (halftime 2) | 0.1138*** | 0.1153*** | 0.1149*** | 0.1153*** |
| (0.0227) | (0.0227) | (0.0227) | (0.0227) | |
| Penalties (halftime 2) | 0.0150 | 0.0162 | 0.0165 | 0.0132 |
| (0.0538) | (0.0537) | (0.0537) | (0.0533) | |
| Goals (halftime 2) | −0.0717*** | −0.0709*** | −0.0701*** | −0.0679*** |
| (0.0231) | (0.0231) | (0.0231) | (0.0231) | |
| Attendance of visitors | −0.0023 | −0.0024 | −0.0025 | −0.0025 |
| (0.0019) | (0.0019) | (0.0019) | (0.0019) | |
| Season FE | Yes | Yes | Yes | Yes |
| Referee FE | Yes | Yes | Yes | Yes |
| N | 1,514 | 1,514 | 1,514 | 1,514 |
| R2 | 0.1713 | 0.1717 | 0.1723 | 0.1739 |
Notes: OLS estimates; (d) for discrete change of dummy variable from 0 to 1. The dependent variable is the extra time in the second half in minutes. The sample is restricted to include only games where the goal difference before the beginning of the extra time is not 1. Robust standard errors in parentheses.
p < 0.01,
p < 0.05,
p < 0.1.
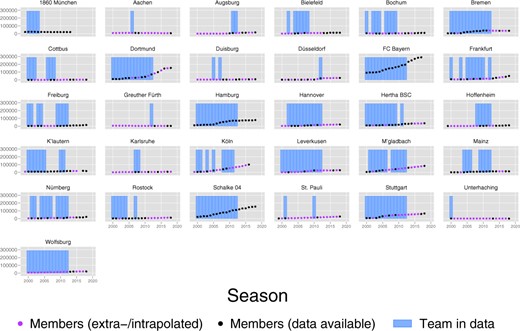
Extra-/Interpolation of Members Data Notes: The panels show number of club members of a club in a given season. It indicates if the number was collected of inter-/extrapolated using a log model. The figure also shows the seasons in which a club played in the Bundesliga in the seasons included in our data set (2000–12).
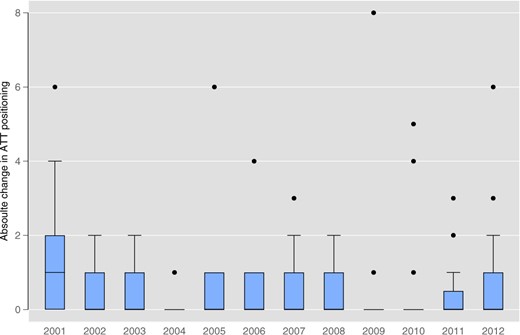
Box Plot of Absolute Change in Position in the ATT Ranking. Notes: The figure shows box plots for the absolute number of positions changed in the ATT for all clubs by season.
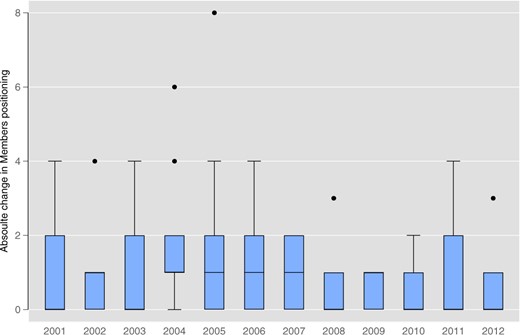
Box Plot of Absolute Change in Position in the Members Ranking. Notes: The figure shows box plots for the absolute number of positions changed in the members ranking for all clubs by season.
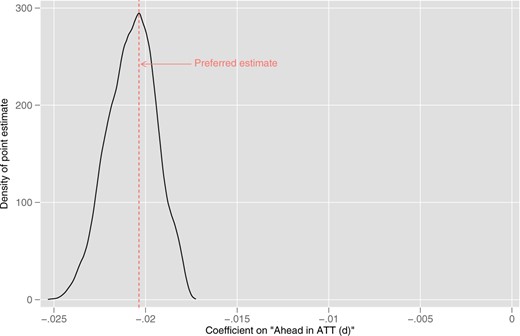
Robustness of Estimates for “Ahead in ATT” to Specification of Control Variables. Notes: The figure shows the distribution of point estimates for the variable “Ahead in ATT” in 106,017 randomly selected models. Each estimate stems from an OLS model with team-fixed effects. Furthermore, we randomly draw control variables from the following set of variables: Either “win probability (odds based),” an indicator for the favorite in the game according to the odds-based win probability, or the win probability (ELO based), either minute in the game or an indicator for the last 10 min of the game, the probability with which a call was decisive, either the referee’s age or an indicator for referees at the age limit (47), either referees’ experience (in terms of games refereed), their tenure in the Bundesliga, or their tenure in professional football, referees’ average performance in the season excluding the current game, either an indicator for whether referees have previously made a mistake immediately before the present situation in the same game or indicators for previous wrong calls favoring the affected team or its opponent as well as not favoring the affected team or its opponent, the distance between the home and the visiting team, an indicator for close games, either the number of spectators or a normalized version of the number of spectators, the stadium’s capacity, an indicator for stadiums with a running track, indicators for the ranking of the affected and opposing team in the last season, the point difference in the current season between affected and opposing team, indicators for whether the affected team has qualified for the international cups in the last season and the current season, as well as referee, season, and game day-fixed effects. Since any possible combination of these control variables would require us to estimate about 10,601,700 models, we randomly select a 1% sample, which we estimate. The density of the point estimate for the coefficient on “Ahead in ATT” in this random sample is shown in the figure. The dashed red line corresponds to our preferred estimation (see Table 3).
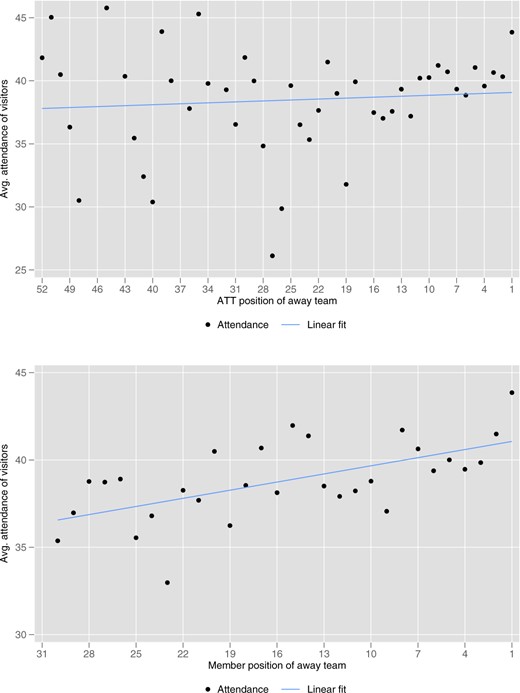
Away Attendance and Status. Notes: The figure shows the average attendance in away games over the entire sample period separate for each level of status. We focus on away games of each team to abstract from the capacity of the stadium of each team, since high-status clubs might have been around in the Bundesliga for longer and hence have larger stadiums.
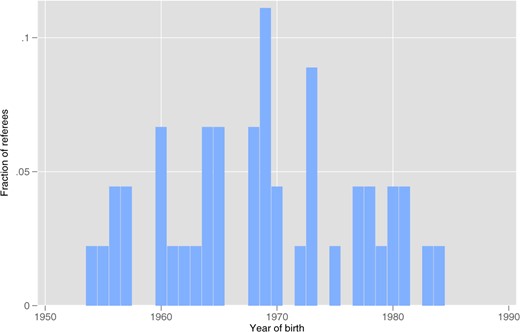
Distribution of Referees’ Year or Birth. Notes: The figure shows the fraction of referees in the Bundesliga that refereed at least one game between 2000 and 2012 born in a given year.
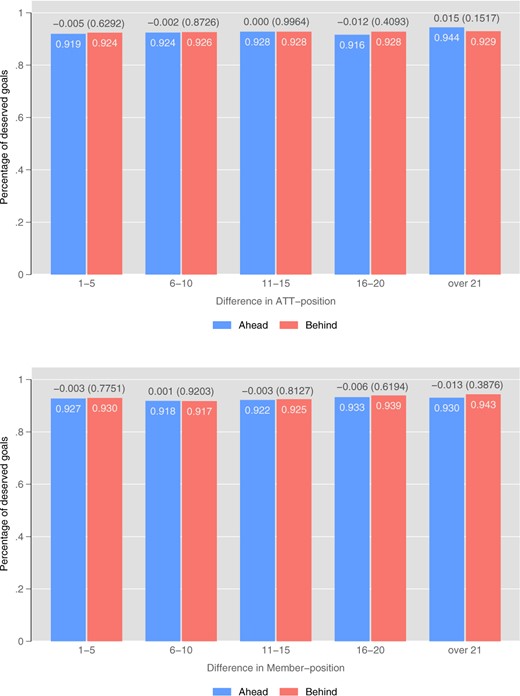
Share of Deserved Goals by Status. Notes: The figure shows the share of deserved goals by status and for different levels of status difference between the teams. Debatable decisions are excluded. Numbers above the bars are differences in frequencies. Numbers in parentheses are p-values for a proportions test with the null hypothesis of equal means.
Appendix B: Expected Pause
Calculation pause between two nominations of a referee
To calculate the pause that a referee has between two subsequent nominations, we simply count the number of regular match days that a referee was not used following the present nomination. That is if the referee was used on two subsequent match days in a row, our dependent variable measuring the pause between two nominations takes the value 0.
Calculation of the expected pause
A season consists of 34 match days with 9 games each, thus there are in total 306 games to be refereed, which yields games per referee as expressed in the denominator. The numerator shows the expected number of game days a referee is not used in a given season, so that is the average pause per referee assuming uniform assignment over referees. With for example, 18 referees, one would expect every referee to be nominated 17 times, so that every referee should have a pause of one game day if pauses were uniformly distributed. Indeed, this is what the formula captures.
Appendix C: Model on Anticipation Effect
Set-up
We suggest a simple model that may contribute to the understanding of why we observe pronounced favoritism for type II errors but not so for type I errors. The model is based on the idea that players may anticipate that referees are (unconsciously) biased toward high-status clubs.
Clubs in our model have either high or low status; . In each situation, a player has two options: He can try to stay on his feet or go for a penalty. A penalty may be either deserved or undeserved, . If a player goes for the penalty and actually gets it, his expected utility is 1, while it is 0 if the penalty is denied. If he keeps playing the expected utility is B < 1. We denote the probability that a player of club j gets a penalty as . A player will go for a penalty if . Furthermore, we denote the frequency of the two error types as and , respectively.
The referee cannot observe exactly if a penalty is deserved or not but only gets a noisy signal S on the strength of the case. The higher S, the more does the case look like a deserved penalty. In case a player goes for a penalty, the referee grants it if and only if , where expresses the referee bias toward high-status clubs.
Deserved penalties
For deserved penalties, we simply assume that , that is, even players from low-status clubs will always go for deserved penalties. This seems fairly realistic as one hardly observes players who keep playing in case they deserve penalties.27 Denote the distribution function of the signal S for deserved penalties as and assume that is the same for high- and low-status clubs. The frequency of type II errors is and hence, due to , strictly higher for low-status clubs as observed in our data. Note that is independent of how often a club ends up in situations that actually deserve a penalty compared with situations that do not. This follows from the definition of type II errors.
Without referee bias and if all players indeed go for a deserved penalty, type II errors can only differ if the distribution of the signal the referee gets differs systematically among low- and high-status clubs. This, however, seems far-fetched: One cannot fully exclude that signals depend on the style of play, but one should then find differences in type II errors rather for favorites and underdogs instead of for high and low status (recall that odds and our other proxies for strength are insignificant for type II errors).
Undeserved penalties
For undeserved penalties, assume that the signal the referee gets is . A referee grants an undeserved penalty if . We introduce A to account for the fact that the distribution of the signal differs among different situations. The player knows the realization of A and will hence go for a penalty if A = a is sufficiently high and the threshold required for a penalty is sufficiently low. To simplify the analysis, we assume that Z and A are independent and both uniformly distributed between 0 and 1, that is, . This is sufficient to illustrate that anticipation of the referee bias reduces (and may even eliminate) the difference in the frequency of type I errors between high- and low-status clubs.
In order to illustrate the effect of anticipation on undeserved penalties (i.e., on type I errors), we proceed as follows: For low-status clubs, we assume that players are aware of and behave accordingly. Players of high-status clubs either assume (no anticipation) or (anticipation). We denote the belief of high-status players by .28
After observing A = a, a player jumps if . Due to our assumptions on the distributions for A and Z, this can be written as . As is strictly increasing in σ, we have . This implies that players from high-status clubs will jump more often than players from low-status clubs if and only if they anticipate the reference bias. Furthermore, implies that .
Conflict of interest statement. The authors declare that they have no relevant or material financial interests that relate to the research described in this paper. This paper makes use of proprietary data. The authors agreed with the company providing this data that they could have a further look at the paper before it is submitted to be published.
Data availability statement.This paper makes use of proprietary data obtained from Sported Solutions as well as additionally collected data. In the replication files, we provide detailed information on how to obtain the data as well as additional data and code needed to replicate the analysis.
