


Abstract
Conditional survival accounts for the time already survived after surgery and provides additional survival information. The aim was to assess conditional survival in stages I–III early onset colorectal cancer patients and to create nomograms predicting the conditional overall survival and cancer-specific survival after surgery.
A total of 7058 patients who underwent surgical resection of early onset colorectal cancer were identified from surveillance, epidemiology and end results database. The formula used for conditional survival calculation was conditional survival(x|y) = S(x + y)/S(x), where S(x) represents the survival at x years. Conditional survival nomograms were then developed to predict the 5-year conditional overall survival and cancer-specific survival.
The 5-year overall survival and cancer-specific survival after surgery increases gradually with additional survival time. Race, tumour site, grade, histology, T stage, N stage, lymph node ratio, preoperative carcinoma embryonic antigen level and perineural invasion status were independent predictors of cancer-specific survival, while age and sex were another two independent risk factors for overall survival. The nomograms based on these factors were successfully developed to predict 5-year overall survival and cancer-specific survival given 1–4 years already survived.
The probability of achieving postoperative 5-year overall survival and cancer-specific survival for early onset colorectal cancer increases gradually with additional time survived. The developed nomograms are fairly valuable and informative in facilitating clinical treatment and follow-up schemes.
Introduction
Colorectal cancer (CRC) is worldwide one of the most common malignant tumours with increasing incidence across the nation (1). It is noteworthy that the incidence of early onset CRC (aged < 50 years) patients increased by ~2% annually since the mid-1990s, while the incidence of elderly patients is decreasing gradually (2). In spite of better treatment adherence and higher administered treatment intensity, young age is associated with significantly higher relapse rate compared with elderly patients (3). Consequently, more reliable prognostic factors or predictive model should be identified to perform accurate survival prediction in order to facilitate clinical decision-making.
Currently, the American Joint Committee on Cancer (AJCC) tumor-node-metastasis (TNM) staging system is the most widely accepted risk stratification factors in CRC. However, it is common to notice that the prognosis of patients with same TNM stage varied strikingly (4,5). Therefore, more prognostic factors including lymph node ratio (LNR) (6,7), primary tumour location, differentiation, carcinoma embryonic antigen (CEA) level (8), perineural invasion (PI) status (9), etc. have been identified to improve the survival prediction. In order to combine all the prognostic features, nomogram, a statistical predictive model incorporating all independent factors of prognosis was developed to facilitate survival prediction (10–12).
However, apart from the aforementioned prognostic clinicopathological factors, the survived time after surgery is another overlooked key factor influencing prognosis and the risk of death changes with time after surgery. Conditional survival (CS) represents the probability of surviving a certain number of years after diagnosis or treatment based on the time the patient has already survived (13,14). Therefore, in contrast to conventional survival analysis, CS might be more informative and meaningful in providing a more individualized prognosis estimation as time progresses (15–20).
To date, no previous studies have attempted to developed nomograms to predict the conditional survival for early onset patients. In this present study, we aimed to define CS for stages I–III early onset patients, and to construct nomograms for predicting the conditional probability of overall survival (OS) and cancer-specific survival (CSS) after surgery.
Materials and methods
Patient selection in the SEER database
Patient data were obtained from the surveillance, epidemiology and end results (SEER) database (http://seer.cancer.gov/seerstat), which was sponsored by the National Cancer Institute. It currently collects and publishes cancer incidence and survival data covering eighteen population-based cancer registries that represent ~28% of the population in the United States. Using the SEER database, we identified 7058 stages I–III early onset CRC between 2010 and 2019. Patients who met the following criteria were included: (a) pathologically diagnosed colorectal adenocarcinoma, mucinous adenocarcinoma and signet-ring cell carcinoma; (b) AJCC TNM stage I–III; (c) patients were 14–50 years old; (d) CRC was the only primary tumour; (e) patients with complete follow-up information. Patients with missing information of any clinicopathological features or survival information were excluded.
Statistical analyses
CS is defined as the probability of surviving an additional number of y years given that a patient has already survived for x years and can be determined from Kaplan–Meier estimator. The calculating formula for CS was as follows: CS(x|y) = S(x + y)/S(x), where S(x) represents the postoperative x year of OS or CSS, which are estimated using the Kaplan–Meier method. For example, the conditional OS (cOS) or conditional CSS (cCSS) for surviving another 2 years of patients who had already survived 3 years, CS (3|2), was calculated by dividing the 5-year Kaplan–Meier survival estimate CS (5) by the 3-year survival estimate CS (3). The calculation and plot of CS was performed using the ‘condsurv’ package.
Multivariate Cox regression analysis was performed to identify the independent prognostic factors for OS and CSS. Based on the result from multivariate Cox regression analysis, CS nomograms were then constructed for predicting the 5-year cOS and cCSS. Survival receiver operator characteristic (ROC) was used to evaluate the prognostic accuracy of the developed conditional nomograms which was summarized by the area under the curve (AUC). All statistical analyses were performed with use of R (version 4.1.2, www.r-project.org).
Results
Patient characteristics
A total of 7058 early onset patients were identified from the SEER database. The clinical and histopathological characteristics of the patients were shown in Table 1. The mean age for these patients was 42.41. Most patients were male (53.2%) and white (74.7%). The majority of patients had the left side colon cancer (72.1%), were Grade II (75.6%). The histology of adenocarcinoma (92.5%) was the most common subtype, followed by the mucinous adenocarcinoma (6.4%), and signet-ring cell carcinoma (1.1%). Patients with T1, T2, T3 and T4 stage tumours accounted for 10.6%, 14.1%, 61.0% and 14.4%, respectively, of all cases, and N0, N1 and N2 stage cases accounted for 48.7%, 32.8% and 18.5%, respectively. A total of 32.2% of patients were positive CEA level and 13.5% of tumours had PI.
Baseline features of early onset patients in SEER database
| Variables | N | % |
|---|---|---|
| Age (Interquartile Range) | 42.41 (39–47) | |
| Sex | ||
| Female | 3301 | 46.8% |
| Male | 3757 | 53.2% |
| Race | ||
| White | 5273 | 74.7% |
| Black | 860 | 12.2% |
| Other | 925 | 13.1% |
| Site | ||
| Right | 1559 | 22.1% |
| Left | 5090 | 72.1% |
| Trans | 409 | 5.8% |
| Grade | ||
| I | 501 | 7.1% |
| II | 5333 | 75.6% |
| III/IV | 1224 | 17.3% |
| Histology | ||
| Adenocarcinoma | 6528 | 92.5% |
| Mucinous | 451 | 6.4% |
| Signet ring | 79 | 1.1% |
| T stage | ||
| T1 | 748 | 10.6% |
| T2 | 993 | 14.1% |
| T3 | 4302 | 61.0% |
| T4 | 1015 | 14.4% |
| N stage | ||
| N0 | 3436 | 48.7% |
| N1 | 2317 | 32.8% |
| N2 | 1305 | 18.5% |
| Lymph node ratio (Interquartile Range) | 0.097 (0–0.119) | |
| CEA | ||
| NO | 4787 | 67.8% |
| Yes | 2271 | 32.2% |
| Perineural invasion | ||
| NO | 6102 | 86.5% |
| Yes | 956 | 13.5% |
| Total | 7058 | 100% |
Conditional overall and cancer specific survival estimates
| Overall survival (OS) (year) | Actuarial survival | OS for patients surviving | ||||
|---|---|---|---|---|---|---|
| 1 | 2 | 3 | 4 | 5 | ||
| 1 | 0.98 | |||||
| 2 | 0.95 | 0.97 | ||||
| 3 | 0.91 | 0.93 | 0.97 | |||
| 4 | 0.88 | 0.9 | 0.93 | 0.96 | ||
| 5 | 0.85 | 0.87 | 0.9 | 0.93 | 0.97 | |
| 6 | 0.83 | 0.84 | 0.87 | 0.9 | 0.94 | 0.97 |
| Cancer-specific survival (CSS) (year) | Actuarial survival | CSS for patients surviving | ||||
| 1 | 2 | 3 | 4 | 5 | ||
| 1 | 0.98 | |||||
| 2 | 0.95 | 0.97 | ||||
| 3 | 0.92 | 0.94 | 0.97 | |||
| 4 | 0.89 | 0.91 | 0.93 | 0.96 | ||
| 5 | 0.86 | 0.88 | 0.91 | 0.94 | 0.98 | |
| 6 | 0.84 | 0.86 | 0.88 | 0.91 | 0.95 | 0.98 |
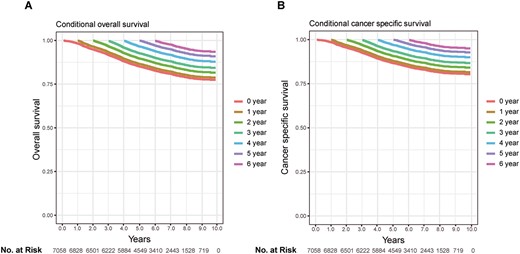
Kaplan–Meier estimates of survival after surgery (0 years) and conditional survival according to years already survived after surgery (1–5 years). (A) Overall survival; (B) cancer-specific survival.
Conditional survival
The 5-year OS and CSS of stages I–III early onset patients identified in this study were 85% and 86%, respectively. It was noticed that the non-cancer caused death accounted for fairly small part. Conditional probabilities of OS and CSS were shown in Table 2 and conditional survival curves in Figure 1, in relation to the number of years already survived postoperatively. The postoperative 5-year OS increased from 85% to 87%, 90%, 93% and 97% given 1–4 years survived already, and 5-year CSS increased from 85% to 88%, 91%, 94% and 98% (Table 2). Patients who had survived more years had a better chance to survive additional time.
Independent prognostic factors for OS and CSS
To identify the prognostic factor for OS and CSS, we performed univariate and multivariate Cox regression analysis. In the univariate analysis, age, sex, race, tumour site, grade, histology, T stage, N stage, LNR, preoperative CEA level and PI status were prognostic for both OS and CSS (Table 3). Further multivariate Cox regression analysis showed that Race, tumour site, grade, histology, T stage, N stage, LNR, preoperative CEA level and PI status were independent predictors of CSS, while age and sex were another two independent risk factors for OS (Table 3).
Univariate and multivariate Cox regression analysis for overall survival (OS) and cancer-specific survival (CSS)
| Variables | OS | CSS | ||||||||||||||
|---|---|---|---|---|---|---|---|---|---|---|---|---|---|---|---|---|
| Univariate | Multivariate | Univariate | Multivariate | |||||||||||||
| HR | 95% CI | P | HR | 95% CI | P | HR | 95% CI | P | HR | 95% CI | P | |||||
| lower | upper | lower | upper | lower | upper | lower | upper | |||||||||
| Age | 0.989 | 0.981 | 0.998 | 0.013 | 1.444 | 1.285 | 1.624 | 0.014 | 0.983 | 0.974 | 0.992 | <0.001 | 1.008 | 0.998 | 1.018 | 0.099 |
| Sex | <0.001 | 0.046 | 0.011 | 0.205 | ||||||||||||
| Female | 1.000 | 1.000 | 1.000 | 1.000 | ||||||||||||
| Male | 1.215 | 1.086 | 1.359 | 1.125 | 1.002 | 1.262 | 1.168 | 1.036 | 1.316 | 1.008 | 0.998 | 1.018 | ||||
| Race | <0.001 | <0.001 | <0.001 | <0.001 | ||||||||||||
| White | 1.000 | 1.000 | 1.000 | 1.000 | ||||||||||||
| Black | 1.666 | 1.439 | 1.928 | 1.618 | 1.389 | 1.885 | 1.696 | 1.451 | 1.983 | 1.661 | 1.411 | 1.955 | ||||
| Other | 1.094 | 0.925 | 1.292 | 1.106 | 0.933 | 1.312 | 1.164 | 0.977 | 1.386 | 1.165 | 0.974 | 1.394 | ||||
| Site | 0.826 | 0.923 | 0.644 | 0.296 | ||||||||||||
| Right | 1.000 | 1.000 | 1.000 | 1.000 | ||||||||||||
| Left | 0.964 | 0.842 | 1.103 | 1.027 | 0.891 | 1.183 | 1.000 | 0.865 | 1.156 | 1.661 | 1.411 | 1.955 | ||||
| Trans | 1.010 | 0.782 | 1.304 | 0.998 | 0.769 | 1.295 | 0.879 | 0.657 | 1.177 | 1.165 | 0.974 | 1.394 | ||||
| Grade | <0.001 | <0.001 | <0.001 | <0.001 | ||||||||||||
| I | 1.000 | 1.000 | 1.000 | 1.000 | ||||||||||||
| II | 1.357 | 1.040 | 1.771 | 1.275 | 0.964 | 1.686 | 1.380 | 1.033 | 1.843 | 1.661 | 1.411 | 1.955 | ||||
| III/IV | 2.864 | 2.170 | 3.780 | 1.696 | 1.260 | 2.281 | 3.109 | 2.303 | 4.198 | 1.165 | 0.974 | 1.394 | ||||
| Histology | <0.001 | <0.001 | <0.001 | <0.001 | ||||||||||||
| Adenocarcinoma | 1.000 | 1.000 | 1.000 | 1.000 | ||||||||||||
| Mucinous | 1.683 | 1.390 | 2.038 | 1.275 | 0.964 | 1.686 | 1.792 | 1.467 | 2.189 | 1.661 | 1.411 | 1.955 | ||||
| Signet ring | 6.846 | 5.167 | 9.071 | 1.696 | 1.260 | 2.281 | 7.431 | 5.557 | 9.937 | 1.165 | 0.974 | 1.394 | ||||
| T stage | <0.001 | <0.001 | <0.001 | <0.001 | ||||||||||||
| T1 | 1.000 | 1.000 | 1.000 | 1.000 | ||||||||||||
| T2 | 1.658 | 1.173 | 2.344 | 1.631 | 1.110 | 2.397 | 2.091 | 1.356 | 3.225 | 1.986 | 1.231 | 3.205 | ||||
| T3 | 2.935 | 2.186 | 3.942 | 1.947 | 1.383 | 2.741 | 4.295 | 2.942 | 6.270 | 2.605 | 1.692 | 4.011 | ||||
| T4 | 7.572 | 5.589 | 10.259 | 3.694 | 2.585 | 5.279 | 11.980 | 8.151 | 17.608 | 5.317 | 3.410 | 8.290 | ||||
| Nstage | <0.001 | <0.001 | <0.001 | <0.001 | ||||||||||||
| N0 | 1.000 | 1.000 | 1.000 | 1.000 | ||||||||||||
| N1 | 2.243 | 1.949 | 2.581 | 1.573 | 1.348 | 1.835 | 2.717 | 2.323 | 3.177 | 1.986 | 1.231 | 3.205 | ||||
| N2 | 4.205 | 3.647 | 4.847 | 1.446 | 1.179 | 1.773 | 5.270 | 4.504 | 6.168 | 2.605 | 1.692 | 4.011 | ||||
| LNR | 14.712 | 12.022 | 18.003 | <0.001 | 1.444 | 1.285 | 1.624 | <0.001 | 17.382 | 14.101 | 21.426 | <0.001 | 5.532 | 4.003 | 7.644 | <0.001 |
| CEA | <0.001 | <0.001 | <0.001 | <0.001 | ||||||||||||
| NO | 1.000 | 1.000 | 1.000 | 1.000 | ||||||||||||
| Yes | 1.985 | 1.776 | 2.218 | 1.444 | 1.285 | 1.624 | 2.068 | 1.837 | 2.329 | 1.452 | 1.282 | 1.644 | ||||
| PI | <0.001 | <0.001 | <0.001 | <0.001 | ||||||||||||
| NO | 1.000 | 1.000 | 1.000 | 1.000 | ||||||||||||
| Yes | 2.778 | 2.453 | 3.147 | 1.444 | 1.285 | 1.624 | 2.950 | 2.587 | 3.363 | 1.625 | 1.410 | 1.873 | ||||
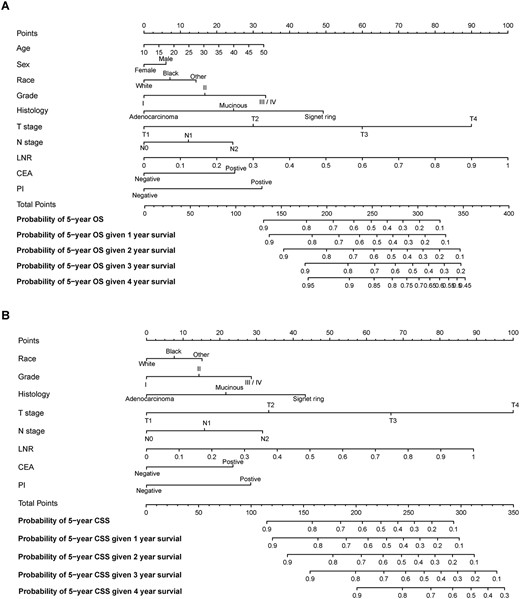
Conditional nomograms for the prediction of the conditional 5-year probability of overall survival (A) and cancer-specific survival (B).
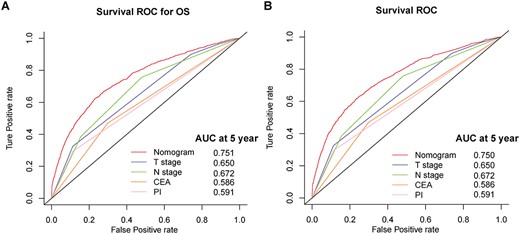
Survival ROC curves of nomograms and other risk factors for overall survival (A) and cancer-specific survival (B) prediction.
Predicting cOS and cCSS with the conditional nomograms
Based on the result of multivariate analysis, nomograms predicting 5-year cOS and cCSS were constructed (Figure 2). The probability of achieving 5-year OS and CSS given 1–4 years survived were illustrated in Figure 3A and B. For example, for the patients with 266 points, the 5-year OS was 40%, which increased to 63% given 3 years already survived. To test the performance of the developed nomograms, we conducted survival ROC analysis and the result showed that the developed nomograms performed better than any other clinicopathological features alone in predicting 5-year cOS (nomogram AUC = 0.751) and cCSS (nomogram AUC = 0.750).
Discussion
CRC is a major disease threatening human health and causing heavy burden on society in consideration of the high level of incidence and mortality. CRC incidence in individuals younger than 50 years, defined as early onset CRC, has been increasing by 2% per year (2). Compared with elderly patients, early onset CRC had better performance status and more likely to complete the treatment plan but having a significantly worse cancer-specific outcome, suggesting more aggressive disease biology of early onset CRC (3). Consequently, the risk stratification for early onset patients should be individualized and more reliable prognosis predicting model should be developed to facilitate clinical decision.
Conventional survival analysis in clinical research investigates the distribution of patients’ survival time from the date of diagnosis or the start of treatment. Estimates of survival based on fixed time point will be probably influence death rate and can mislead both physician and patients. Thus, it becomes important to know how prognosis will change over time taking the patient surviving time into account. Along with extension of survival time, long-term prognosis may improve correspondingly. Conditional survival estimates provide a dynamic assessment of long-term oncological outcomes for patients given periods of time already survived (13,14). Recently, more and more researchers started to focus on conditional survival in cancer management. However, no previous have attempted to develop a prognostic nomogram to predict conditional survival in early onset CRC patient.
In this study, we focused on early onset patients and showed that probability of conditional OS and CSS increases with each additional year survived. Of note, the more years patients had already survived, the better chances of achieving high rate of survival. Notably, CSS rates were close to OS rates and the change trend of conditional CSS remained the same. The reason was few non-cancer deaths as a result of disease and comparatively less comorbidity in patients with early onset patients.
By graphically showing the effect of predictors on the outcome, nomogram gives more tangible interpretation of predictors’ impact on the outcome and is a usable model for clinicians to estimate the survival rate based on some significant clinicopathologic predictors. Based on the independent predictors determined in Cox analysis, two nomograms that predicts the probability of reaching 5-year OS and CSS given 1–4 years survived. Further, the survival ROC analysis showed that the developed nomograms performed good with a considerable AUC value and better than any other factors alone. Upon using nomogram, it can be interpreted by summing up the weighted score assigned to each variable, which is indicated at the top of scale. The total score can be converted to predicted conditional 5-year probability of death and recurrence or metastasis for a patient in the lowest scale. A higher total point was associated with a worse OS and CSS. First of all, the developed nomogram will help us to predict the condition long-term survival. Then, the estimated survival rate will be a critical factor influencing clinician to individualize the treatment and follow-up plan. For example, for the patients with 150 points, the 5-year cancer-specific death rate will be less than 10% given 3 year survival. A shortened follow-up period could be recommended to these patients. On the other hand, for the patients with 300 points, the 5-year cancer-specific death rate will be over 90% even given 2 year survival. An enhanced postoperative chemotherapy could probably be applied on these patients.
To our knowledge, this is the first study designed to develop prognostic nomograms for the prediction of 5-year cOS and cCSS in early onset CRC patients. Though two reliable predictive nomograms were constructed, there are several limitations in this study. First of all, our study is a retrospective analysis based on public database, so selection bias cannot be totally avoided. Secondly, several important therapeutic inform was lacked in SEER database. Thirdly, external validation for the developed nomograms is needed.
In conclusion, it was revealed that the probability of achieving postoperative 5-year OS and CSS for early onset CRC increases gradually with additional time survived and the developed nomograms in this study are fairly valuable and informative in facilitating clinical treatment and follow-up schemes.
Financial support
None.
Conflict of interest statement
None declared.
