


Abstract
The aim of the study was to investigate a prevalence of sarcopenia in patients with gynecological cancer in accordance with current diagnostic criteria of sarcopenia.
A series of 513 patients with gynecological cancer who were intended to newly receive initial or salvage treatment were recruited in a prospective study. Eligible patients were examined with dual energy X-ray absorptiometry and underwent handgrip strength test and the Short Physical Performance Battery before treatment. Sarcopenia was defined as both low skeletal muscle mass (skeletal muscle mass index) and low muscle strength (handgrip strength of <18.0 kg) or both low skeletal muscle mass index and low physical performance (Short Physical Performance Battery score of ≤9).
A total of 475 patients (92.6%) were completely assessed in this study. Eligible patients’ median age was 60 years (range: 29–89 years). Frequencies of patients with low skeletal muscle mass index, low hand grip strength and low Short Physical Performance Battery were 118 (24.8%), 70 (14.7%) and 80 (16.8%), respectively. Sarcopenia was finally identified in 45 patients (9.5%), which accounted for 38.1% of patients with low skeletal muscle mass index, 64.3% of the patients with low hand grip strength and 56.3% of the patients with low physical performance, respectively.
The prevalence of sarcopenia of 9.5% in patients with gynecological malignancy who were scheduled to newly receive an initial or a salvage treatment. A large-scale, nation-wide study might be planned to elucidate an accurate prevalence of sarcopenia among gynecologic cancer patients.
Introduction
Population ageing is a global phenomenon, with most countries experiencing growth in the number and proportion of older persons in their population. In 2019, 703 million people were aged 65 years or over and the percentage share of such people against the total population was 9%. The former figure is expected to become 1.5 billion and the latter become 16% by 2050 [1]. As a result, medical professionals are offering more elderly patients with malignant tumor opportunities to receive medical care. In Japan, the proportions of older persons in total cancer morbidity and mortality were reported to be 70 and 85%, respectively [2]. A certain number of older people live independently while exhibiting cancer. Some older cancer patients, especially presenting with frailty syndrome, lose self-standing ability because of the negative effects of anti-cancer treatment. A low degree of awareness of frailty among physicians might lead to such situation. Sarcopenia is considered to be a geriatric syndrome characterized by age-related decline of skeletal muscle plus low muscle strength and/or physical performance [3]. The definition and diagnosis of sarcopenia are still evolving as new findings challenge general common understanding. There have been various types of diagnostic criteria of sarcopenia [3–8]. Among them, two representative diagnostic criteria, including the Asian Working Group for Sarcopenia (AWGS) criteria [3] and the European Working Group on Sarcopenia in Older People (EWGSOP) criteria [4], have been recently updated. Assessment of skeletal muscle mass, muscle strength and/or physical performance is required for diagnosis of sarcopenia. Earlier criteria involved assessment of appendicular skeletal muscle mass (ASM), handgrip strength and gait speed [5–6]. In updated criteria, substitute measures are proposed including the chair stand test (alternate for handgrip strength), the timed up and go test and the Short Physical Performance Battery (SPPB) as alternatives for gait speed [3–4]. The SPPB is a composite of three separate tests that assess balance, gait and strength by examining an individual’s ability to stand with the feet in side-by-side, semi-tandem and tandem positions, time to walk 4 m, and time to rise from a chair and return to the seated position five times [9]. An international working group has recommended that the test be used as a measure of functional outcomes in clinical trials for frail older persons [10].
In oncological field, there have been two major problems on the prevalence of sarcopenia. First, most existing diagnostic criteria for sarcopenia recommend the use of dual energy X-ray absorptiometry (DEXA) for measuring skeletal muscle mass [3–8]. Briefly, DEXA-based skeletal muscle mass index [SMI (kg/m2)], which is calculated as ASM (kg) divided by the height squared (m2), was indicated as gold standard for assessing low skeletal muscle mass in those criteria. However, earlier studies exclusively used computed tomography (CT)-based SMI (cm2/m2), which is calculated as the total area (cm2) of skeletal muscles at the level of third lumbar vertebra (L3) on CT imaging, divided by height squared (m2) despite it being only surrogate marker for ASM. Second, earlier studies only reported the prevalence of low skeletal muscle mass quantity while claiming that they investigated the prevalence of sarcopenia [11–29]. Briefly, measurement of muscle strength and/or physical performance has not been assessed in those studies. A true prevalence of sarcopenia must not have been clarified in such studies because there must been cancer patients with low skeletal muscle mass but sufficient muscle strength and good physical performance. In the present study, we investigated a true prevalence of sarcopenia in patients with gynecological cancer in accordance with current diagnostic criteria of sarcopenia.
Methods
Patients and evaluators
The present study is part of a wider study for elucidating the prevalence of sarcopenia in patients with gynecological cancer, which is currently ongoing and was carried out using data from an initial group of 513 consecutive patients who were intended to newly receive initial or salvage treatment. The present study period was 2 years between January 2020 and December 2021.
All patients were classified into three disease-status groups: (i) newly, early-stage (FIGO 2018, stage I/II) cancer; (ii) newly, advanced-stage (FIGO 2018, stage III/IV) cancer; (iii) recurrent cancer. All patients were scheduled to be examined with DEXA and underwent handgrip strength test and SPPB before treatment. A total of 38 patients with no data of hand grip test or SPPB were excluded from the study. The breakdown of that is as follows. Twenty-one patients were judged as at high risk of falling down in SPPB assessment by an orthopedic surgeon (T.O.). Three patients were judged as at an extremely low level of spontaneity by an attending physician. Three patients refused to participate in the study. Eleven patients could not undergo SPPB assessment because of the various types of matters whose cause can be attributed to the coronavirus disease 2019 circumstances.
Sarcopenia screening
We applied three different questionnaires to screen sarcopenia. The first was the strength, assistance walking, rise from a chair, climb stairs and falls questionnaires (SARC-F) [30]. The second was SARC-Calf, which is assessed by adding calf circumference to the SARC-F (SARC-Calf) [31]. The performance of SARC-F was evaluated using a cross table for demonstrating true positives (sarcopenia and SARC-F ≥4), false negatives (sarcopenia and normal SARC-F ≤3), false positives (non-sarcopenia and SARC-F ≥4) and true negatives (non-sarcopenia and SARC-F ≤3). The performance of SARC-Calf was evaluated using a cross table for demonstrating true positives (sarcopenia and SARC-Calf ≥11), false negatives (sarcopenia and normal SARC-Calf ≤10), false positives (non-sarcopenia and SARC-Calf ≥11) and true negatives (non-sarcopenia and SARC-Calf ≤10).
The last one was frailty screening index, which was developed by a Japanese research team [32]. It includes simple yes/no questions concerning nutrition/shrinking, physical function, physical activity, forgetfulness and emotions/exhaustion. The index consisted of five items, which are rated as 0 or 1 by the evaluators. The five items are as follows: (i) ‘Have you lost 2 kg or more in the past 6 months?’ Yes = 1; (ii) ‘Do you think you walk slower than before?’ Yes = 1; (iii) ‘Do you take exercise for your health at least once a week?’ No = 1; (iv) ‘Can you recall what happened 5 minutes ago?’ No = 1; (v) ‘In the past two weeks, have you felt tired without a reason?’ Yes = 1. The performance of frailty screening index was evaluated using a cross table for demonstrating true positives (sarcopenia and frailty screening index ≤2), false negatives (sarcopenia and normal frailty screening index ≥3), false positives (non-sarcopenia and frailty screening index ≤2) and true negatives (non-sarcopenia and frailty screening index ≥3). Regardless of results of the questionnaires assessment, all patients were scheduled to be examined with physical assessment including hand grip test and SPPB before treatment.
Definition of low SMI
The EWGSOP, AWGS and IWGS all recommend the use of ASM measured using DEXA to diagnose sarcopenia. ASM was measured using LUNAR iDXA (GE Healthcare Japan Co., Ltd., Tokyo, Japan). SMI (kg/m2), which is calculated as ASM (kg) divided by the height squared (m2), was indicated as gold standard for assessing low skeletal muscle mass in the present study. The standard determined by AWGS [3] was adopted, and low skeletal muscle mass was defined as SMI of <5.40 kg/m2.
Definition of low muscle strength
Handgrip strength was assessed using a Jamar hydraulic dynamometer (Sammons Preston Inc.) with the participant seated with their arm resting on chair arms. Participants were instructed to squeeze the dynamometer at their maximal effort, with the test performed two times on each side and 30 s rest provided between each trial. The best score out of the two trials was recorded. In the present study, the standard determined by AWGS [3] was adopted, and low muscle strength was defined as handgrip strength of <18.0 kg.
Definition of low physical performance
Physical performance was assessed using SPPB, which is composed of three tests including balance test, gait speed test and chair stand test. Each test was scored from 0 to 4 and the total score was the sum of three tests, ranging from 0 to 12. Low physical performance was defined as the total SPPB score of 9 or less. Low physical performance was also defined as the time required to perform chair stand test of ≥12 s.
Balance test
The balance test composed of three parts with progressive difficulty, including unaided side-by-side stand, semi-tandem stand and tandem stand. Patients were asked to remain standing with their feet as close together as possible, then in a semi-tandem position (the heel of one foot against side of big toe of the other foot) and finally in a tandem position (the ankle of one foot directly behind the other foot and touching it). Each position had to be held for 10 s. A success of side-by-side test offered a patient to one point and asked her to undergo semi-tandem test. A failure of side-by-side test urged her to undergo the gait speed test with her point zero. A success of semi-tandem test offered a patient to one point and instructed her to undergo tandem test. A failure of semi-tandem test urged her to undergo the gait speed test with her total point one. A complete success (feet aligned heel to toe for 10 s) of tandem test offered a patient to two points and asked her to undergo the gait speed test. A semi-success (feet aligned heel to toe for 3–9.99 s) of tandem test offered a patient to one point and instructed her to undergo the gait speed test. A failure (feet aligned heel to toe for <3 s) of tandem test urged her to undergo the gait speed test with her total point two.
Profile of the patients included in the study (N = 475)
| Eligible | Ineligible | |
|---|---|---|
| No. of patients | 475 | 38 |
| Age: median (range) | 60 (29–89) | 71 (26–92) |
| Age <40 | 28 (5.9%) | 2 (5.3%) |
| 40 ≦Age <50 | 71 (14.9%) | 5 (13.2%) |
| 50 ≦Age <55 | 62 (13.1%) | 3 (7.9%) |
| 55 ≦Age <60 | 62 (13.1%) | 2 (5.3%) |
| 60 ≦Age <65 | 62 (13.1%) | 4 (10.5%) |
| 65 ≦Age <70 | 62 (13.1%) | 2 (5.3%) |
| 70 ≦Age <75 | 71 (14.9%) | 5 (13.2%) |
| 75 ≦Age <80 | 29 (6.1%) | 4 (10.5%) |
| Age 80≦ | 28 (5.9%) | 11 (28.8%) |
| BMI: mean (standard deviation) | 23.9 (4.94) | 22.1 (4.53) |
| BMI < 18.5 | 44 (9.3%) | 6 (15.8%) |
| 18.5 ≦BMI <30 | 385 (81.0%) | 31 (81.6%) |
| 30 ≦BMI <35 | 30 (6.3%) | 0 (0.0%) |
| BMI 35≦ | 16 (3.4%) | 1 (2.6%) |
| Performance status | ||
| 0 | 412 (86.7%) | 15 (39.5%) |
| 1 | 55 (11.6%) | 5 (13.2%) |
| 2 | 6 (1.3%) | 8 (21.1%) |
| 3 | 2 (0.4%) | 10 (26.3%) |
| 4 | 0 (0.0%) | 0 (0.0%) |
| Disease | ||
| Cervical cancer | 126 (26.5%) | 8 (21.1%) |
| Endometrial cancer | 182 (38.3%) | 14 (36.8%) |
| Ovarian cancer | 151 (31.8%) | 13 (34.2%) |
| Other types of cancer | 16 (3.4%) | 3 (7.9%) |
| Disease status | ||
| Newly, early-stage | 207 (43.6%) | 9 (23.7%) |
| Newly, advanced-stage | 162 (34.1%) | 20 (52.6%) |
| Recurrent | 106 (22.3%) | 9 (23.7%) |
BMI, body mass index.
Gait speed test
The gait speed test was assessed by measuring the time required to walk 4 m at their usual pace. It was repeated twice and the analysis used the shorter time of the two. Four points were given to a patient if it takes <4.82 s to complete this task, three points if it takes 4.82–6.20 s, two points if it takes 6.21–8.70 s, one point if it takes >8.70 s and null point if a patient cannot complete the task.
Chair stand test
The chair stand test composed of two parts including a pre-test and a test. For a pre-test, patients were asked to fold their arms across their chest and try to stand up once from a chair. If she cannot complete this task, null point was given to her. The chair stand test was assessed by measuring the time required to perform five rises from a chair to an upright position as fast as possible without the use of their arms. Four points were given to a patient if it takes ≤11.19 s to complete this task, three points if it takes 11.20–13.69 s, two points if it takes 13.70–16.69 s, one point if it takes 16.70–60 s and null point if it takes >60 s or a patient cannot complete the task.
Definition of sarcopenia
Diagnosing sarcopenia requires measurement of both muscle quantity and quality. Sarcopenia was defined as both low skeletal muscle mass (SMI < 5.40 kg/m2.) and low muscle strength (handgrip strength of <18.0 kg) or both low SMI and low physical performance (SPPB score of ≤9 or the time required to perform char stand test ≥12 s). Severe sarcopenia was defined as low skeletal muscle mass, low muscle strength and low physical performance.
Statistical analysis
Unpaired numerical data were compared with Student’s unpaired t-test. Proportional data were compared using the chi-square test or Fisher’s exact test. The statistical significance level was set at P < 0.05. Receiver operating characteristic (ROC) curves were used to evaluate the performance of SARC-F, SARC-Calf and frailty screening index for detecting sarcopenia. Statistical analyses of ROC curves were performed with EZR version 1.54. The statistical significance level was set at P < 0.05. Interpretations of AUC values were as follows: high accuracy, AUC 0.9–1.0; moderate accuracy, AUC 0.7–0.9 and low accuracy, AUC 0.5–0.7.
Results
Table 1 shows the clinical characteristics of the patients included in this study. A total of 38 patients (7.4%) were excluded from the study. Of the ineligible patients, nine (23.7%) had performance status of 3. Eligible patients’ median age was 60 years (range: 29–89 years) and mean body mass index (BMI) was 23.9 (standard deviation: 4.95). Of the 475 patients who underwent complete assessment including DXA, hand grip test and SPPB, 45 patients (9.5%) were confirmed as being sarcopenia (Fig. 1).

Outline of the present study.
Frequency distribution bar graphs regarding SMI are shown in Fig. 2. Median SMI was 6.02 kg/m2 (range: 4.10–10.03) and mean SMI was 6.13 kg/m2 (standard deviation: 1.03). One hundred eighteen patients (24.8%) were confirmed as low SMI. Patients with sarcopenia accounted for 38.1% of the patients with low SMI. Frequency distribution bar graphs regarding hand grip test are shown in Fig. 3. Median hand grip strength was 22.9 kg (range: 6.9–40.7) and mean hand grip strength was 23.2 kg (standard deviation: 5.31). Seventy patients (14.7%) were confirmed as low hand grip strength. Patients with sarcopenia accounted for 64.3% of the patients with low hand grip strength. Frequency distribution bar graphs regarding SPPB are also shown in Fig. 3. Median SPPB score was 12 and the grade of highest frequency was 12. Eighty patients (16.8%) were confirmed as low physical performance. Sarcopenia patients accounted for 56.3% of the patients with low physical performance.
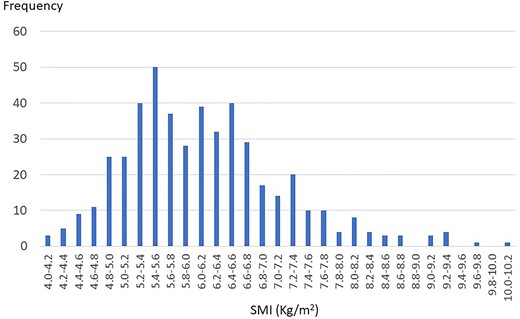
Frequency distribution bar graphs regarding SMI (Kg/m2).
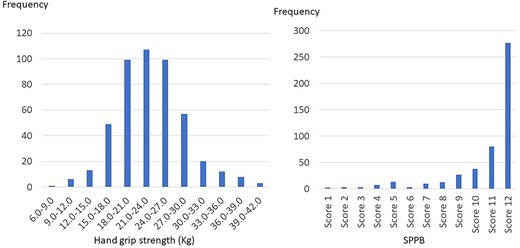
Frequency distribution bar graphs regarding hand grip strength and SPPB score.
The prevalence of sarcopenia by age, BMI and disease status is shown in Table 2. The prevalence of sarcopenia in women aged ≥70 years old was significantly higher than that in women aged <70 years old (21.1% vs. 5.2%, P < 0.0001). The prevalence of sarcopenia in women with BMI of <18.5 was significantly higher than that in women with BMI of ≥18.5 (22.7% vs. 8.1%, P = 0.0016). The prevalence of sarcopenia in women with newly, early-stage disease tended to be higher than that in women with newly, advanced-stage disease/recurrent disease (11.6% vs. 6.8%, P = 0.076).
Prevalence of sarcopenia by age, BMI and disease status
| N | Sarcopenia: n (%) | Low SMI (<5.40 kg/m2): n (%) | Low hand grip test (<18.0 kg): n (%) | |
|---|---|---|---|---|
| Total | 475 | 45 (9.5%) | 118 (24.8%) | 70 (14.7%) |
| Age | ||||
| Age <40 | 28 | 1 (3.6%) | 9 (32.1%) | 1 (3.6%) |
| 40 ≦Age <50 | 71 | 2 (2.8%) | 12 (16.9%) | 5 (7.0%) |
| 50 ≦Age <55 | 62 | 3 (4.8%) | 14 (22.6%) | 3 (4.8%) |
| 55 ≦Age <60 | 62 | 7 (11.3%) | 20 (32.3%) | 10 (16.1%) |
| 60 ≦Age <65 | 62 | 0 (0.0%) | 9 (14.5%) | 5 (8.1%) |
| 65 ≦Age <70 | 62 | 5 (8.1%) | 16 (25.8%) | 11 (17.7%) |
| 70 ≦Age <75 | 71 | 14 (19.7%) | 21 (29.6%) | 14 (19.7%) |
| 75 ≦Age <80 | 29 | 6 (20.7%) | 9 (31.0%) | 7 (24.1%) |
| Age 80≦ | 28 | 7 (25.0%) | 8 (28.6%) | 14 (50.0%) |
| BMI | ||||
| BMI < 18.5 | 44 | 10 (22.7%) | 37 (84.1%) | 9 (20.5%) |
| 18.5 ≦BMI <30 | 385 | 35 (9.1%) | 81 (21.0%) | 55 (14.3%) |
| 30 ≦BMI <35 | 30 | 0 (0.0%) | 0 (0.0%) | 6 (20.0%) |
| BMI 35≦ | 16 | 0 (0.0%) | 0 (0.0%) | 0 (0.0%) |
| Disease status | ||||
| Newly, early-stage | 207 | 14 (6.8%) | 39 (18.8%) | 23 (11.1%) |
| Newly, advanced-stage | 162 | 19 (11.7%) | 50 (30.9%) | 28 (17.3%) |
| Recurrent | 106 | 12 (11.3%) | 29 (27.4%) | 19 (17.9%) |
SMI, skeletal muscle mass index.
The performance of pretreatment query assessments for predicting sarcopenia is shown in Table 3. In light of SARC-F, sensitivity, specificity, positive predictive value and negative predictive value were 31.1, 95.1, 40.0 and 93.0%, respectively, and AUC value was 0.738 (95% confidence interval, 0.659–0.816). In light of SARC-Calf, sensitivity, specificity, positive predictive value and negative predictive value were 66.7, 87.4, 35.7 and 96.2%, respectively, and AUC value was 0.874 (95% confidence interval, 0.825–0.924). In light of frailty screening index, sensitivity, specificity, positive predictive value and negative predictive value were 46.7, 77.9, 18.1 and 93.3%, respectively, and AUC value was 0.639 (95% confidence interval, 0.545–0.733). The former two calculated AUC values reached a moderate accuracy level, while the last did a low level.
Performance of pretreatment query assessments for predicting sarcopenia
| SARC-F | SARC-Calf | Frailty screening index | |
|---|---|---|---|
| True positive (n) | 14 | 30 | 21 |
| False negative (n) | 31 | 15 | 24 |
| False positive (n) | 21 | 54 | 95 |
| True negative (n) | 409 | 376 | 335 |
| Sensitivity (%) | 31.1% | 66.7% | 46.7% |
| Specificity (%) | 95.1% | 87.4% | 77.9% |
| Positive predictive value (%) | 40.0% | 35.7% | 18.1% |
| Negative predictive value (%) | 93.0% | 96.2% | 93.3% |
| Accuracy | 89.1% | 85.5% | 74.9% |
| Positive likelihood ratio | 6.370 | 5.309 | 2.112 |
| Negative likelihood ratio | 0.724 | 0.381 | 0.685 |
| AUC (95% confidence interval) | 0.738 (0.659–0.816) | 0.874 (0.825–0.924) | 0.639 (0.545–0.733) |
SARC-F, strength, assistance walking, rise from a chair, climb stairs, and falls questionnaires; SARC-Calf, adding calf circumference to the SARC-F.
Discussion
The present study reported the prevalence of sarcopenia of 9.5% in patients with gynecological malignancy who were scheduled to newly receive an initial or a salvage treatment. As described in Introduction, there have been major problems on the prevalence of sarcopenia in oncological field. Earlier studies [11–29], it must be confessed, have reported inaccurate information on the prevalence of sarcopenia because just assessment of muscle mass has been performed but assessment of muscle strength and physical performance has not been done in those studies. Indeed, in the current study, just 38.1% of patients with low muscle mass quantity were consequently confirmed as sarcopenia. Sarcopenia is not to be confused with low muscle mass quantity. As far as we know, there have been few reports on the prevalence of ‘true’ sarcopenia in the oncological field, of course, no report in gynecological field. Our study might have provided highly reliable information on the prevalence of ‘true’ sarcopenia as a consequence of being marked by a superlative quality and a rarity.
Since there have been some earlier studies which reported a significant relationship between low muscle mass quantity and poor prognosis in oncological field, we also intend to research an association of ‘true’ sarcopenia with poor prognosis. To analyze the association, potential confounding prognostic factors including age, BMI, treatment, comorbidity and malignant disease status must be investigated in a multivariate analysis. If it became to clarify a significant association of ‘true’ sarcopenia with poor prognosis, an efficient screening method to detect ‘true’ sarcopenia needs to be established. SARC-F, SARC-Calf and frailty screening index might be potential screening methods. However, these methods resulted in insufficient screening performance to detect ‘true’ sarcopenia in the current study. It might be necessary to develop more efficient screening program in the near future.
The current study also involved several limitations that should be considered. First, the number of patients was too small to provide conclusive results. Second, it is difficult to distinguish sarcopenia from cachexia in oncological field, especially in patients with advanced-stage disease or recurrent disease, because sarcopenia and cachexia are intricately intertwined. A positive relationship between sarcopenia and poor prognosis could tend to be provided as study population include more cachexic patients. However, it seems that implementation of SPPB assessment, in effect, impossible in majority of cachexic patients. We inferred that the majority of patients who might be considered as cachexia were unconsciously excluded from the present study. Third, muscle mass quantity might be overestimated in a certain kind of patients who are in a special body composition status, for example, in an edematous status due to a large number of ascites or a huge-sized tumor. In the current study, such a concern was not taken into consideration. Fourth, we defined low skeletal muscle mass as SMI of 5.40 kg/m2 or lower, in accordance with the Asian guidelines on sarcopenia. In Japan, Sanada et al. conducted a cross-sectional study of sarcopenia in which ASM was measured using DEXA and reported a value that was 2 standard deviations below the mean SMI for healthy participants aged 18–40 years, which was 5.46 kg/m2 for women [33].
In conclusion, the prevalence of sarcopenia of 9.5% in patients with gynecological malignancy who were scheduled to newly receive an initial or a salvage treatment. In the future, a large-scale, nation-wide study might be planned to elucidate an accurate prevalence of sarcopenia among gynecologic cancer patients.
Conflict of interest statement
The authors have no conflicts of interest to report regarding the research content, conclusions and significance of this study.
